. 2023 Jun 13;120(24):e2303392120.
doi: 10.1073/pnas.2303392120. Epub 2023 Jun 5.

The Drosophila chemokine-like Orion bridges phosphatidylserine and Draper in phagocytosis of neurons

Affiliations

The Drosophila chemokine-like Orion bridges phosphatidylserine and Draper in phagocytosis of neurons

Hui Ji et al. Proc Natl Acad Sci U S A. .

Abstract

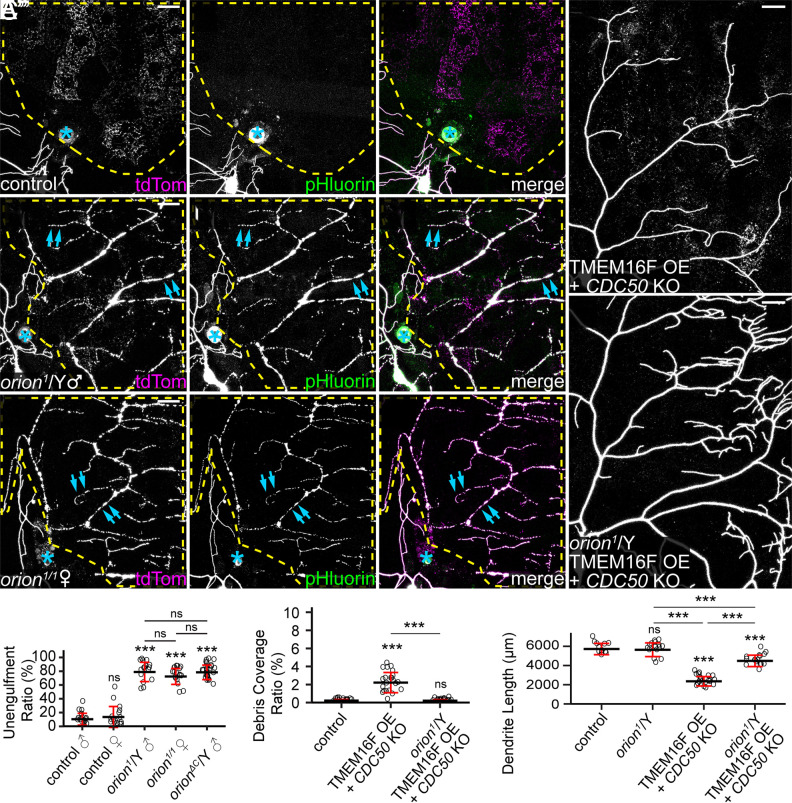
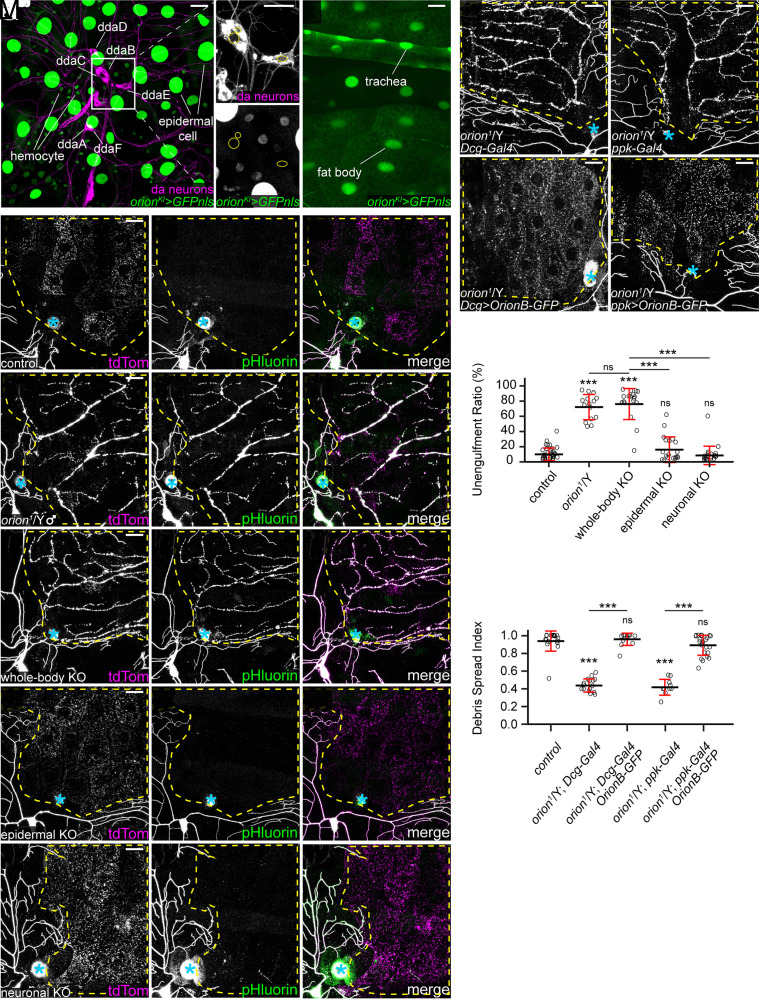
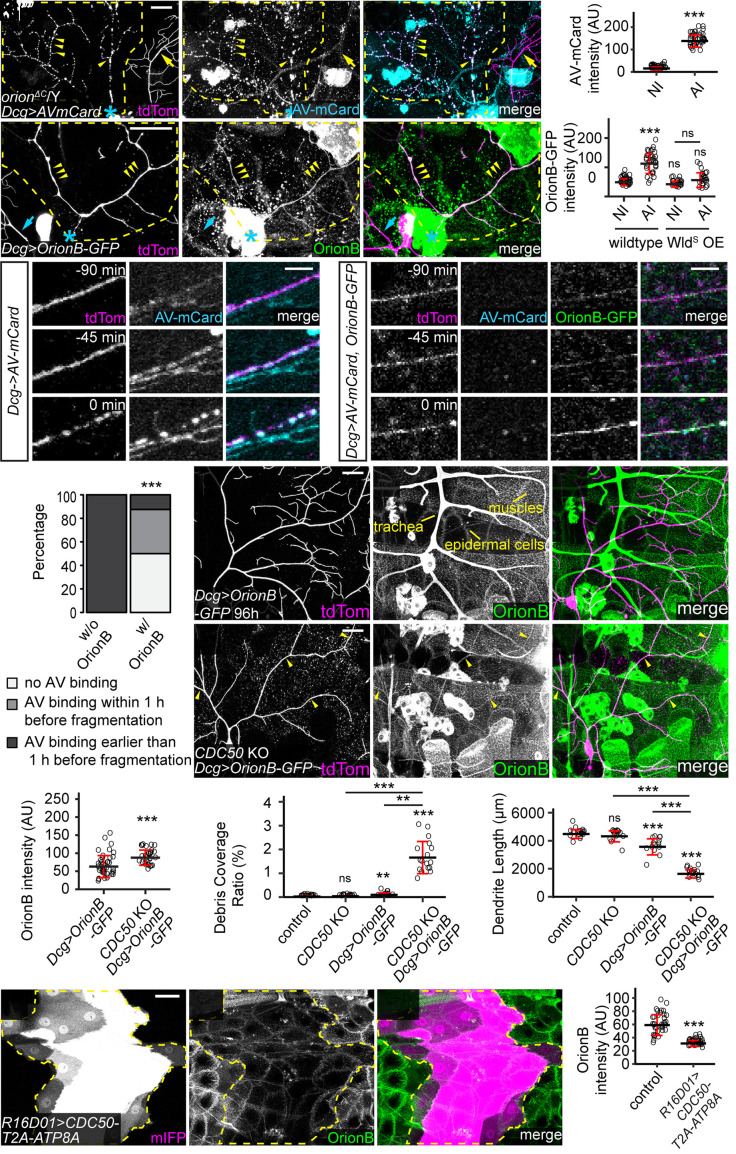
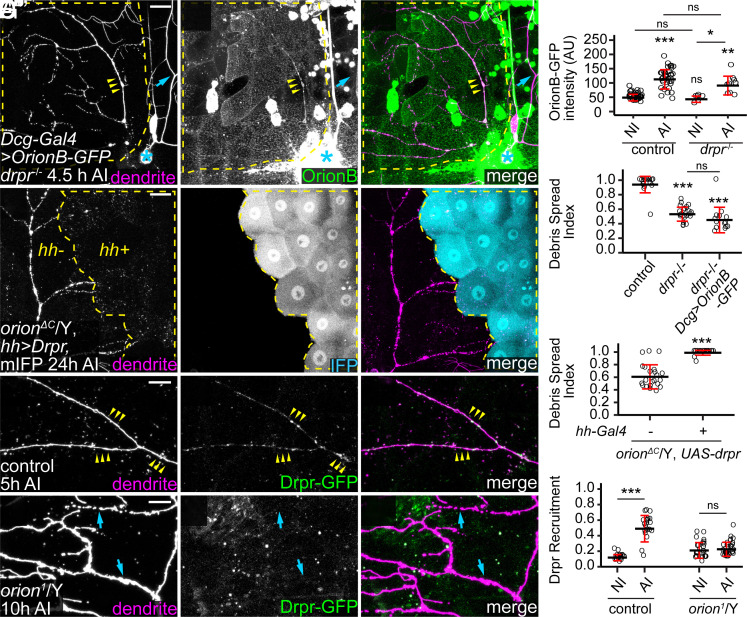
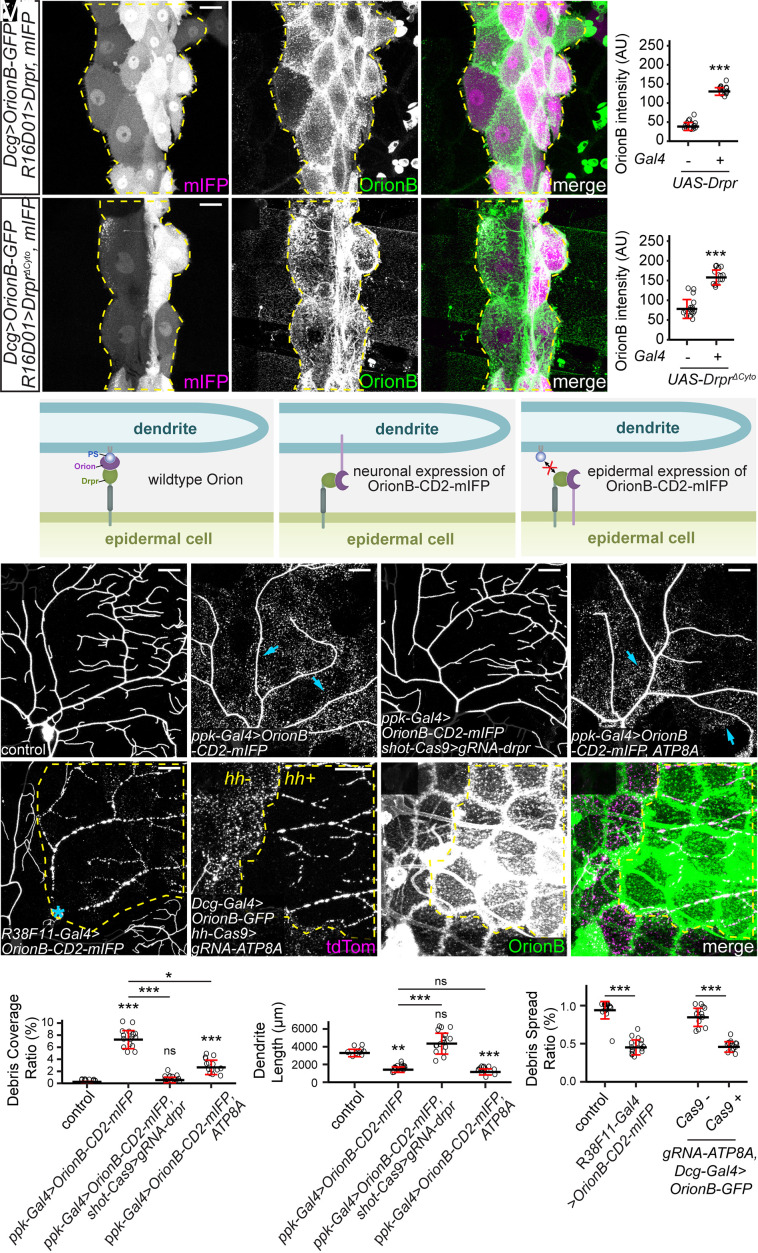
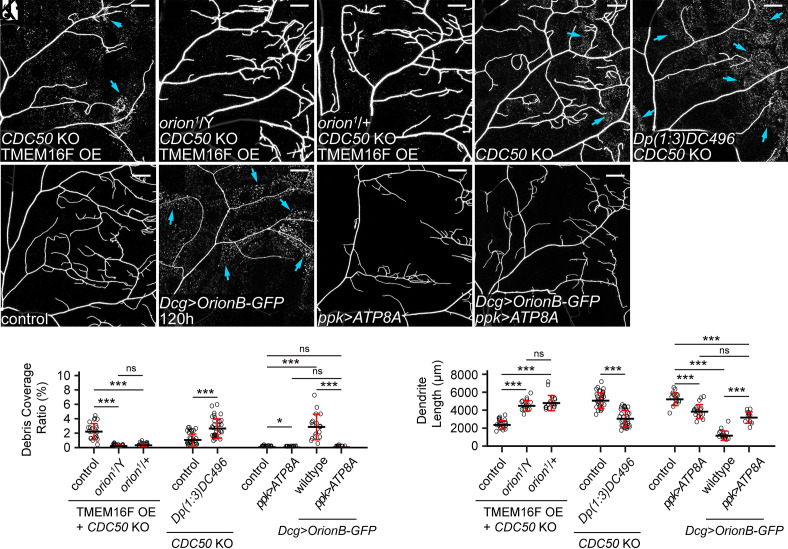
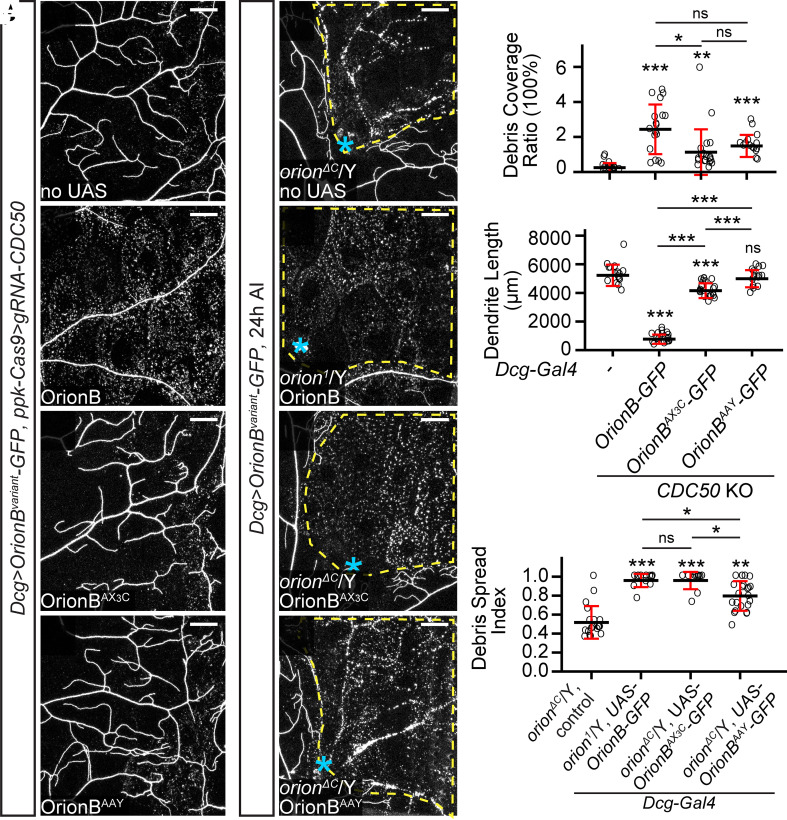
Phagocytic clearance of degenerating neurons is triggered by "eat-me" signals exposed on the neuronal surface. The conserved neuronal eat-me signal phosphatidylserine (PS) and the engulfment receptor Draper (Drpr) mediate phagocytosis of degenerating neurons in Drosophila. However, how PS is recognized by Drpr-expressing phagocytes in vivo remains poorly understood. Using multiple models of dendrite degeneration, we show that the Drosophila chemokine-like protein Orion can bind to PS and is responsible for detecting PS exposure on neurons; it is supplied cell-non-autonomously to coat PS-exposing dendrites and to mediate interactions between PS and Drpr, thus enabling phagocytosis. As a result, the accumulation of Orion on neurons and on phagocytes produces opposite outcomes by potentiating and suppressing phagocytosis, respectively. Moreover, the Orion dosage is a key determinant of the sensitivity of phagocytes to PS exposed on neurons. Lastly, mutagenesis analyses show that the sequence motifs shared between Orion and human immunomodulatory proteins are important for Orion function. Thus, our results uncover a missing link in PS-mediated phagocytosis in Drosophila and imply conserved mechanisms of phagocytosis of neurons.

Keywords: Orion; da neurons; epidermal cells; phagocytosis; phosphatidylserine.


Conflict of interest statement

The authors declare no competing interest.

Figures

Fig. 1.
Fig. 1.
orion is required for phagocytosis of dendrites in multiple dendrite degeneration paradigms. (AC”) Partial dendritic fields of ddaC neurons in control (AA”), orion1 hemizygous (BB”), and orion1 homozygous (CC”) larvae at 22 to 24 h after injury (AI). Yellow dash outlines: territories originally covered by injured dendrites; blue asterisks: injury sites; blue arrows: injured but unengulfed dendrite fragments. (D) Quantification of unengulfment ratio of injured dendrites (pHluorin-positive debris area/tdTom-positive debris area). n = number of neurons and N = number of animals: control males (n = 18, N = 10); control females (n = 16, N = 9); orion1/Y (n = 16, N = 8); orion1/1 (n = 18, N = 9); orionΔC/Y (n = 25, N = 12). One-way ANOVA and Tukey’s test. (E and F) Partial dendritic fields of TMEM16F OE + CDC50 KO neurons in the wild-type background (E) and orion1 hemizygous background (F). (G and H) Quantification of debris coverage ratio (percentage of debris area normalized by dendrite area) (G) and dendrite length (H) at 140 h after egg laying (AEL). n = number of neurons and N = number of animals: control (n = 14, N = 7); orion1/Y (n = 15, N = 8); TMEM16F OE + CDC50 KO (n = 22, N = 11); TMEM16F OE + CDC50 KO in orion1/Y (n = 16, N = 8). For (G), Kruskal–Wallis (one-way ANOVA on ranks) and Dunn’s test, P-values adjusted with the Benjamini–Hochberg method; for (H), one-way ANOVA and Tukey’s test. In all image panels, neurons were labeled by ppk-MApHS. (Scale bars, 25 μm.) For all quantifications, ***P ≤ 0.001; n.s., not significant. The significance level above each genotype is for comparison with the control. Black bar, mean; red bar, SD. See also SI Appendix, Fig. S1.
Fig. 2.
Fig. 2.
Orion functions cell-non-autonomously. (A and B) GFPnls expression driven by orion-LexA (orionKI) in epidermal cells, hemocytes (A), trachea, and fat body (B), but not in da neurons (A, Insets). Yellow circles indicate nuclei of ddaB, ddaC, and ddaE neurons (A). [Scale bars, 25 μm (A), 10 μm (A Insets), and 50 μm (B).] (CG”) Partial dendritic fields of neurons in control (CC”, same images as Fig. 1 AA”), orion1 hemizygotes (DD”, same images as Fig. 1 BB” for clarity), whole-body orion KO (EE”), epidermal orion KO (FF”), and neuronal orion KO (GG”) at 22 to 24 h AI. (HK) Partial dendritic fields of ddaC neurons in orion1 hemizygotes with fat body Gal4 (H), with OrionB-GFP OE in the fat body (I), with neuron Gal4 (J), and with OrionB-GFP OE in neurons (K) at 22 to 24 h AI. (L) Quantification of unengulfment ratio of injured dendrites. n = number of neurons and N = number of animals: control and orion1/Y (same dataset as in Fig. 1D); whole-body orion KO (n = 18, N = 10); epidermal orion KO (n = 19, N = 11); neuronal orion KO (n = 21, N = 11). One-way ANOVA and Tukey’s test. (M) Quantification of debris spread index of injured dendrites (area ratio of all 15 pixel × 15 pixel squares that contained dendrite debris in the region of interest). n = number of neurons and N = number of animals: orion1/Y (n = 18, N = 10); Dcg-Gal4 in orion1/Y (n = 16, N = 9); Dcg>OrionB-GFP in orion1/Y (n = 13, N = 7); ppk-Gal4 in orion1/Y (n = 10, N = 6); ppk>OrionB-GFP in orion1/Y (n = 24, N = 12). One-way ANOVA and Tukey’s test. Neurons were labeled by 21-7>UAS-CD4-tdTom (A and B), ppk-MApHS (CG”), ppk-CD4-tdTom (H and I), and ppk>CD4-tdTom (J and K). In (CK), yellow dash outlines: territories originally covered by injured dendrites; blue asterisks: injury sites; (scale bars, 25 μm.) For all quantifications, ***P ≤ 0.001; n.s., not significant. The significance level above each genotype is for comparison with the control. Black bar, mean; red bar, SD. See also SI Appendix, Fig. S2.
Fig. 3.
Fig. 3.
PS exposure induces Orion binding to the cell surface. (AA”) Labeling of injured dendrites of a ddaC neuron by AV-mCard at 23 h AI in orionΔC hemizygous larvae. Yellow arrowheads: injured dendrites with AV-mCard labeling; yellow arrows: uninjured dendrites lacking AV-mCard labeling. (B) Quantification of AV-mCard binding on dendrites. AV-mCard intensities were measured on both uninjured (NI) and injured (AI) dendrites. n = number of measurements and N = number of animals: NI (n = 39, N = 8); AI (n = 39, N = 8). Welch’s t test. (CC”) Labeling of injured dendrites of a ddaC neuron by Orion-GFP at 6 h AI in wild-type larvae. Yellow arrowheads: injured dendrites with OrionB-GFP labeling. (D) Quantification of Orion-GFP binding on dendrites of wild-type and WldS OE neurons. n = number of measurements and N = number of animals: wild-type NI (n = 39, N = 10); wild-type AI (n = 36, N = 10); WldS OE NI (n = 22, N = 6); WldS OE AI (n = 23, N = 6). Kruskal–Wallis (one-way ANOVA on ranks) and Dunn’s test, P-values adjusted with the Benjamini–Hochberg method. (E and F) Time series of injured dendrites of ddaC neurons from 90 min before fragmentation to the moment of fragmentation, with only AV-mCard expressed (E) or both OrionB-GFP and AV-mCard coexpressed (F) by the fat body. Time stamps are relative to the frame of dendrite fragmentation. (G) Percentages of injured dendrites showing no AV binding, AV binding within 1 h before fragmentation, AV binding earlier than 1 h before fragmentation. n = number of measurements and N = number of animals: w/o OrionB OE (n = 9, N = 5); w/ OrionB OE (n = 8, N = 3). Fisher’s exact test. (HI”) Distribution of fat body–derived OrionB-GFP with wild-type (HH”) and CDC50 KO (II”) dendrites at 96 h AEL. Peripheral tissues showing OrionB binding are labeled in (H’). Yellow arrowheads indicate OrionB binding on CDC50 KO dendrites (II”). (J) Quantification of OrionB-GFP binding on wild-type and CDC50 KO dendrites. n = number of measurements: Dcg>OrionB-GFP (n = 41, N = 7); CDC50 KO + Dcg>OrionB-GFP (n = 29, N = 6). Welch’s t-test. (K and L) Quantification of debris coverage ratio (K) and dendrite length (L) at 96 h AEL. n = number of neurons and N = number of animals: control (n = 17, N = 9); CDC50 KO (n = 15, N = 8); Dcg>OrionB-GFP (n = 13, N = 8); CDC50 KO + Dcg>OrionB-GFP (n = 17, N = 9). For (K), Kruskal–Wallis (one-way ANOVA on ranks) and Dunn’s test, P-values adjusted with the Benjamini–Hochberg method; for (L), one-way ANOVA and Tukey’s test. (MM”) OrionB-GFP binding on epidermal cells that expressed CDC50-T2A-ATP8A. Yellow dash outlines: CDC50-T2A-ATP8A overexpressing region. (N) Quantification of OrionB-GFP binding on wild-type epidermal cells and CDC50-T2A-ATP8A OE epidermal cells. n = number of measurements and N = number of animals: control (n = 36, N = 9); R16D01>CDC50-T2A-ATP8A (n = 36, N = 9). Welch’s t test. In (AA”) and (CC”), yellow dash outlines: territories originally covered by injured dendrites; blue asterisks: injury sites. Neurons were labeled by ppk-MApHS (AA” and EE”) and ppk-CD4-tdTom (CC”, FF”, and HI”). [Scale bars, 25 μm (AA”, CC”, and HI”), 5 μm (E and F), and 50 μm (MM”).] For all quantifications, **P ≤ 0.01, ***P ≤ 0.001; n.s., not significant. The significance level above each genotype is for comparison with the control. Black bar, mean; red bar, SD. See also Movies S1–S3 and SI Appendix, Fig. S3.
Fig. 4.
Fig. 4.
Orion recruits epidermal Drpr to injured dendrites. (AA”) Labeling of injured dendrites of a ddaC neuron by OrionB-GFP in drpr−/− at 4.5 h AI. Yellow arrowheads: injured dendrites with OrionB-GFP labeling; blue arrows: uninjured dendrites lacking OrionB-GFP binding. (B) Quantification of Orion-GFP binding on dendrites in the wild-type and the drpr−/− larvae. n = number of measurements and N = number of animals: wild-type NI and wild-type AI (same dataset as in Fig. 3D); drpr−/− NI (n = 6, N = 2); drpr−/− AI (n = 9, N = 3). Kruskal–Wallis (one-way ANOVA on ranks) and Dunn’s test, P-values adjusted with the Benjamini–Hochberg method. (C) Quantification of debris spread index of injured dendrites at 22 to 24 h AI. n = number of neurons and N = number of animals: control (same dataset as in Fig. 2M); drpr−/− (n = 23, N = 10); drpr−/− + Dcg>OrionB-GFP (n = 14, N = 7). One-way ANOVA and Tukey’s test. (DD”) Engulfment of injured dendrites in an orionΔC hemizygous larva with Drpr overexpressed in the hh domain. Yellow dash outlines: hh>Drpr, mIFP region. (E) Quantification of debris spread index of injured dendrites at 22 to 24 h AI in region without Drpr OE and region with Drpr OE in orionΔC/Y. n = number of neurons and N = number of animals: region without Drpr OE (n = 22, N = 12) and region with Drpr OE (n = 24, N = 12). Welch’s t test. (FF”) Distribution of Drpr-GFP in the presence of injured dendrites in control at 5 h AI (FF”) and in orion1/Y at 10 h AI (GG”). Yellow arrowheads (FF”): injured dendrites with Drpr-GFP recruitment; blue arrowheads (GG”): injured dendrites lacking Drpr-GFP recruitment. (H) Quantification of Drpr-GFP recruitment (Drpr-GFP-positive area on dendrites/total dendrite area). n = measurements: control NI (n = 20, N = 12); control AI (n = 21, N = 12); orion1/Y NI (n = 27, N = 8); orion1/Y AI (n = 31, N = 8). Welch’s t test. For all image panels, neurons were labeled by ppk-CD4-tdTom. Yellow dash outlines: territories originally covered by injured dendrites; blue asterisks: injury sites. [Scale bars, 25 μm (AA”, DD”) and 10 μm (FG”).] For all quantifications, *P ≤ 0.05, **P ≤ 0.01, ***P ≤ 0.001; n.s., not significant. The significance level above each genotype is for comparison with the control. Black bar, mean; red bar, SD. See also SI Appendix, Fig. S4.
Fig. 5.
Fig. 5.
Orion mediates the interaction between PS and Drpr. (AA”) Distribution of fat body–derived OrionB-GFP with Drpr overexpressed in a patch of epidermal cells driven by R16D01-Gal4. mIFP was coexpressed with Drpr and thus the mIFP intensity is correlated with the Gal4 activity. Yellow dash outlines: Drpr OE region. (B) Quantification of Orion-GFP binding on epidermal cells with or without Drpr OE. n = number of measurements and N = number of animals: without Drpr OE (n = 16, N = 8); with Drpr OE (n = 16, N = 8). Welch’s t test. (C-C") Distribution of fat body–derived OrionB-GFP with DrprΔCyto overexpressed in a patch of epidermal cells (labeled by mIFP). Yellow dash outlines: DrprΔCyto OE region. (D) Quantification of Orion-GFP binding on epidermal cells with or without DrprΔCyto OE. n = number of measurements and N = number of animals: without DrprΔCyto OE (n = 16, N = 8); with DrprΔCyto OE (n = 14, N = 7). Welch’s t test. (E) Models of Orion function in mediating PS–Drpr interaction (Left), interactions between Drpr and Orion-CD2-mIFP overexpressed by neurons (Middle) or epidermal cells (Right). (FI) Partial dendritic fields of a control ddaC neuron (F), an OroinB-CD2-mIFP OE neuron (G), an OroinB-CD2-mIFP OE neuron with drpr KO in epidermal cells (H), and an OroinB-CD2-mIFP + ATP8A OE neuron (I). (JK) Quantification of debris coverage ratio (J) and dendrite length (K) at 96 h AEL. n = number of neurons and N = number of animals: control (n = 10, N = 6); ppk-Gal4>OroinB-CD2-mIFP (n = 17, N = 9); ppk-Gal4>OroinB-CD2-mIFP + shot-Cas9>gRNA-drpr (n = 17, N = 9); ppk-Gal4>OroinB-CD2-mIFP, ATP8A (n = 14, N = 7). Kruskal–Wallis (one-way ANOVA on ranks) and Dunn’s test, P-values adjusted with the Benjamini–Hochberg method. (L) Partial dendritic field of an injured ddaC neuron at 25 h AI with OroinB-CD2-mIFP expressed in all epidermal cells. (MM”) Partial dendritic field of an injured ddaC neuron at 9 h AI when OroinB-GFP was expressed in fat body and ATP8A was knocked out in hh-epidermal cells. (N) Quantification of debris spread index of injured dendrites. n = number of neurons and N = number of animals: control (n = 18, N = 10); R38F11>OroinB-CD2-mIFP (n = 16, N = 8); Dcg-Gal4>OrionB (n = 14, N = 8); Dcg-Gal4>OrionB + hh-Cas9>ATP8A (n = 13, N = 8). Welch’s t test. Neurons were labeled by ppk-MApHS (FI) and ppk-CD4-tdTom (L and MM”). For all image panels, (scale bars, 25 μm.) For all quantifications, *P ≤ 0.05, **P ≤ 0.01, ***P ≤ 0.001; n.s., not significant. The significance level above each genotype is for comparison with the control. Black bar, mean; red bar, SD. See also SI Appendix, Fig. S5.
Fig. 6.
Fig. 6.
The Orion dosage determines the sensitivity of epidermal cells to PS-exposing dendrites. (AC) Partial dendritic fields of a TMEM16F OE + CDC50 KO ddaC neuron in the WT background (A, same image as Fig. 1E), in the orion1 hemizygous background (B, same image as Fig. 1F), and in the orion1 heterozygous background (C). (D and E) Partial dendritic fields of CDC50 KO neurons in the control (D) and Dp(1;3)DC496 (E) at 120 h AEL. Blue arrows: debris shed from dendrites. (FI) Partial dendritic fields of ddaC neurons in the control (F), with fat body–derived OrionB-GFP (G), with ATP8A OE in the neuron (H), and with fat body–derived OrionB-GFP and ATP8A OE in the neuron (I) at 120 h AEL. (J and K) Quantification of debris coverage ratio (J) and dendrite length (K). n = number of neurons and N = number of animals: for TMEM16F OE + CDC50 KO, control and orion1/Y (same dataset as in Fig. 1G), orion1/+ (n = 18, N = 9); for (J), Kruskal–Wallis (one-way ANOVA on ranks) and Dunn’s test, P-values adjusted with the Benjamini–Hochberg method; for (K), one-way ANOVA and Tukey’s test. For CDC50 KO, control (n = 33, N = 17), Dp(1;3)DC496 (n = 33, N = 17), Welch’s t test. For effects of Dcg>OrionB-GFP and ppk>ATP8A at 120 h AEL, control (n = 17, N = 9), ppk>ATP8A (n = 17, N = 9), Dcg>OrionB-GFP (n = 17, N = 9), ppk>ATP8A + Dcg>OrionB-GFP (n = 12, N = 7); for (J), Kruskal–Wallis (one-way ANOVA on ranks) and Dunn’s test, P-values adjusted with the Benjamini–Hochberg method; for (K), one-way ANOVA and Tukey’s test. Neurons were labeled by ppk-MApHS (AC and H), ppk-CD4-tdTom (DG), and ppk-Gal4>CD4-tdTom (I). For all image panels, (scale bars, 25 μm.) For all quantifications, *P ≤ 0.05, ***P ≤ 0.001; n.s., not significant. The significance level above each genotype is for comparison with the control. Black bar, mean; red bars, SD. See also SI Appendix, Fig. S6.
Fig. 7.
Fig. 7.
CX3C and RRY motifs are important for Orion function. (AD) Partial dendritic fields of CDC5O KO ddaC neurons without OrionB variants (A), with WT OrionB-GFP (B), OrionBAX3C-GFP (C), and OrionBAAY-GFP (D) expressed in the fat body at 120 h AEL. (EH) Partial dendritic fields of ddaC neurons in orionΔC or orion1 hemizygous larvae without OrionB variants (E), with WT OrionB-GFP (F), OrionBAX3C-GFP (G), and OrionBAAY-GFP (H) expressed in the fat body at 22 to 24 h AI. Yellow dash outlines: territories originally covered by injured dendrites; blue asterisks: injury sites. (I and J) Quantification of debris coverage ratio (I) and dendrite length (J) at 120 h AEL. n = number of neurons and N = number of animals: CDC50 KO control (n = 16, N = 8); CDC50 KO + Dcg>OrionB-GFP (n = 18, N = 9); CDC50 KO + Dcg>OrionBAX3C-GFP (n = 20, N = 10); CDC50 KO + Dcg>OrionBAAY-GFP (n = 16, N = 8). For (I), Kruskal–Wallis (one-way ANOVA on ranks) and Dunn’s test, P-values adjusted with the Benjamini–Hochberg method; for (J), one-way ANOVA and Tukey’s test. (K) Quantification of debris spread index of injured dendrites. n = number of neurons and N = number of animals: orionΔC/Y control (n = 19, N = 9); orion1/Y + Dcg>OrionB-GFP (same dataset as in Fig. 2M); orionΔC/Y + Dcg>OrionBAX3C-GFP (n = 12, N = 7); orionΔC/Y + Dcg>OrionBAAY-GFP (n = 23, N = 12). Kruskal–Wallis (one-way ANOVA on ranks) and Dunn’s test, P-values adjusted with the Benjamini–Hochberg method. For all image panels, neurons were labeled by ppk-CD4-tdTom. (Scale bars, 25 μm.) For all quantifications, *P ≤ 0.05, **P ≤ 0.01, ***P ≤ 0.001; n.s., not significant. The significance level above each genotype is for comparison with the control. Black bar, mean; red bars, SD.

References

    1. Galloway D. A., Phillips A. E. M., Owen D. R. J., Moore C. S., Phagocytosis in the brain: Homeostasis and disease. Front. Immunol. 10, 790 (2019). - PMC - PubMed
    1. Frost J. L., Schafer D. P., Microglia: Architects of the developing nervous system. Trends Cell Biol. 26, 587–597 (2016). - PMC - PubMed
    1. Salter M. W., Stevens B., Microglia emerge as central players in brain disease. Nat. Med. 23, 1018–1027 (2017). - PubMed
    1. Leventis P. A., Grinstein S., The distribution and function of phosphatidylserine in cellular membranes. Annu. Rev. Biophys. 39, 407–427 (2010). - PubMed
    1. Shacham-Silverberg V., et al. , Phosphatidylserine is a marker for axonal debris engulfment but its exposure can be decoupled from degeneration. Cell Death Dis. 9, 1116 (2018). - PMC - PubMed

Publication types

LinkOut - more resources