. 2023 Jun 13;120(24):e2219404120.
doi: 10.1073/pnas.2219404120. Epub 2023 Jun 5.

NgR1 binding to reovirus reveals an unusual bivalent interaction and a new viral attachment protein

Affiliations

NgR1 binding to reovirus reveals an unusual bivalent interaction and a new viral attachment protein

Danica M Sutherland et al. Proc Natl Acad Sci U S A. .

Abstract

Nogo-66 receptor 1 (NgR1) binds a variety of structurally dissimilar ligands in the adult central nervous system to inhibit axon extension. Disruption of ligand binding to NgR1 and subsequent signaling can improve neuron outgrowth, making NgR1 an important therapeutic target for diverse neurological conditions such as spinal crush injuries and Alzheimer's disease. Human NgR1 serves as a receptor for mammalian orthoreovirus (reovirus), but the mechanism of virus-receptor engagement is unknown. To elucidate how NgR1 mediates cell binding and entry of reovirus, we defined the affinity of interaction between virus and receptor, determined the structure of the virus-receptor complex, and identified residues in the receptor required for virus binding and infection. These studies revealed that central NgR1 surfaces form a bridge between two copies of viral capsid protein σ3, establishing that σ3 serves as a receptor ligand for reovirus. This unusual binding interface produces high-avidity interactions between virus and receptor to prime early entry steps. These studies refine models of reovirus cell-attachment and highlight the evolution of viruses to engage multiple receptors using distinct capsid components.

Keywords: Nogo receptor 1; attachment; receptor; structure; virus.


Conflict of interest statement

The authors declare no competing interest.

Figures

Fig. 1.
Fig. 1.
Reovirus virions bind to NgR1 on model surfaces with high affinity. (A) Schematic of reovirus virions and ISVPs showing loss of outer-capsid protein σ3, cleavage of µ1 to δ and φ fragments, and extension of the σ1 protein in ISVPs. (B) Schematic of probing reovirus particle binding to NgR1 using AFM. Pixel-for-pixel, force-distance, curve-based AFM is used to approach and retract the sample from a tip attached to a cantilever and record interaction forces, F, over the tip-sample distance in force-distance curves. Made using BioRender. (C) Force-time curve from which the loading rate can be extracted from the slope of the curve immediately before bond rupture (loading rate = ΔFt) (upper curve). The contact time is the interval in which the tip and surface are in constant contact (middle curve). The lower curve shows no binding events. Made using BioRender. (D) Box plot summarizing the binding probability from AFM studies for the conditions shown. Each data point represents the binding probability from one map acquired at a retraction speed of 1 µm/s. Mean (Inset square), median (horizontal line), 25th and 75th percentiles, and highest and lowest values (whiskers) are shown. N = 10 maps examined for three independent experiments. P values were determined by the two-sample t test. (E) Bell–Evans model describing a virus–receptor interaction as a two-state model (BioRender). The bound state is separated from the unbound state by a single energy barrier located at distance xu. koff and kon represent the dissociation and association rates, respectively. (F and G) DFS plot showing the distribution of average rupture forces, determined at seven distinct loading-rate (LR) ranges, quantified between NgR1 and either T1L (F) or T3D (G) virions. Data corresponding to single interactions were fit with the Bell–Evans model (solid black or blue line, respectively), providing average koff and xu values. Dashed lines represent predicted binding forces for multiple simultaneous uncorrelated interactions ruptured in parallel (Williams–Evans prediction). Inserted graphs: Binding probability is plotted as a function of the contact time. Least-squares fits of the data to a monoexponential decay curve (line) provides average kinetic on-rates (kon) of the probed interaction. Further calculation (koff/kon) determines the KD. Each data point represents the binding force from one map acquired at a retraction speed of 1 µm/s for the different hold times. All experiments were conducted at least three times with independent tips and samples. Error bars indicate SD of mean values.
Fig. 2.
Fig. 2.
Reovirus virion binding to NgR1 on living cells mirrors binding to NgR1 on model surfaces. (A) Schematic (BioRender) depicting reovirus virions probed on a confluent layer of cocultured fluorescent Lec2 (actin-mCherry and H2B-eGFP) and Lec2-NgR1 cells by combined optical microscopy and force-distance-based AFM. (B and C) Corresponding representative images of force-distance-based AFM topography (Top), confocal microscopy (Top, Inset), and adhesion map (Bottom) from probing adjacent Lec2 and Lec2-NgR1 cells with either T1L (B) or T3D (C) virions coupled to the AFM tip. Adhesion maps show interactions (white pixels) primarily with Lec2-NgR1 cells. (D) Box plot of the binding probability between either T1L (white) or T3D (blue) virions and Lec2 or Lec2-NgR1 cells, before and after injection of NgR1-specific antibody (Ab). Box-and-whisker plot is displayed as described above. For experiments without injection of NgR1-specific antibody, the data were obtained from at least N = 10 cells from four independent experiments. Data for blocking experiments were obtained from at least N = 4 cells from two independent experiments. P-values were determined by the two-sample t test. (E and F) DFS plots showing the distribution of rupture forces quantified between either T1L (E) or T3D (F) virions and NgR1-expressing Lec2 cells (red data points). Data points in gray represent rupture forces quantified using NgR1 model surfaces (extracted from Fig. 1 F and G, respectively). Histograms of the force distribution observed on cells fitted with a multi-peak Gaussian distribution (N > 800 data points) are shown at the sides. Error bars indicate SD of the mean values.
Fig. 3.
Fig. 3.
NgR1 is a specific receptor for reovirus. (A) Ribbon tracings of partial NgR1 (purple) (46) and NgR2 (gray) (54) ectodomains alongside a schematic of NgR1 [leucine-rich (LR) repeat (LRR) 1-8; GPI]. N and C termini are indicated. Schematic not to scale. (B–D) CHO cells were mock-transfected or transfected with the cDNAs shown and incubated for 48 h. (B) NgR1 and NgR2 expression was detected on the cell surface by flow cytometry using pooled NgR1 and NgR2 antibodies. (C) Transfected cells were incubated on ice with reovirus strain T3SA− for 1 h. Reovirus binding was detected by flow cytometry using reovirus-specific antiserum. (D) Transfected cells were incubated with T3SA− at room temperature for 1 h. At 24 hpi, infectivity was quantified by FFU assay. Error bars indicate SD. Values that differ significantly from mock by one-way ANOVA and Dunnett’s test are indicated (****P < 0.0001).
Fig. 4.
Fig. 4.
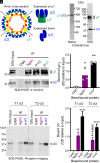
Reovirus outer-capsid protein σ3 is the viral ligand for NgR1. (A) Schematic of reovirus capsid components. (B) Purified σ33μ13 analyzed using native polyacrylamide gel electrophoresis (PAGE) (Left) or sodium dodecyl sulfate (SDS)-PAGE (Right) and stained with colloidal blue. (C and D) Soluble Fc-tagged CAR or NgR1 or monoclonal antibodies 10C1 (σ3-specific) or 8H6 (μ1-specific) were immobilized onto protein G beads. Protein-conjugated beads were incubated with purified σ33μ13. Beads were washed and boiled, and released proteins were electrophoresed by SDS-PAGE and visualized using reovirus-specific antiserum. A representative gel (C) and quantification of three independent experiments (D) are shown. Values that differ significantly from CAR by one-way ANOVA and Dunnett's test are indicated (*P < 0.05; **P < 0.01). (E and F) Soluble Fc-tagged CAR or NgR1 or 10C1 (σ3-specific) monoclonal antibody were incubated with rabbit reticulocyte lysates expressing radiolabeled T1L or T3D σ3 and bound to beads. Beads were washed and boiled, and released proteins were subjected to SDS-PAGE. Immunoprecipitated proteins were visualized by phosphor imaging. A representative gel (E) and quantification of five independent experiments (F) are shown. SEM is shown. Values that differ significantly from CAR by two-way ANOVA and Tukey's test are indicated (**P < 0.01; ****P < 0.0001).
Fig. 5.
Fig. 5.
Cryo-EM reconstruction of NgR1 bound to reovirus virions reveals a bivalent interaction mode. (A and B) Representative cryo-electron micrographs of reovirus virions alone (A) or complexed with NgR1 (B). Scale bar, 100 nm. (C and D) Central slices of the 3D cryo-EM reconstruction of reovirus virions alone (C) or complexed with NgR1 (D). White arrowheads indicate NgR1 density. (E and F) Overview of 3D reconstructions of reovirus virions alone (E) or complexed with NgR1 (F) at resolutions of 7.2 Å and 8.9 Å, respectively. Maps are colored by distance from the virus center (320 Å to 440 Å). Representative twofold, threefold, and fivefold symmetry axes of the icosahedral capsid are indicated by white symbols. (G–I) Asymmetric units for reovirus (G, side view; H, top view) or reovirus-NgR1 (I, top view). Ribbon tracings of reovirus proteins (σ3-blue, μ1-green, λ2-yellow, λ1-red, and σ2-red) and NgR1 (magenta) were placed into the 3D reconstructions (gray translucent surface representation) of virions (G and H) or the virion-NgR1 complex (I). (H) Individual σ33μ13 heterohexamers are indicated with black triangles. (I) N and C termini for docked NgR1 molecules are labeled in white. (J and K) Difference density maps of the reovirus virion reconstruction subtracted from the reovirus-NgR1 reconstruction at sigma level 1.5 (J) or 2.0 (K). Major additional NgR1 features are indicated by black rectangles. (L and M) Side and top views of NgR1 ribbon tracing placed into the difference density map (sigma level = 1.15). Glycosylations are shown in stick format, and densities attributable to glycosylation are indicated by black arrowheads. N′ and C′ termini are indicated.
Fig. 6.
Fig. 6.
NgR1 residues required for interaction with reovirus validated by structure-guided mutagenesis. (A) Surface representation of the modeled asymmetric unit of a reovirus virion in complex with NgR1 (extracted from Fig. 5 molecular docking). NgR1 is colored in magenta, σ3 in blue, μ1 in green, λ1 in yellow, and σ2 and λ1 in red. The approximate location at which σ1 imbeds into λ2 is depicted by a gray circle. (B) Interactions of NgR1 with two σ3 monomers (labeled σ3A and σ3B) from different heterohexamers are depicted in a side view (Top) and top view (Bottom). NgR1 is shown as a ribbon tracing (magenta) and σ3 as a surface representation (blue). The σ3 surface < 5 Å from the NgR1 protein model is colored in magenta. (C and D) Enlarged views of the σ3A (C) and σ3B (D) interaction sites. NgR1 amino acids in proximity to σ3 are shown in stick representation. NgR1 surfaces less than 5 Å from σ3 are colored in light blue. Residue color and label color reflect mutant phenotype: purple = reduced infectivity and gray/black = normal or increased infectivity. Residue L208 is highlighted in yellow. (E–G) CHO cells were mock-transfected or transfected with the cDNAs shown. NgR1 mutants are labeled by the residue changed and grouped by close proximity (less than 5 Å from σ3; light purple) or peripheral (6.5 to 7 Å from σ3; light blue). (E) NgR1 expression, (F) reovirus binding, and (G) reovirus infectivity were determined. Shown are mean values of five or more independent experiments. Error bars indicate SEM. Values that differ significantly from NgR1 by one-way ANOVA and Dunnett's test are indicated (*P < 0.05; **P < 0.01; ***P < 0.001; ****P < 0.001).

Similar articles

Cited by

References

    1. Roth A. N., et al. , Ins and outs of reovirus: Vesicular trafficking in viral entry and egress. Trends Microbiol. 29, 363–375 (2021). - PMC - PubMed
    1. Margolis G., Kilham L., Hydrocephalus in hamsters, ferrets, rats, and mice following inoculations with reovirus type I. II. Pathologic studies. Lab Invest. 21, 189–198 (1969). - PubMed
    1. Raine C. S., Fields B. N., Reovirus type 3 encephalitis-a virologic and ultrastructural study. J. Neuropathol. Exp. Neurol. 32, 19–33 (1973). - PubMed
    1. Wu A. G., et al. , Age-dependent susceptibility to reovirus encephalitis in mice is influenced by maturation of the type-I interferon response. Pediatr. Res. 83, 1057–1066 (2018). - PMC - PubMed
    1. Lerner A. M., Cherry J. D., Klein J. O., Finland M., Infections with reoviruses. N. Engl. J. Med. 267, 947–952 (1962). - PubMed

Publication types

LinkOut - more resources