. 2023 Jun 13;120(24):e2303760120.
doi: 10.1073/pnas.2303760120. Epub 2023 Jun 5.

CARD9 attenuates Aβ pathology and modifies microglial responses in an Alzheimer's disease mouse model

Affiliations

CARD9 attenuates Aβ pathology and modifies microglial responses in an Alzheimer's disease mouse model

Hannah Ennerfelt et al. Proc Natl Acad Sci U S A. .

Abstract

Recent advances have highlighted the importance of several innate immune receptors expressed by microglia in Alzheimer's disease (AD). In particular, mounting evidence from AD patients and experimental models indicates pivotal roles for TREM2, CD33, and CD22 in neurodegenerative disease progression. While there is growing interest in targeting these microglial receptors to treat AD, we still lack knowledge of the downstream signaling molecules used by these receptors to orchestrate immune responses in AD. Notably, TREM2, CD33, and CD22 have been described to influence signaling associated with the intracellular adaptor molecule CARD9 to mount downstream immune responses outside of the brain. However, the role of CARD9 in AD remains poorly understood. Here, we show that genetic ablation of CARD9 in the 5xFAD mouse model of AD results in exacerbated amyloid beta (Aβ) deposition, increased neuronal loss, worsened cognitive deficits, and alterations in microglial responses. We further show that pharmacological activation of CARD9 promotes improved clearance of Aβ deposits from the brains of 5xFAD mice. These results help to establish CARD9 as a key intracellular innate immune signaling molecule that regulates Aβ-mediated disease and microglial responses. Moreover, these findings suggest that targeting CARD9 might offer a strategy to improve Aβ clearance in AD.

Keywords: Alzheimer’s disease; CARD9; amyloid beta; microglia; neuroimmunology.


Conflict of interest statement

The authors declare no competing interest.

Figures

Fig. 1.
Fig. 1.
CARD9 deletion leads to increased Aβ accumulation in 5xFAD mice. (AF) Brains were harvested from 5-mo-old 5xFAD, Card9+/−5xFAD, and Card9−/−5xFAD mice to evaluate Aβ load. (A) Representative images of Aβ (D54D2, pink; DAPI, blue) staining from sagittal sections in the cortex, hippocampus, and thalamus. Original magnification: 10x; (scale bar, 2,000 µm and 1,000 µm.) (B) Quantification of percent area covered by Aβ in the cortex, hippocampus, and thalamus. Combined data from three independent experiments. (C and D) Aβ levels detected by Aβ-42 enzyme-linked immunosorbent assay (ELISA). (C) Soluble (PBS buffer extraction) and (D) insoluble (guanidine extraction) fractions from 5-mo-old 5xFAD, Card9+/−5xFAD, and Card9−/−5xFAD half-brain hemispheres. (E and F) Representative images and quantification of Aβ plaques measuring ThioS+ (pink) plaque numbers in the cortex field of view (FOV), with combined data from a total of 50 to 100 plaques from 3 matching brain sections per mouse. Original magnification: 63x; (scale bar, 40 µm.) Statistical significance between experimental groups was calculated by one-way ANOVA with Tukey’s post hoc test (BD and F). *P < 0.05, **P < 0.01, and ***P < 0.001. Error bars represent mean ± SEM, and each data point represents an individual mouse (BD and F).
Fig. 2.
Fig. 2.
Card9 deficiency leads to worsened neuronal health and cognitive impairment in 5xFAD mice. (A and B) Brains were harvested from 5-mo-old 5xFAD, Card9+/−5xFAD, and Card9−/−5xFAD mice to assess neuronal death. The CA1 region of the hippocampus was evaluated for neuronal cell death by TUNEL assay (pink), NeuN staining (green), and DAPI (blue). Original magnification: 63x; (scale bars, 40 µm.) (CH) The Morris water maze (MWM) test was used to assess spatial learning and memory in 4-mo-old 5xFAD, Card9+/− 5xFAD, and Card9−/− 5xFAD mice. (CG) Acquisition stage of learning in the MWM. (C) Latency to platform (acquisition). (D) Representative heatmaps of mouse trajectory on day 4 of acquisition with a green box outlining the location of the platform and (E) plotted percentage of allocentric navigation strategy during MWM acquisition. (F) Distance traveled averaged from all four trials in maze (cm) and (G) average speed of travel (cm/s) on day 4 of acquisition. (H) Percentage of time spent in the target quadrant (probe). Statistical significance between experimental groups was calculated by repeated-measures two-way ANOVA with Bonferroni’s post hoc test (C and E) or one-way ANOVA with Tukey’s post hoc test (B and FH) from three independent experiments. *P < 0.05, **P < 0.01, and ***P < 0.001. Error bars represent mean ± SEM (B, C, EH) and each data point represents an individual mouse (B and FH), or the average of experimental mice per group (C and E).
Fig. 3.
Fig. 3.
The loss of Card9 leads to altered microgliosis in 5xFAD mice. (AI) Brains were harvested from 5-mo-old 5xFAD, Card9+/−5xFAD, and Card9−/−5xFAD mice to assess microglial activity and Aβ plaque volume. (A and B) Representative images and quantification of microglia numbers (IBA1, cyan) surrounding ThioS+ plaques (pink) in the field of view (FOV) of the frontal cortex of 5xFAD, Card9+/−5xFAD, and Card9−/−5xFAD mice. Original magnification: 63x; (scale bar, 40 µm.) (C and D) Representative images of microglial proliferation measured by evaluating Ki67 (yellow) colocalization with IBA1+ (cyan) microglia in the cortex of matched sagittal sections. Original magnification: 63x; (scale bar, 40 µm.) (EG) Representative images and quantification of ThioS-labeled (pink) plaque sphericity and volume in the cortex. Original magnification: 63x; (scale bar, 20 µm.) (F) Quantification of plaque sphericity with 1.00 being the most spherical. (G) Quantification of plaque volume in the cortex. (H and I) Microglial morphology calculated by Sholl analysis from a total of 12 microglia from 3 matching brain sections per mouse (n = 5 mice per group). (H) Representative microglia renderings and (I) Sholl analysis. Original magnification: 63x; (scale bar, 10 µm.) Statistical significance between experimental groups was calculated by one-way ANOVA with Tukey’s post hoc test (BD, F, and G) or repeated-measures two-way ANOVA with Bonferroni’s post hoc test (I). *P < 0.05, **P < 0.01, ***P < 0.001, ****P < 0.0001. Error bars represent mean ± SEM (BD, F, G, and I). Each data point represents an individual mouse (BD, F, and G) or the average of 5 mice (I). Data were collected from 6 fields of view (FOV) from a total of 3 matched sagittal sections (B and D) or 50 to 100 plaques from the cortex of each mouse (F and G).
Fig. 4.
Fig. 4.
Card9-dependent microglial regulation in 5xFAD mice. (AC) RNA-Seq was performed on microglia from 5-mo-old Card9+/+ (denoted as WT), Card9−/−, 5xFAD, and Card9−/−5xFAD mice sorted from single-cell brain suspensions using anti-CD11b+-coated magnetic beads and magnetic column sorting. (A) Principal component (PC) analysis of sample clustering. (B) Volcano plot comparing differentially expressed genes (FDR < 0.1) between Card9−/−5xFAD and 5xFAD microglia, where 4 genes are significantly down-regulated and 4 genes are significantly up-regulated. (C) Heatmap representation of the top 10 overall up-regulated and down-regulated genes between microglia isolated from Card9−/−5xFAD and 5xFAD mice. (D) qPCR validation of Klf4 expression in microglia sorted from Card9−/−5xFAD and 5xFAD mice. (E and F) Brains were harvested from 5-mo-old 5xFAD, Card9+/−5xFAD, and Card9−/−5xFAD mice to assess microglial ferritin heavy chain (FHC) levels in the cortex. (E) Representative images and (F) quantification of FHC (yellow) within microglia (IBA1, cyan) surrounding ThioS+ plaques (pink) in the field of view (FOV) of the frontal cortex of 5xFAD, Card9+/−5xFAD, and Card9−/−5xFAD mice. Original magnification: 63x; (scale bar, 30 µm and 10 µm.) (GK) 5xFAD and Card9−/−5xFAD mice were fed normal chow (denoted as control) or PLX5622 chow beginning at 1.5 mo of age and harvested at 4 mo of age. (G) Representative images and (H) quantification of microglia numbers (IBA1, cyan) surrounding ThioS+ plaques (pink) in the FOV of the frontal cortex of normal chow- and PLX5622 chow-fed 5xFAD and Card9−/−5xFAD mice. (G) Representative images and (I) quantification of ThioS+ Aβ plaque (pink) numbers in the cortex FOV, with combined data from a total of 30 to 75 plaques from 3 matching brain sections per mouse. Original magnification: 63×; (scale bar = 30 µm.) (JK) Representative images of Aβ (D54D2, pink; DAPI, blue) staining from sagittal sections in the cortex of normal chow- and PLX5622 chow-fed 5xFAD and Card9−/−5xFAD mice. Original magnification: 10×; (scale bar, 2,000 µm.) Statistical significance between experimental groups was calculated by unpaired two-tailed Student’s t test (D), one-way ANOVA with Tukey’s post hoc test (F), and two-way ANOVA with Tukey’s post hoc test (H, I, and K). *P < 0.05, **P < 0.01, ***P < 0.001, and ****P < 0.0001. Error bars represent mean ± SEM (D, F, H, I, and K). Each data point represents an individual mouse (D, F, H, I, and K).
Fig. 5.
Fig. 5.
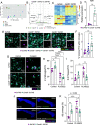
Pustulan treatment enhances Aβ clearance in a CARD9-dependent manner in the hippocampus of 5xFAD mice. (AI) Right and Left hippocampal injection of vehicle or pustulan, respectively, into 2-mo-old 5xFAD and Card9−/− 5xFAD mice. Brains were then harvested 7 days post injection (dpi). (A) Experimental design schematic. (B) Representative images of Aβ (D54D2, pink) coverage in 2-mo-old 5xFAD and Card9−/− 5xFAD mice 7 d following intrahippocampal injection of vehicle or 2 μg pustulan. (CH) Quantification of Aβ in the hippocampus of (CE) 5xFAD and (FH) Card9−/− 5xFAD mice. Statistical significance between experimental groups was calculated by paired Student’s t test (CH). ns = nonsignificant, *P < 0.05. Representative data from 2 independent experiments (CH). Error bars represent mean ± SEM, and each data point represents an individual mouse (CH).

References

    1. DeTure M. A., Dickson D. W., The neuropathological diagnosis of Alzheimer’s disease. Mol. Neurodegener. 14, 32 (2019). - PMC - PubMed
    1. Heneka M. T., et al. , Neuroinflammation in Alzheimer’s disease. Lancet Neurol. 14, 388–405 (2015). - PMC - PubMed
    1. Jahn H., Memory loss in Alzheimer’s disease. Dialogues Clin. Neurosci. 15, 445–454 (2013). - PMC - PubMed
    1. Mhatre S. D., Tsai C. A., Rubin A. J., James M. L., Andreasson K. I., Microglial malfunction: The third rail in the development of Alzheimer’s disease. Trends Neurosci. 38, 621–636 (2015). - PMC - PubMed
    1. Spangenberg E. E., et al. , Eliminating microglia in Alzheimer’s mice prevents neuronal loss without modulating amyloid-beta pathology. Brain 139, 1265–1281 (2016). - PMC - PubMed

Publication types

MeSH terms