Randomized Controlled Trial
. 2023 Aug;153(8):2181-2192.
doi: 10.1016/j.tjnut.2023.06.003. Epub 2023 Jun 3.

Metabolomic Profiling of an Ultraprocessed Dietary Pattern in a Domiciled Randomized Controlled Crossover Feeding Trial

Affiliations
Randomized Controlled Trial

Metabolomic Profiling of an Ultraprocessed Dietary Pattern in a Domiciled Randomized Controlled Crossover Feeding Trial

Lauren E O'Connor et al. J Nutr. 2023 Aug.

Abstract

Background: Objective markers of ultraprocessed foods (UPF) may improve the assessment of UPF intake and provide insight into how UPF influences health.

Objectives: To identify metabolites that differed between dietary patterns (DPs) high in or void of UPF according to Nova classification.

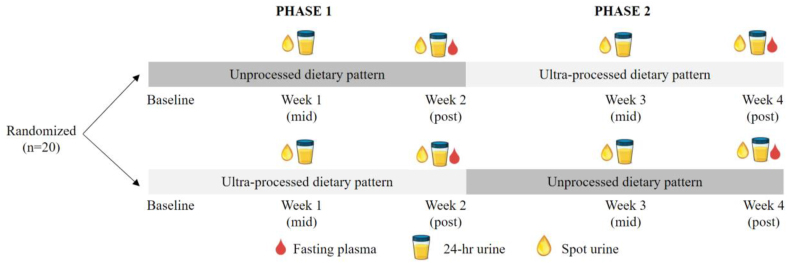
Methods: In a randomized, crossover, controlled-feeding trial (clinicaltrials.govNCT03407053), 20 domiciled healthy participants (mean ± standard deviation: age 31 ± 7 y, body mass index [kg/m2] 22 ± 11.6) consumed ad libitum a UPF-DP (80% UPF) and an unprocessed DP (UN-DP; 0% UPF) for 2 wk each. Metabolites were measured using liquid chromatography with tandem mass spectrometry in ethylenediaminetetraacetic acid plasma, collected at week 2 and 24-h, and spot urine, collected at weeks 1 and 2, of each DP. Linear mixed models, adjusted for energy intake, were used to identify metabolites that differed between DPs.

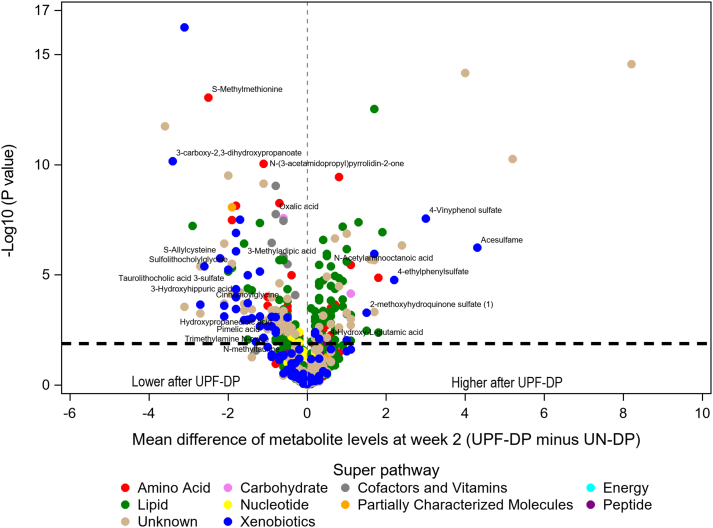
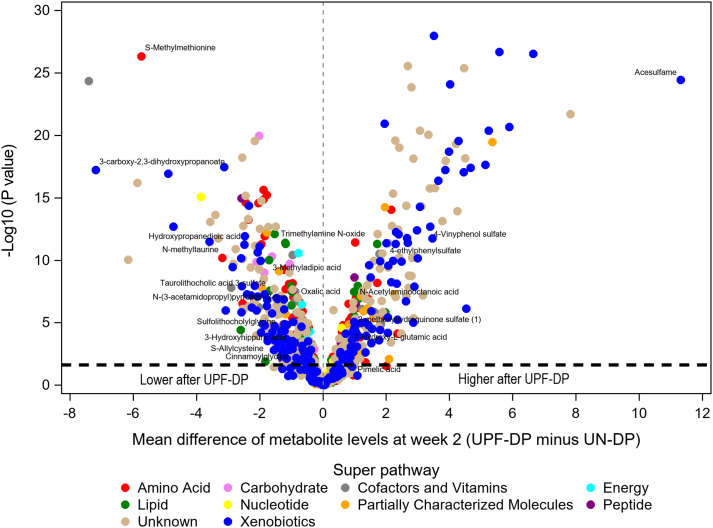
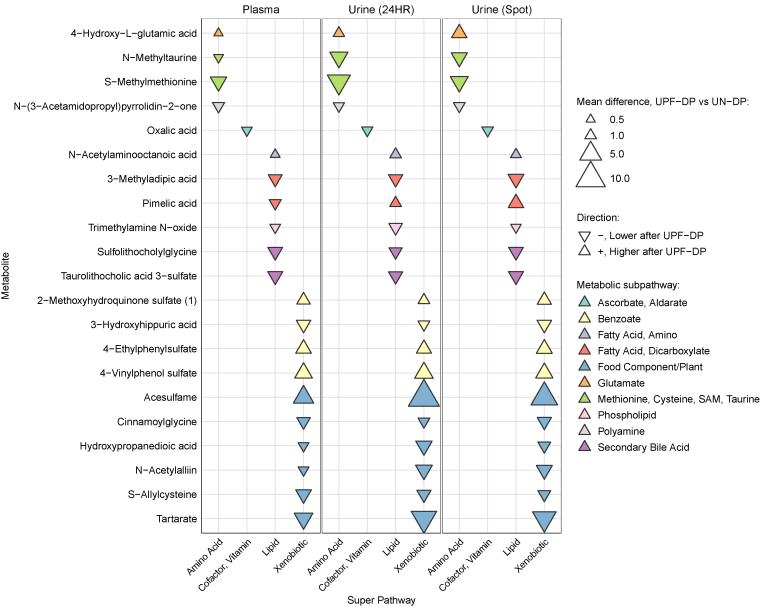
Results: After multiple comparisons correction, 257 out of 993 plasma and 606 out of 1279 24-h urine metabolites differed between UPF-DP and UN-DP. Overall, 21 known and 9 unknown metabolites differed between DPs across all time points and biospecimen types. Six metabolites were higher (4-hydroxy-L-glutamic acid, N-acetylaminooctanoic acid, 2-methoxyhydroquinone sulfate, 4-ethylphenylsulfate, 4-vinylphenol sulfate, and acesulfame) and 14 were lower following the UPF-DP; pimelic acid, was lower in plasma but higher in urine following the UPF-DP.

Conclusions: Consuming a DP high in, compared with 1 void of, UPF has a measurable impact on the short-term human metabolome. Observed differential metabolites could serve as candidate biomarkers of UPF intake or metabolic response in larger samples with varying UPF-DPs. This trial was registered at clinicaltrials.gov as NCT03407053 and NCT03878108.

Keywords: United States adults; dietary assessment; dietary biomarkers; dietary patterns; food processing; metabolomics; plasma metabolites; processed foods; urine metabolites.


Figures

FIGURE 1
FIGURE 1
A randomized, controlled, crossover, domiciled feeding study comparing metabolomic responses following consumption of an ultraprocessed dietary pattern and an unprocessed dietary pattern. Metabolites were measured in EDTA plasma, 24-h urine, and spot urine at the time points indicated above for (n = 20) participants. Within-individual differences in relative levels of metabolites were compared between dietary intervention phases (ultraprocessed dietary pattern compared with unprocessed dietary pattern) at week 2 for plasma and at week 1 and week 2 for 24-h and spot urine. Relative levels of metabolites were also compared over time (changes from week 1 to week 2 within an individual) for 24-h and spot urine during the ultraprocessed dietary pattern and during the unprocessed dietary pattern. EDTA, ethylenediaminetetraacetic acid.
FIGURE 2
FIGURE 2
Volcano plot of mean difference at week 2 in plasma metabolites after consumption of a UPF-DP compared with UN-DP. Mean differences in metabolites (n = 993) were estimated for 20 participants via a linear mixed model adjusted for diet, phase, sequence and calculated EI during the week prior to sample collection with subject-specific random intercepts. The metabolites labeled in the figure consistently differed between the UPF-DP and UN-DP across all sample types and time points, as shown in Table 3. The metabolites above the horizontal black dashed line were statistically significantly different at week 2 after the Benjamini-Hochberg correction for multiple comparisons (n = 257). Super pathway (ie, general biochemical class) was assigned by Metabolon, Inc. for sorting compounds by broad biochemical classes. EI, energy intake; UN-DP, unprocessed dietary pattern; UPF-DP, ultraprocessed dietary pattern.
FIGURE 3
FIGURE 3
Volcano plot of mean difference at week 2 in urine metabolites after consumption of a UPF-DP compared with UN-DP. Mean differences in metabolites (n = 1279) were estimated for 20 participants via a linear mixed model adjusted for diet, phase, sequence, and time point and calculated EI during the week prior to sample collection with subject-specific random intercepts. The metabolites labeled in the figure consistently differed between the UPF-DP and UN-DP across all sample types and time points, as shown in Table 3. The metabolites above the horizontal black dashed line were statistically significantly different at week 2 after the Benjamini-Hochberg correction for multiple comparisons (n = 606). Super pathway (ie, general biochemical class) was assigned by Metabolon, Inc. for sorting compounds by broad biochemical classes. EI, energy intake; UN-DP, unprocessed dietary pattern; UPF-DP, ultraprocessed dietary pattern.
FIGURE 4
FIGURE 4
Magnitude and direction of mean differences at week 2 in metabolites after consumption of a UPF-DP compared with UN-DP. Metabolites listed (n = 21) here differed within-individual (n = 20 participants) between UPF-DP and UN-DP at week 2 for plasma as well as week 1 and week 2 for 24-h urine. Mean differences in metabolites were estimated via a linear mixed model adjusted for diet, phase, sequence, and time point for urine only and calculated EI during the week prior to sample collection with subject-specific random intercepts. P values were Benjamini-Hochberg corrected for multiple comparisons. Super pathway (ie, general biochemical class) and subpathway were assigned by Metabolon, Inc. EI, energy intake; UN-DP, unprocessed dietary pattern; UPF-DP, ultraprocessed dietary pattern.

References

    1. Weaver C.M., Dwyer J., Fulgoni V.L., 3rd, King J.C., Leveille G.A., MacDonald R.S., et al. Processed foods: contributions to nutrition. Am. J. Clin. Nutr. 2014;99(6):1525–1542. - PMC - PubMed
    1. Monteiro C.A., Canno G., Moubarac J.C., Levy R.B., Louzada M.L.C., Jaime P.C. The UN Decade of Nutrition, the NOVA food classification and the trouble with ultra-processing. Public Health Nutr. 2018;21(1):5–17. - PMC - PubMed
    1. World Health Organization . 2021. Report of the technical consultation on measuring healthy diet: concepts, methods, and metrics. May 18–20.
    1. Monteiro C.A., Cannon G., Levy R.B., Moubarac J.C., Louzada M.L., Rauber F., et al. Ultra-processed foods: what they are and how to identify them. Public Health Nutr. 2019;22(5):936–941. - PMC - PubMed
    1. Srour B., Kordahi M.C., Bonazzi E., Deschasaux-Tanguy M., Touvier M., Chassaing B. Ultra-processed foods and human health: from epidemiological evidence to mechanistic insights. Lancet Gastroenterol. Hepatol. 2022;7(12):1128–1140. - PubMed

Publication types

Associated data