. 2023 Jun 6;14(1):3272.
doi: 10.1038/s41467-023-39098-w.

Estimating the impact of COVID-19 vaccine inequities: a modeling study

Affiliations

Estimating the impact of COVID-19 vaccine inequities: a modeling study

Nicolò Gozzi et al. Nat Commun. .

Abstract

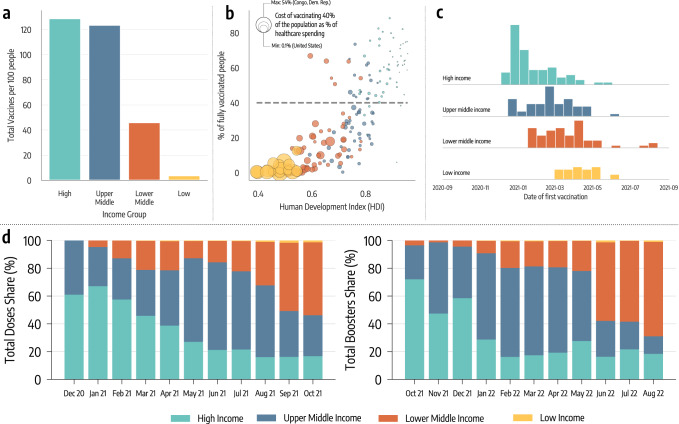
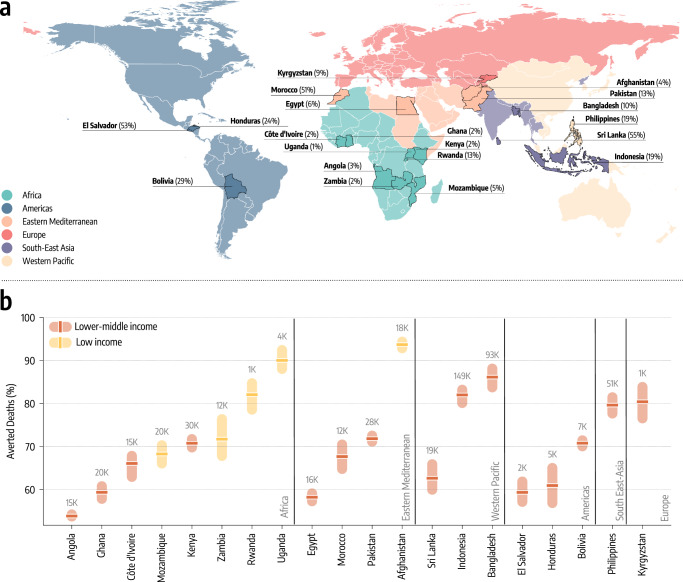
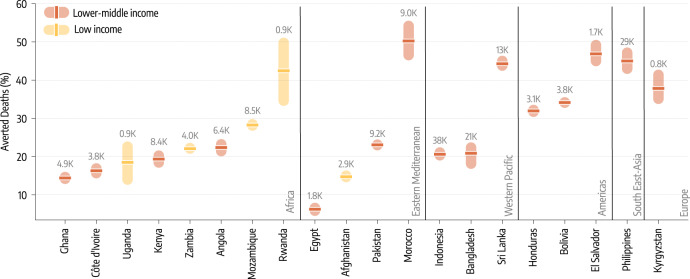
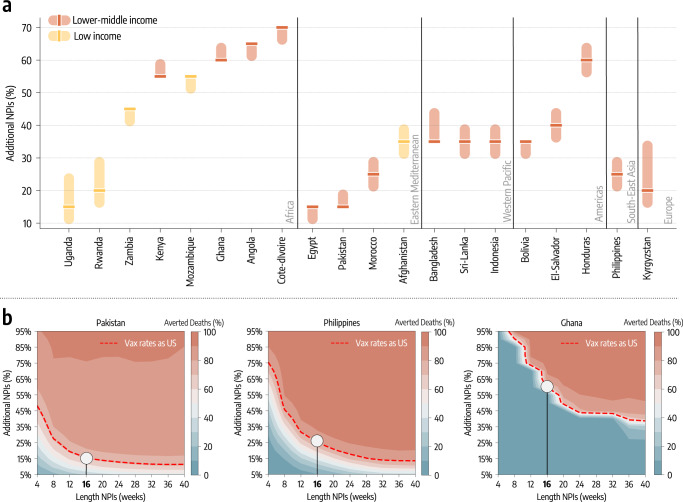
Access to COVID-19 vaccines on the global scale has been drastically hindered by structural socio-economic disparities. Here, we develop a data-driven, age-stratified epidemic model to evaluate the effects of COVID-19 vaccine inequities in twenty lower middle and low income countries (LMIC) selected from all WHO regions. We investigate and quantify the potential effects of higher or earlier doses availability. In doing so, we focus on the crucial initial months of vaccine distribution and administration, exploring counterfactual scenarios where we assume the same per capita daily vaccination rate reported in selected high income countries. We estimate that more than 50% of deaths (min-max range: [54-94%]) that occurred in the analyzed countries could have been averted. We further consider scenarios where LMIC had similarly early access to vaccine doses as high income countries. Even without increasing the number of doses, we estimate an important fraction of deaths (min-max range: [6-50%]) could have been averted. In the absence of the availability of high-income countries, the model suggests that additional non-pharmaceutical interventions inducing a considerable relative decrease of transmissibility (min-max range: [15-70%]) would have been required to offset the lack of vaccines. Overall, our results quantify the negative impacts of vaccine inequities and underscore the need for intensified global efforts devoted to provide faster access to vaccine programs in low and lower-middle-income countries.


Conflict of interest statement

The authors declare no competing interests.

Figures

Fig. 1
Fig. 1. Vaccine inequities.
a Total number of doses administered per 100 people in different income groups as of October 1, 2021. b Scatter plot of % of a country’s population who is fully vaccinated versus their Human Development Index (HDI). The color of dots indicates the country’s income group while size is proportional to the cost of vaccinating 40% of the population as a percentage of current healthcare spending. c Histograms of the date of first COVID-19 vaccination across different country income groups. d Evolution in the share of doses administered monthly across country income groups (left hand), and evolution of monthly booster doses share (right hand side).
Fig. 2
Fig. 2. Counterfactual scenarios - Deaths averted if countries had US-equivalent vaccination rate.
a Countries modeled, their WHO region, and the percentage of fully vaccinated individuals there as of October 1, 2021. World borders layer is taken from Ref. . b Deaths averted expressed as a percentage with respect to the actual vaccination rollout (median and interquartile range computed over 1000 independent model realizations), assuming per capita vaccination rates equivalent to the United States. Averted deaths are computed over the simulation period (2020/10/01−2021/10/01). The median absolute number of deaths averted is reported above the inter-quartile range.
Fig. 3
Fig. 3. Counterfactual scenarios - Deaths averted if countries had US-equivalent vaccination start date.
Deaths averted expressed as a percentage with respect to the actual vaccination rollout (median and interquartile range computed over 1000 independent model realizations), assuming United States start date of December 14, 2020. Averted deaths are computed over the simulation period (2020/10/01−2021/10/01). The median absolute number of deaths averted is reported above the inter-quartile range.
Fig. 4
Fig. 4. The role of NPIs.
a Additional decrease of transmission obtained through stricter NPIs, put in place for four months, needed to match the deaths averted that the vaccination rate of the US would have allowed (median and interquartile range computed over 1000 independent model realizations). b For three countries we show the contour plots of the percentage of deaths averted (median %) with stricter and/or longer NPIs, relative to the actual vaccination baseline. Percentage of deaths averted achieved by a US-equivalent vaccination rate is plotted as reference (red dashed line). The white circle indicates the level corresponding to stricter NPIs sustained for additional 16 weeks.

Update of

References

    1. Gozzi N, et al. Estimating the effect of social inequalities on the mitigation of COVID-19 across communities in Santiago de Chile. Nat. Commun. 2021;12:2429. - PMC - PubMed
    1. Pullano G, Valdano E, Scarpa N, Rubrichi S, Colizza V. Evaluating the effect of demographic factors, socioeconomic factors, and risk aversion on mobility during the COVID-19 epidemic in France under lockdown: a population-based study. Lancet Digit. Health. 2020;2:e638–e649. - PMC - PubMed
    1. Bonaccorsi G, et al. Economic and social consequences of human mobility restrictions under COVID-19. Proc. Natl Acad. Sci. USA. 2020;117:15530–15535. - PMC - PubMed
    1. Weill JA, Stigler M, Deschenes O, Springborn MR. Social distancing responses to COVID-19 emergency declarations strongly differentiated by income. Proc. Natl Acad. Sci. USA. 2020;117:19658–19660. - PMC - PubMed
    1. Fraiberger, S. P. et al. Uncovering socioeconomic gaps in mobility reduction during the COVID-19 pandemic using location data. arXiv preprint arXiv:2006.15195, (2020).

Publication types