. 2023 Jun 5;14(1):3269.
doi: 10.1038/s41467-023-38940-5.

Monitoring transmission intensity of trachoma with serology

Affiliations

Monitoring transmission intensity of trachoma with serology

Christine Tedijanto et al. Nat Commun. .

Abstract

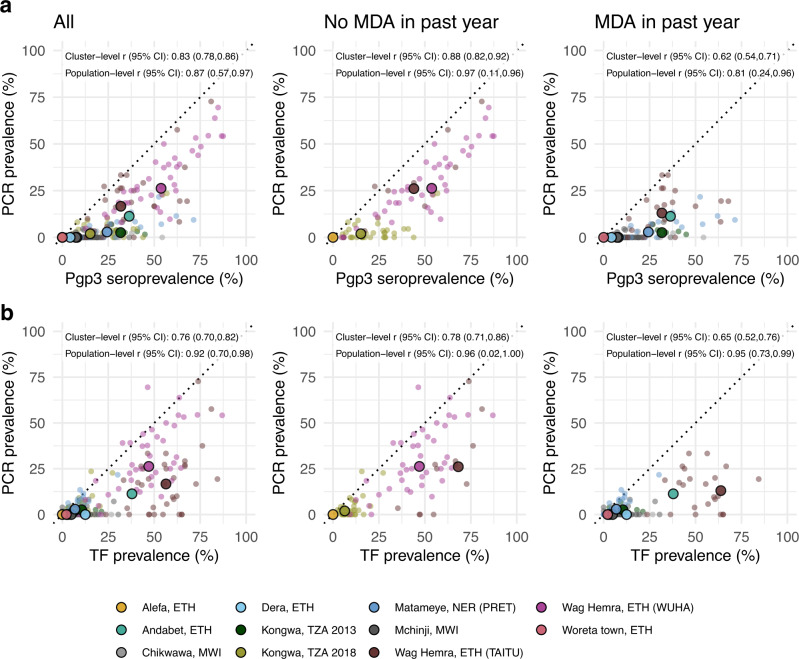
Trachoma, caused by ocular Chlamydia trachomatis infection, is targeted for global elimination as a public health problem by 2030. To provide evidence for use of antibodies to monitor C. trachomatis transmission, we collated IgG responses to Pgp3 antigen, PCR positivity, and clinical observations from 19,811 children aged 1-9 years in 14 populations. We demonstrate that age-seroprevalence curves consistently shift along a gradient of transmission intensity: rising steeply in populations with high levels of infection and active trachoma and becoming flat in populations near elimination. Seroprevalence (range: 0-54%) and seroconversion rates (range: 0-15 per 100 person-years) correlate with PCR prevalence (r: 0.87, 95% CI: 0.57, 0.97). A seroprevalence threshold of 13.5% (seroconversion rate 2.75 per 100 person-years) identifies clusters with any PCR-identified infection at high sensitivity ( >90%) and moderate specificity (69-75%). Antibody responses in young children provide a robust, generalizable approach to monitor population progress toward and beyond trachoma elimination.


Conflict of interest statement

The authors declare no competing interests.

Figures

Fig. 1
Fig. 1. Seroprevalence, PCR positivity, and TF prevalence across study populations.
Cluster-level prevalence estimates are represented by colored lines, and overlaid boxplots show the median, interquartile range, and range (excluding outliers defined as points more than 1.5 times the interquartile range from the 25th or 75th percentile) for each population. Study site, country, study name (if applicable), and year of data collection are listed on the left with number of individuals (n) and number of clusters (m) included in the analyses. For studies with only district-level estimates of PCR prevalence the mean is indicated with a circle rather than box plot. NA marks studies that did not measure PCR or trachomatous inflammation—follicular (TF). Study populations are arranged in descending order of seroconversion rates, presented in Fig. 2. Source data are provided with this paper. Created with notebook https://osf.io/qjst8.
Fig. 2
Fig. 2. Age-dependent seroprevalence curves, modeled seroconversion rates, and PCR prevalence across study populations.
Cubic splines fit to seroprevalence by age are shown in the left plot. Cluster-level seroconversion rates and PCR prevalence estimates are represented by colored lines, and overlaid boxplots show the median, interquartile range, and range (excluding outliers defined as points >1.5 times the interquartile range from the 25th or 75th percentile) for each population. Figure 1 includes each study’s sample size. Study populations are arranged in descending order of median seroconversion rate assuming no seroreversion. C. trachomatis PCR measurements are identical to Fig. 1 and are included for reference. For studies with only district-level estimates of PCR prevalence, the mean is indicated with a circle rather than box plot. NA indicates that a study did not measure C. trachomatis infections with PCR. PY person-years, ETH Ethiopia, MAR Morocco, MWI Malawi, NER Niger, TZA Tanzania. Source data are provided with this paper. Created with notebook https://osf.io/rghyc.
Fig. 3
Fig. 3. Relationship between different cluster-level serologic summary measures.
a Geometric mean IgG response versus seroprevalence. b Seroconversion rate versus seroprevalence. c Seroconversion rate allowing for seroreversion versus a seroconversion rate that assumes no seroreversion. d Seroconversion rate that assumes seroreversion versus seroprevalence. Spearman rank correlations across sampling clusters are shown for each comparison. In all panels, small points represent cluster-level estimates and medians for each study population are represented by larger points with black outline. Shaded bands show simultaneous 95% confidence intervals for a spline fit through cluster-level estimates. A fixed seroreversion rate of 6.6 per 100 person-years was assumed in the catalytic model allowing for seroreversion (Methods). Figure 1 includes each study’s sample size (median cluster size = 40 children). PY person-years, ETH Ethiopia, MAR Morocco, MWI Malawi, NER Niger, TZA Tanzania. Source data are provided with this paper. Created with notebook https://osf.io/wcv86.
Fig. 4
Fig. 4. Relationship between trachoma biomarkers in the presence and absence of recent mass distribution of azithromycin (MDA).
a Correlations between cluster PCR prevalence and seroprevalence overall and stratified by whether the study population had received MDA in the previous year. b Correlations between PCR prevalence and TF prevalence overall and stratified by whether the study population had received MDA in the previous year. In all panels, medians across clusters for each study population are represented by larger points with black outline. Each plot includes the identity line (dotted) and Pearson correlations at the cluster- and population levels. 95% confidence intervals (CIs) are based on 1000 bootstrapped samples, holding populations fixed and resampling clusters with replacement. Population-level estimates are included for Andabet, Dera, Woreta town, and Alefa, Ethiopia, but cluster-level PCR prevalence was not available for these populations. Figure 1 includes each study’s sample size. ETH Ethiopia, MWI Malawi, NER Niger, TZA Tanzania, TF trachomatous inflammation—follicular. Source data are provided with this paper. Created with notebook https://osf.io/rt825.
Fig. 5
Fig. 5. Relationship between trachoma biomarkers in different monitoring age ranges.
a Correlations between cluster PCR prevalence and seroprevalence overall and stratified by age of monitoring population. b Correlations between C. trachomatis PCR prevalence and TF prevalence overall and stratified by age of monitoring population. In all panels, medians across clusters for each study population are represented by larger points with black outline. Each plot includes the identity line (dotted) and Pearson correlations at the cluster- and population levels. 95% confidence intervals (CIs) are based on 1000 bootstrapped samples, holding populations fixed and resampling clusters with replacement. Population-level estimates are included for Andabet, Dera, Woreta town, and Alefa, Ethiopia, but cluster-level PCR prevalence was not available for these populations. Figure 1 includes each study’s sample size. ETH Ethiopia, MWI Malawi, NER Niger, TZA Tanzania, TF trachomatous inflammation—follicular. Source data are provided with this paper. Created with notebook https://osf.io/rt825.
Fig. 6
Fig. 6. Identification of clusters with C. trachomatis infection using seroprevalence.
a Sensitivity and specificity curves for identification of clusters with any C. trachomatis PCR infections based on different seroprevalence thresholds among children 1–9 years old (n = 281 clusters, 112 clusters with PCR > 0%). Vertical lines delineate sensitivity at 90% (solid line, 13.5% seroprevalence) and 80% (dotted line, 22.5% seroprevalence). Thin lines show sensitivity for each study population with cluster-level PCR measurements. Points at the bottom of the panel mark seroprevalence estimates for each study population. b Receiver operating characteristic (ROC) curves for all clusters (thick black line) and for each study population (thin colored lines) with overall area-under-the-curve (AUC). Note that the ROC curve for Kongwa, TZA 2013 lies beneath the curve for Wag Hemra, ETH (WUHA). Figure 1 includes each study’s sample size. ETH Ethiopia, MWI Malawi, NER Niger, TZA Tanzania. Supplementary Data 1 includes underlying sensitivity and specificity values at each cutoff. Source data are provided with this paper. Created with notebook https://osf.io/vgekh.

Update of

References

    1. World Health Organization. Ending the neglect to attain the sustainable development goals: a roadmap for neglected tropical diseases 2021–2030. https://apps.who.int/iris/handle/10665/361856 (2020).
    1. Taylor HR, Burton MJ, Haddad D, West S, Wright H. Trachoma. Lancet. 2014;384:2142–2152. doi: 10.1016/S0140-6736(13)62182-0. - DOI - PubMed
    1. Keenan JD, et al. Clinical activity and polymerase chain reaction evidence of chlamydial infection after repeated mass antibiotic treatments for trachoma. Am. J. Trop. Med. Hyg. 2010;82:482–487. doi: 10.4269/ajtmh.2010.09-0315. - DOI - PMC - PubMed
    1. Amza A, et al. Community-level association between clinical trachoma and ocular chlamydia infection after MASS azithromycin distribution in a mesoendemic region of Niger. Ophthalmic Epidemiol. 2019;26:231–237. doi: 10.1080/09286586.2019.1597129. - DOI - PMC - PubMed
    1. Ramadhani AM, Derrick T, Macleod D, Holland MJ, Burton MJ. The relationship between active trachoma and ocular chlamydia trachomatis infection before and after mass antibiotic treatment. PLoS Negl. Trop. Dis. 2016;10:e0005080. doi: 10.1371/journal.pntd.0005080. - DOI - PMC - PubMed

Publication types