. 2023 Jun 5;14(1):3261.
doi: 10.1038/s41467-023-39029-9.

Bacteriophage therapy against pathological Klebsiella pneumoniae ameliorates the course of primary sclerosing cholangitis

Affiliations

Bacteriophage therapy against pathological Klebsiella pneumoniae ameliorates the course of primary sclerosing cholangitis

Masataka Ichikawa et al. Nat Commun. .

Abstract

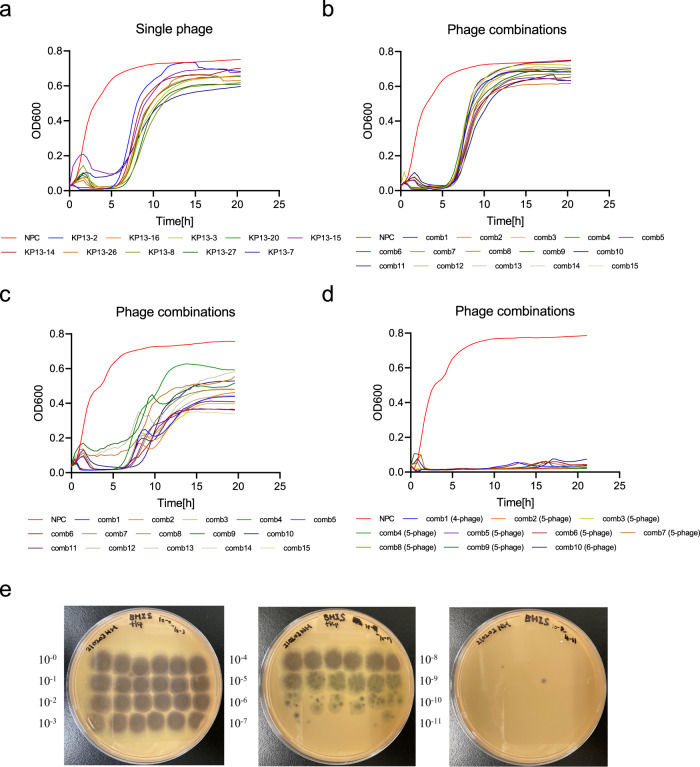
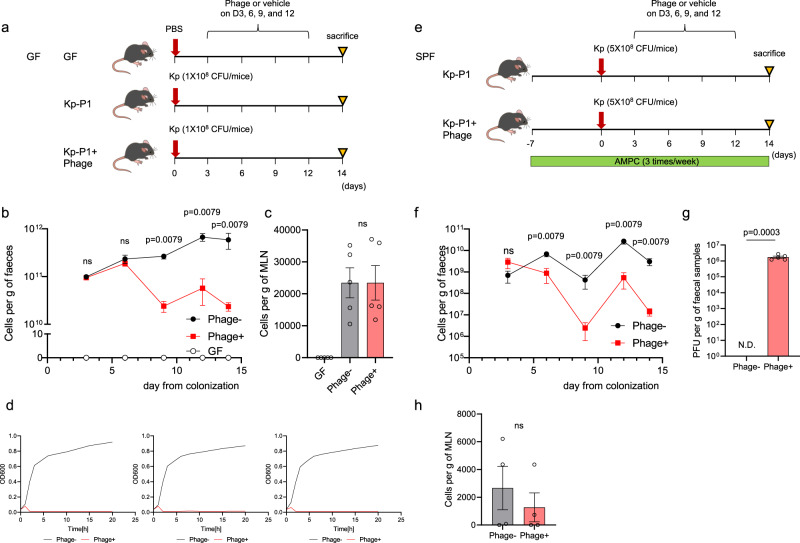
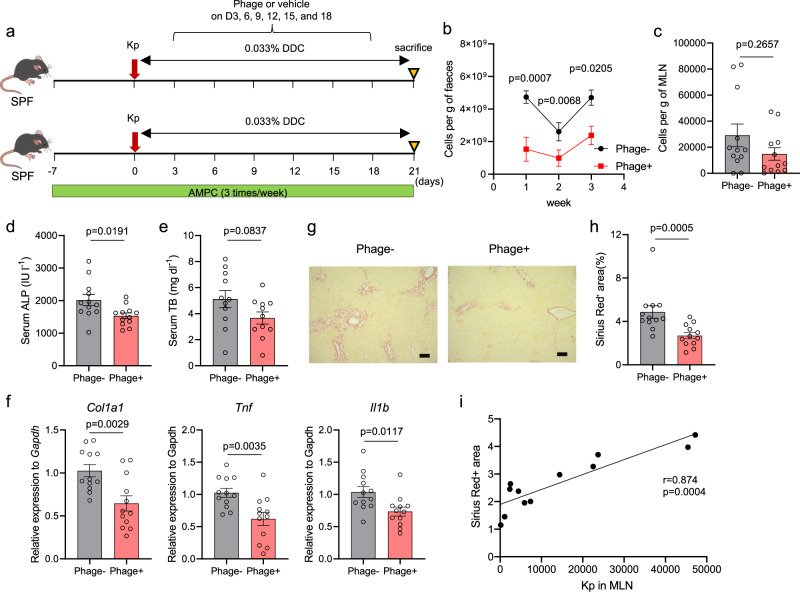
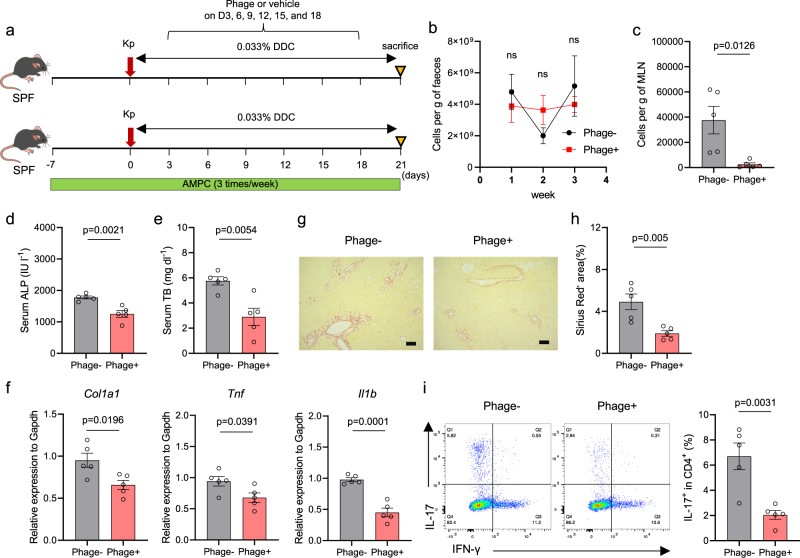
Primary sclerosing cholangitis (PSC) is characterized by progressive biliary inflammation and fibrosis. Although gut commensals are associated with PSC, their causative roles and therapeutic strategies remain elusive. Here we detect abundant Klebsiella pneumoniae (Kp) and Enterococcus gallinarum in fecal samples from 45 PSC patients, regardless of intestinal complications. Carriers of both pathogens exhibit high disease activity and poor clinical outcomes. Colonization of PSC-derived Kp in specific pathogen-free (SPF) hepatobiliary injury-prone mice enhances hepatic Th17 cell responses and exacerbates liver injury through bacterial translocation to mesenteric lymph nodes. We developed a lytic phage cocktail that targets PSC-derived Kp with a sustained suppressive effect in vitro. Oral administration of the phage cocktail lowers Kp levels in Kp-colonized germ-free mice and SPF mice, without off-target dysbiosis. Furthermore, we demonstrate that oral and intravenous phage administration successfully suppresses Kp levels and attenuates liver inflammation and disease severity in hepatobiliary injury-prone SPF mice. These results collectively suggest that using a lytic phage cocktail shows promise for targeting Kp in PSC.


Conflict of interest statement

S.K.-R., E.W., I.W., E.K., N.B.-I., D.I., N.K., R.M., J.N., M.G., N.Z., J.J., H.S-L., S.N., N.B., and M.B. are current or past employees of BiomX Ltd. Y.A., M.K. and N.H. are employees of JSR Corporation. The remaining authors declare no competing interests.

Figures

Fig. 1
Fig. 1. The gut microbiota is associated with the clinical course of PSC.
a, b The prevalence of Kp, Pm, and Eg in fecal samples of patients with PSC was classified according to the presence of IBD complications (a) and the locations affected by colitis (b). Fisher’s exact test (a) or Chi-square test (b) were applied to compare the differences; ns not significant. c, d Characteristics of patients with PSC carrying both Kp and Eg compared with those of non-carriers. c Serum ALP levels. The data shown represent the mean ± standard error of the mean (SEM) (non-carriers: n = 17 patients, Kp+Eg carriers: n = 28 patients). The two-sided Mann–Whitney test was applied. d Transplant-free survival (non-carriers: n = 17 patients, Kp+Eg carriers: n = 28 patients). Kaplan–Meier analysis was applied to determine the cumulative survival percentages, and differences between groups were compared using the two-sided log-rank test.
Fig. 2
Fig. 2. Phage combinations against Kp derived from patients with PSC efficiently suppressed bacterial growth in vitro.
ad Testing the in vitro-growth suppression by single phages (a) and phage combinations (bd) against Kp-P1. Bacterial growth was assessed by determining the OD600 of 0.2 over a 20 h period. The results obtained with the final optimized phage cocktail are shown in d. Each plot shows the median of three biologically independent samples. e Representative photo of the plaque assay demonstrating bacteriolysis observed with serially diluted concentrations of the selected phage cocktail.
Fig. 3
Fig. 3. Oral administration of the phage cocktail reduced the amount of Kp in mice inoculated with a Kp strain derived from a patient with PSC.
a Study design: GF mice inoculated with patient-derived Kp were orally administered with either the phage cocktail or the vehicle every 3 days for 2 weeks. GF mice with PBS inoculation was used as control (n = 5 mice per group). b, c Kp levels in fecal samples (b) and in MLNs (c). d Testing the inhibition of in vitro growth by a finally optimized phage cocktail against three Kp strains isolated from fecal samples of phage-treated mice. Bacterial growth was assessed via an OD600 of 0.2 over a 20 h period. e Study design: SPF mice were pretreated with AMPC 7 days before inoculation with patient-derived Kp and then orally administered with either the phage cocktail or the vehicle every three days for 2 weeks (n = 5 mice per group). f Kp levels in fecal samples. g Phage levels in fecal samples. N.D. not detected. h Kp levels in MLNs. ns not significant. The data shown represent the mean ± SEM. The two-sided Mann–Whitney test (for b, f, and h) or the two-sided Student’s t test (for c and g) was applied.
Fig. 4
Fig. 4. Alteration of the overall gut microbiota composition in Kp-colonized mice that were orally administered the phage cocktail.
a Relative microbiota abundances in fecal and cecal samples collected at the indicated time points. Each genus present at ≥1% (on average) under at least one experimental condition is shown in the bar graph. Klebsiella spp. are represented with black bars. b Alpha-diversities of the microbial communities in stool from the phage −/+ groups on days 0 and 14. The alpha-diversities were calculated using the Shannon index. Each dot represents one sample. The boxes indicate the 25th to 75th percentiles, with the lines within the boxes indicating the median values. The whiskers represent the maximum and minimum values. c Beta-diversities of the fecal samples, demonstrating the temporal changes in the gut microbiota throughout the course of the in vivo study. Principal Coordinate Analysis (PCoA) was conducted using weighted UniFrac distances among the samples. The color density reflects the sampling time point, as indicated in the color scale. Each dot represents one sample. Boxplots showing the distributions of each time point on PCo1 are presented on top. The boxes represent the 25th to 75th percentiles, with the lines within the boxes indicating the median values. The whiskers represent the maximum and minimum values. The dots indicate outliers. d Normalized abundance of each genus in fecal and cecal samples on days 0 and 14. Genera with significant abundance differences between the phage −/+ groups on day 14 are shown, whereas genera that differed significantly on day 0 are excluded. The abundance of each genus was normalized by Min-Max normalization among the samples. ad The numbers of biologically independent samples are as follows: for fecal samples, 3 phage- and 4 phage+ samples on day −7, 4 phage- and 4 phage+ samples on day 0, 5 phage− and 5 phage+ samples on days 3, 6, and 9, and 5 phage− and 4 phage+ samples on days 12 and 14. For cecal samples, there were 5 phage− and 3 phage+ samples on day 14. The two-sided Wilcoxon rank-sum exact test was applied.
Fig. 5
Fig. 5. Oral administration of the phage cocktail attenuated DDC-induced hepatobiliary inflammation and fibrosis progression.
a Study design: SPF mice were pretreated with AMPC 7 days before being inoculated with patient-derived Kp and then orally administered the phage cocktail or the vehicle every three days for 3 weeks during DDC feeding (n = 12 mice per group). b, c Amount of Kp in fecal samples (b) and MLNs (c), as assessed using qPCR. d, e Serum ALP levels (d) and TB levels (e) of the mice. f qPCR analysis of Col1a1, Tnf, and Il1b mRNA expression relative to Gapdh mRNA expression in whole mouse livers. g Representative photomicrographs of Sirius red-stained liver sections from the mice. Scale bars, 100 μm. h Quantitation of the Sirius red-positive areas of the mouse liver sections. The data shown represent the mean ± SEM. The two-sided Mann–Whitney test (for b, c, and h) or the two-sided Student’s t test (for df) was applied. Data are combined from several independent experiments. i Correlation between the amount of Kp in MLNs and the degree of liver fibrosis, assessed via quantitation of the Sirius red-positive areas of the liver sections in the phage-treated mice (n = 12 mice). Spearman’s rank correlation test was applied.
Fig. 6
Fig. 6. Intravenous administration of the phage cocktail attenuated MLN bacterial levels and DDC-induced hepatobiliary inflammation and fibrosis progression.
a Study design: SPF mice were pretreated with AMPC 7 days before being inoculated with patient-derived Kp and then intravenously administered with the phage cocktail or the vehicle every three days during DDC feeding for 3 weeks (n = 5 mice per group). b, c Kp levels in fecal samples (b) and MLNs (c) as assessed by qPCR. d, e Serum ALP levels (d) and TB levels (e) of the mice. f qPCR analysis of Col1a1, Tnf, and Il1b mRNA expression relative to Gapdh mRNA expression in whole mouse livers. g Representative photomicrographs of Sirius red-stained liver sections from the mice. Scale bars, 100 μm. h Quantitation of the Sirius red-positive areas of the mouse liver sections. i Representative flow cytometric staining of intracellular IL-17 and IFN-γ in the liver (left) and the frequency of IL-17+ CD4+ T cells (right). The data shown represent the mean ± SEM. The two-sided Mann–Whitney test (for b) or the two-sided Student’s t test (for cf, h, and i) was applied. ns not significant.

References

    1. Lazaridis KN, LaRusso NF. Primary sclerosing cholangitis. N. Engl. J. Med. 2016;375:1161–1170. doi: 10.1056/NEJMra1506330. - DOI - PMC - PubMed
    1. Dyson JK, Beuers U, Jones DEJ, Lohse AW, Hudson M. Primary sclerosing cholangitis. Lancet. 2018;391:2547–2559. doi: 10.1016/S0140-6736(18)30300-3. - DOI - PubMed
    1. Horsley-Silva JL, Carey EJ, Lindor KD. Advances in primary sclerosing cholangitis. Lancet Gastroenterol. Hepatol. 2016;1:68–77. doi: 10.1016/S2468-1253(16)30010-3. - DOI - PubMed
    1. Sabino J, et al. Primary sclerosing cholangitis is characterised by intestinal dysbiosis independent from IBD. Gut. 2016;65:1681–1689. doi: 10.1136/gutjnl-2015-311004. - DOI - PMC - PubMed
    1. Kummen M, et al. The gut microbial profile in patients with primary sclerosing cholangitis is distinct from patients with ulcerative colitis without biliary disease and healthy controls. Gut. 2017;66:611–619. doi: 10.1136/gutjnl-2015-310500. - DOI - PubMed

Publication types