. 2023 Jun 5;14(1):3250.
doi: 10.1038/s41467-023-39075-3.

Parallel interrogation of the chalcogenide-based micro-ring sensor array for photoacoustic tomography

Affiliations

Parallel interrogation of the chalcogenide-based micro-ring sensor array for photoacoustic tomography

Jingshun Pan et al. Nat Commun. .

Abstract

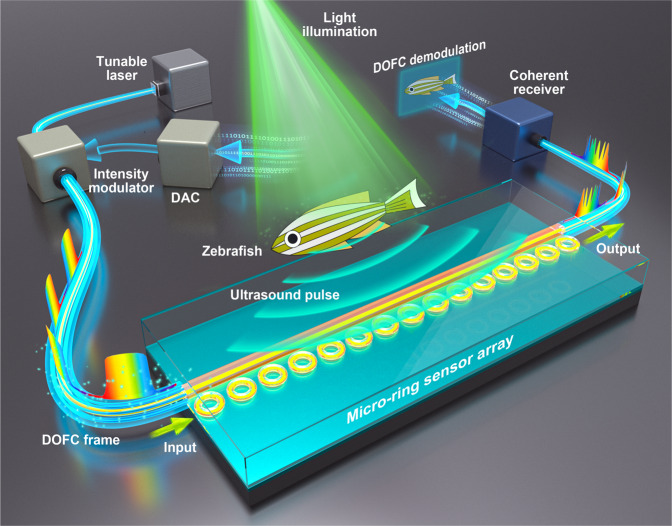
Photoacoustic tomography (PAT), also known as optoacoustic tomography, is an attractive imaging modality that provides optical contrast with acoustic resolutions. Recent progress in the applications of PAT largely relies on the development and employment of ultrasound sensor arrays with many elements. Although on-chip optical ultrasound sensors have been demonstrated with high sensitivity, large bandwidth, and small size, PAT with on-chip optical ultrasound sensor arrays is rarely reported. In this work, we demonstrate PAT with a chalcogenide-based micro-ring sensor array containing 15 elements, while each element supports a bandwidth of 175 MHz (-6 dB) and a noise-equivalent pressure of 2.2 mPaHz-1/2. Moreover, by synthesizing a digital optical frequency comb (DOFC), we further develop an effective means of parallel interrogation to this sensor array. As a proof of concept, parallel interrogation with only one light source and one photoreceiver is demonstrated for PAT with this sensor array, providing images of fast-moving objects, leaf veins, and live zebrafish. The superior performance of the chalcogenide-based micro-ring sensor array and the effectiveness of the DOFC-enabled parallel interrogation offer great prospects for advancing applications in PAT.


Conflict of interest statement

The authors declare no competing interests.

Figures

Fig. 1
Fig. 1. A schematic illustration of performing photoacoustic tomography (PAT) with the chalcogenide-based micro-ring sensor array.
A digital optical frequency comb (DOFC) enabled parallel interrogation allows acoustic signals at all micro-ring sensors to be acquired using only one light source and one photoreceiver in a one-time measurement. DAC digital-to-analog converter.
Fig. 2
Fig. 2. Experimental results of imaging fast-moving objects using the micro-ring sensor array in a single-shot measurement with parallel interrogation.
a Representative images of a fast-moving hot spot along a trajectory of an ‘8’ shape. b Imaging results for a polystyrene microsphere moving in motion.
Fig. 3
Fig. 3. Experimental results of imaging biological sample using the micro-ring sensor array with parallel interrogation.
Scale bars: 1 mm. a Imaging result of a piece of leaf buried inside 5-mm thick tissue-mimicking phantoms using the micro-ring sensor array. b imaging result of the same leaf using only one micro-ring sensor. c, d Enlarged view of the area enclosed in white dashed boxes in (a and b). e One-dimensional profiles along the white lines in the reconstructed images in (a and b) are plotted in red and blue, respectively. f Reconstructed image of the head of a 3-month-old adult zebrafish using the micro-ring sensor array. g Reconstructed image of the tail of a 3-month-old adult zebrafish using the micro-ring sensor array, (h) Whole-body imaging of a zebrafish 7 days post-fertilization using the micro-ring sensor array. DA dorsal aorta, CV cardinal vein, DLAV dorsal longitudinal anastomotic vessel. i Whole-body imaging of a zebrafish 20 days post-fertilization using the micro-ring sensor array. SC spinal column, DF dorsal fin, AF anal fin.
Fig. 4
Fig. 4. Experimental results of imaging interleaved black hairs in the planar geometry using the micro-ring sensor array with parallel interrogation.
Scale bars: 1 mm. a Camera-captured image of the layout of three interleaved black hairs. b Reconstructed image by linearly scanning the sensor within a ± 8-mm range and with a 20-μm step size. cf Reconstructed images using the information collected within the range of (−8, −4) mm, (−4, 0) mm, (0, 4) mm, and (4, 8) mm, respectively.
Fig. 5
Fig. 5. Structural description of the chalcogenide-based micro-ring sensor array.
Each image has a different scale bar, which is provided in the lower right corner in white. a, b The scanning electron micrographs of a micro-ring sensor and a bus waveguide. c, d Numerical simulations of the mode profile, which are confined in the micro-ring sensor and the bus waveguide. e A microscope image of the chip, containing many micro-ring sensor arrays with different parameters. f A photo of the cleaved chip after encapsulation, which contains only one sensor array with a small footprint of about 6 mm × 2 mm. A nickel coin with a 2-cm diameter was placed underneath for comparison. g An enlarged view of the connection part between the bus waveguide and the single-mode optical fiber.
Fig. 6
Fig. 6. Experimental setup and operational principle to perform photoacoustic tomography using the chalcogenide-based micro-ring sensor array.
a Experimental setup of the imaging system. The two insets show the generation and receiving processes of the PA signal. TL tunable laser, IM intensity modulator, DS digital signal, SA sensor array, WT water tank, EDFA erbium-doped fiber amplifier, OTF optical tunable filter, DL optical delay line, CR coherent receiver, DSP digital signal processing, PMF polarization maintaining fiber, SMF single mode fiber, COAX coaxial cable. b The measured transmission spectrum of the sensor array as a function of time in the null case. Inset: a schematic diagram that illustrates how the DOFC samples the transmission spectrum of the sensor array. DOFC digital optical frequency comb. c The measured transmission spectrum of the sensor array when ultrasound is present to modulate the sensor array. d The reconstructed ultrasound signal as a function of time for each micro-ring sensor.
Fig. 7
Fig. 7. Characterization of the micro-ring ultrasound sensor.
a Schematic illustration of the characterization system that focuses pulsed light onto a golden thin film to generate a point-like ultrasound source. L lens, TL tunable laser, SR signal receiver, MR micro-ring. LTS linear translational stage. b The measured PA signal as a function of time. A time window (red dashed box) was implemented to keep only the first arriving signals while excluding the following ones due to multiple reflections. c The frequency response of the micro-ring sensor. The center frequency is around 60 MHz, and the −6 dB bandwidth is about 175 MHz. d Amplitude map of the measured PA signal as a function of time and translational distance. e Frequency response as a function of the acceptance angle. Two experimentally achieved −3 dB lines are also provided in white, matching the theoretical estimations in red. f Noise amplitude spectral density of the micro-ring sensor. g Noise-equivalent-pressure (NEP) spectral density of the micro-ring sensor. h Reconstructed images of the cross-section of the carbon fiber buried inside the agar. i One-dimensional profile along the lateral direction, suggesting a lateral resolution of 50.4 μm. j One-dimensional profile along the axial direction, suggesting an axial resolution of 43.6 μm.
Fig. 8
Fig. 8. Frequency tuning for the micro-ring sensor array with 15 micro-rings.
a Resonant frequencies of the micro-ring sensors after frequency tuning, which are ordered and equally spaced with respect to their labeling. b The quality factors of these micro-ring sensors after frequency tuning, exhibiting good consistency. c A typical transmission spectrum of the micro-ring sensor array after frequency tuning, exhibiting 15 discrete resonant dips.

References

    1. Taruttis A, Ntziachristos V. Advances in real-time multispectral optoacoustic imaging and its applications. Nat. Photonics. 2015;9:219–227. doi: 10.1038/nphoton.2015.29. - DOI
    1. Wang LV, Yao J. A practical guide to photoacoustic tomography in the life sciences. Nat. Methods. 2016;13:627. doi: 10.1038/nmeth.3925. - DOI - PMC - PubMed
    1. Li L, et al. Single-impulse panoramic photoacoustic computed tomography of small-animal whole-body dynamics at high spatiotemporal resolution. Nat. Biomed. Eng. 2017;1:0071. doi: 10.1038/s41551-017-0071. - DOI - PMC - PubMed
    1. Wang X, et al. Noninvasive laser-induced photoacoustic tomography for structural and functional in vivo imaging of the brain. Nat. Biotechnol. 2003;21:803–806. doi: 10.1038/nbt839. - DOI - PubMed
    1. Na S, et al. Massively parallel functional photoacoustic computed tomography of the human brain. Nat. Biomed. Eng. 2021;6:584–592. doi: 10.1038/s41551-021-00735-8. - DOI - PMC - PubMed