

Geochemical and remote sensing integrated with satellite gravity data of Darhib and Atshan talc deposits, South Eastern Desert, Egypt
- PMID: 37277430
- PMCID: PMC10241829
- DOI: 10.1038/s41598-023-31398-x
Geochemical and remote sensing integrated with satellite gravity data of Darhib and Atshan talc deposits, South Eastern Desert, Egypt
Abstract
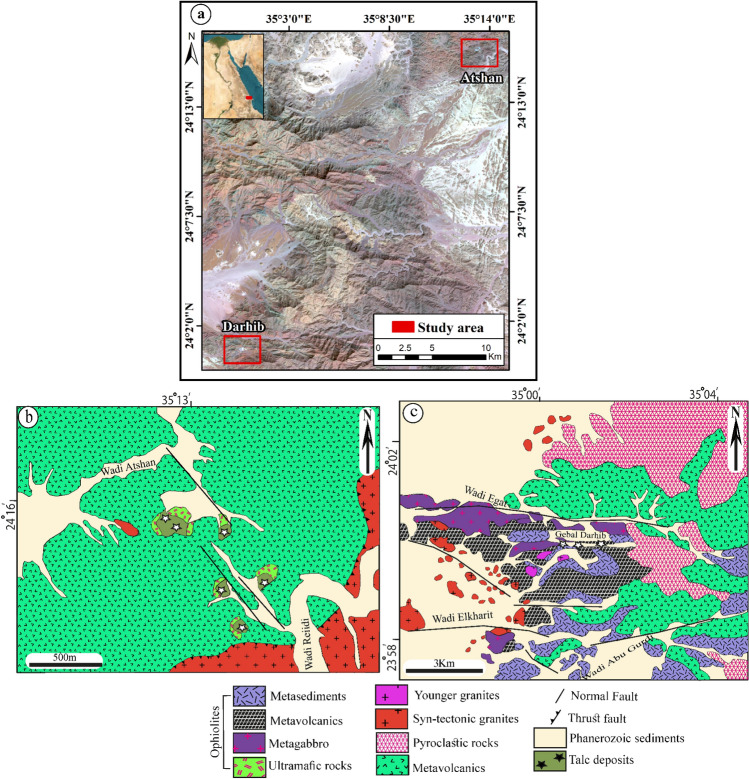
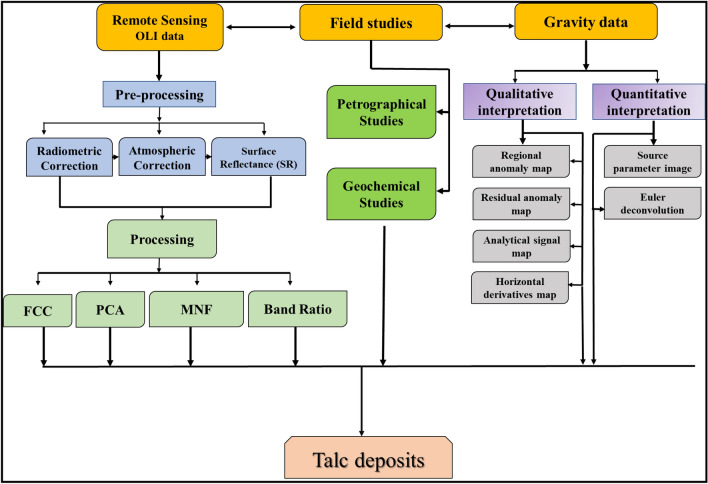
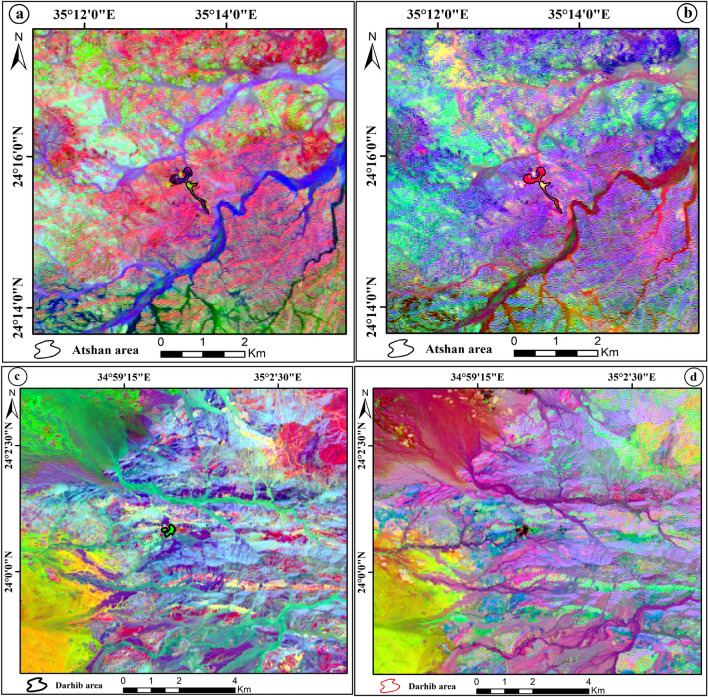
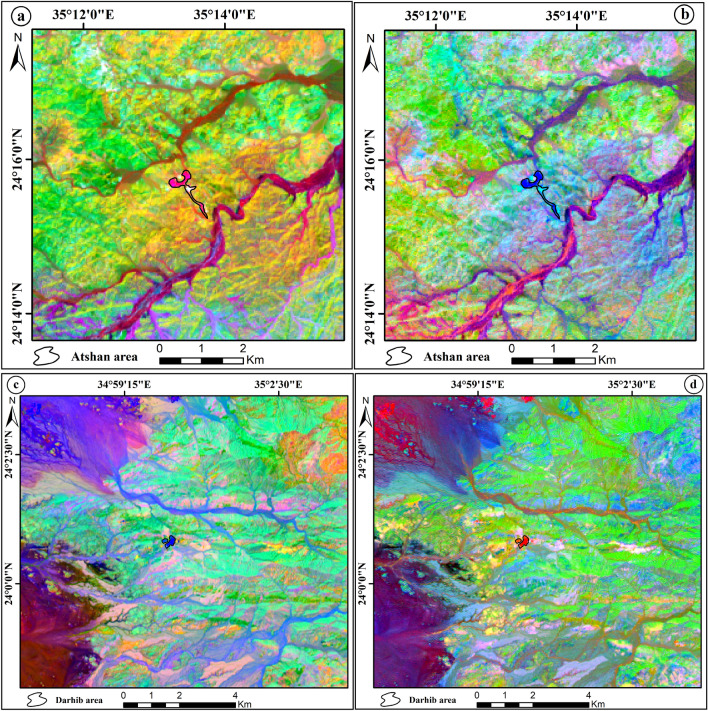
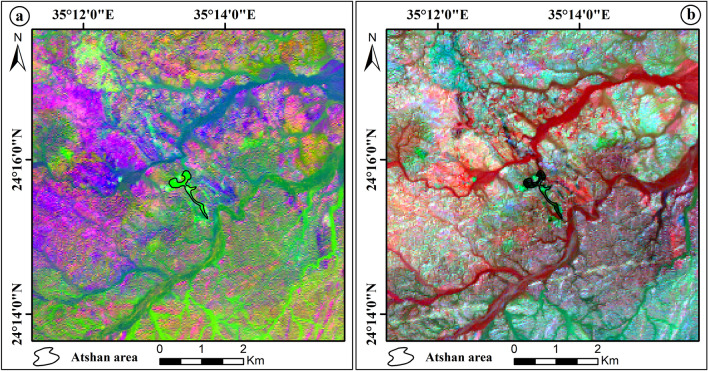
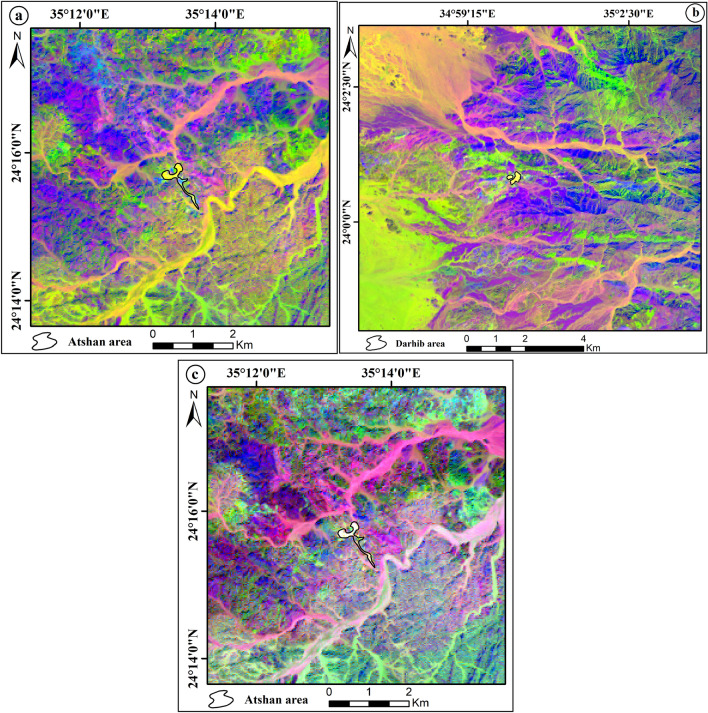
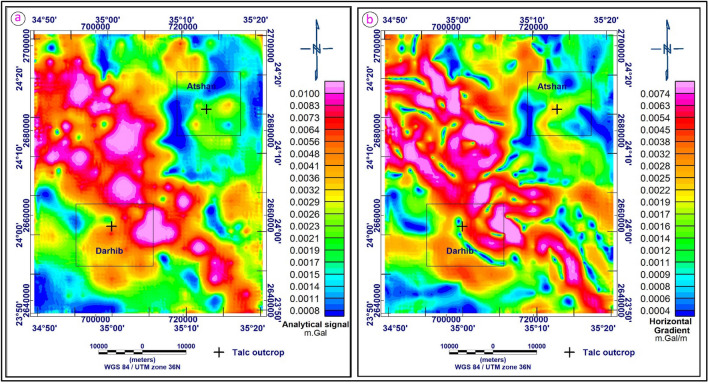
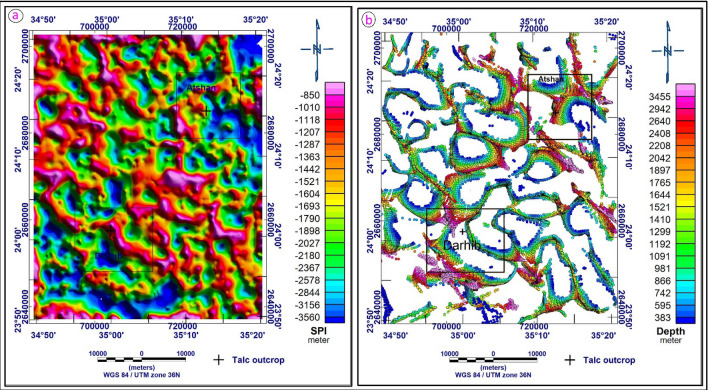
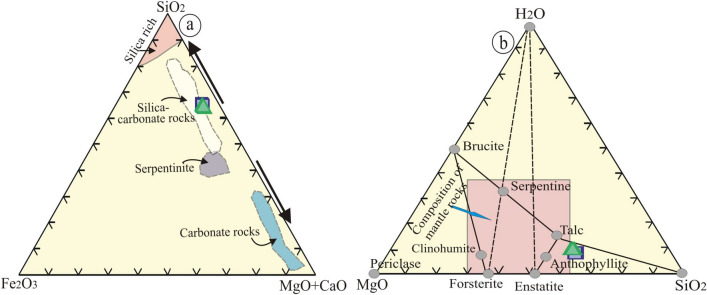
The current contribution conducted new geochemical, remote sensing integrated with gravity detailed studies of talc deposits to identify the talc protolith as well as its extension, depth, and structures. There are two examined areas, distributed from north to south, Atshan and Darhib and both belong to the southern sector of the Egyptian Eastern Desert. They occur as individual lenses or pocket bodies in ultramafic-metavolcanics following NNW-SSE and E-W shear zones. Geochemically, among the investigated talc, Atshan samples have high contents of SiO2 (av. 60.73 wt.%), and higher concentrations of transition elements such as Co (av. 53.92 ppm), Cr (781 ppm), Ni (av. 1303.6 ppm), V (av. 16.67 ppm), and Zn (av. 55.7 ppm). Notably, the examined talc deposits contain low contents of CaO (av. 0.32 wt.%), TiO2 (av. 0.04 wt.%), SiO2/MgO (av. 2.15), and Al2O3 (av. 0.72 wt.%), which is comparable with ophiolitic peridotite and forearc setting. False color composite (FCC), principal component analysis (PCA), minimum noise fraction (MNF), and band ratio (BR) have been used to distinguish talc deposits in the investigated areas. Two new proposed band ratios were created to separate talc deposits. FCC band ratios (2/4, 4/7, 6/5) and (4 + 3/5, 5/7, 2 + 1/3) have been derived to focus on talc deposits in two case studies, Atshan and Darhib areas. The application of regional, residual, horizontal gradient (HG), and analytical signal (AS) techniques to gravity data are used in interpreting the structural directions of the study area. The analysis of this technique displays several notable faults trending in NW-SE, NE-SW, NNW-SSE, and E-W directions. Two techniques of gravity depth calculation were applied in the study areas, namely source parameter image (SPI), and Euler deconvolution (EU). The analysis of these techniques reflects that the depth of subsurface sources ranges between 383 and 3560 m. Talc deposits may be attributed to greenschist facies metamorphism or to a magmatic solution that is (associated with granitic intrusions) interacted with the surrounding volcanic rocks forming metasomatic minerals.
© 2023. The Author(s).
Conflict of interest statement
The authors declare no competing interests.
Figures


References
-
- Abou El Maaty MA, Taman ZI, Wahab WA. Characterization of the Atalla talc-carbonate rocks, central Eastern Desert, Egypt. Egypt. J. Geol. 2012;56:67–83.
-
- Henckens MLCM, van Ierland EC, Driessen PPJ, Worrell E. Mineral resources: Geological scarcity, market price trends, and future generations. Resour. Policy. 2016;49:102–111. doi: 10.1016/j.resourpol.2016.04.012. - DOI
-
- Elnazer AA, Azer MK, Mohamed YMA, El Nazer HA. Comparative effect of the three talc deposits in detoxification of Cr(VI) from wastewater. Int. J. Environ. Sci. Technol. 2022 doi: 10.1007/s13762-022-04475-3. - DOI
-
- Abdel-Karim A-AM, et al. Genesis of sulfide mineralization, Atshan and Darhib Areas, South Eastern Desert of Egypt: Evidence of fluid pathway effects along shear zones. Arab. J. Sci. Eng. 2022;47:641–665. doi: 10.1007/s13369-021-05736-y. - DOI
Grants and funding
LinkOut - more resources
Full Text Sources
Research Materials
