. 2023 Jun 5;13(1):9104.
doi: 10.1038/s41598-023-36413-9.

Effects of anoxic prognostic model on immune microenvironment in pancreatic cancer

Affiliations

Effects of anoxic prognostic model on immune microenvironment in pancreatic cancer

Yangdong Wu et al. Sci Rep. .

Abstract

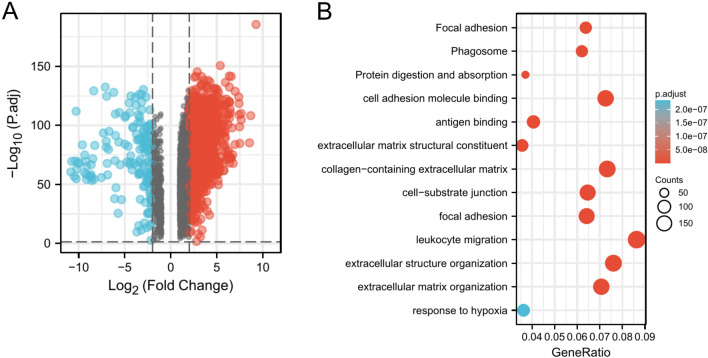
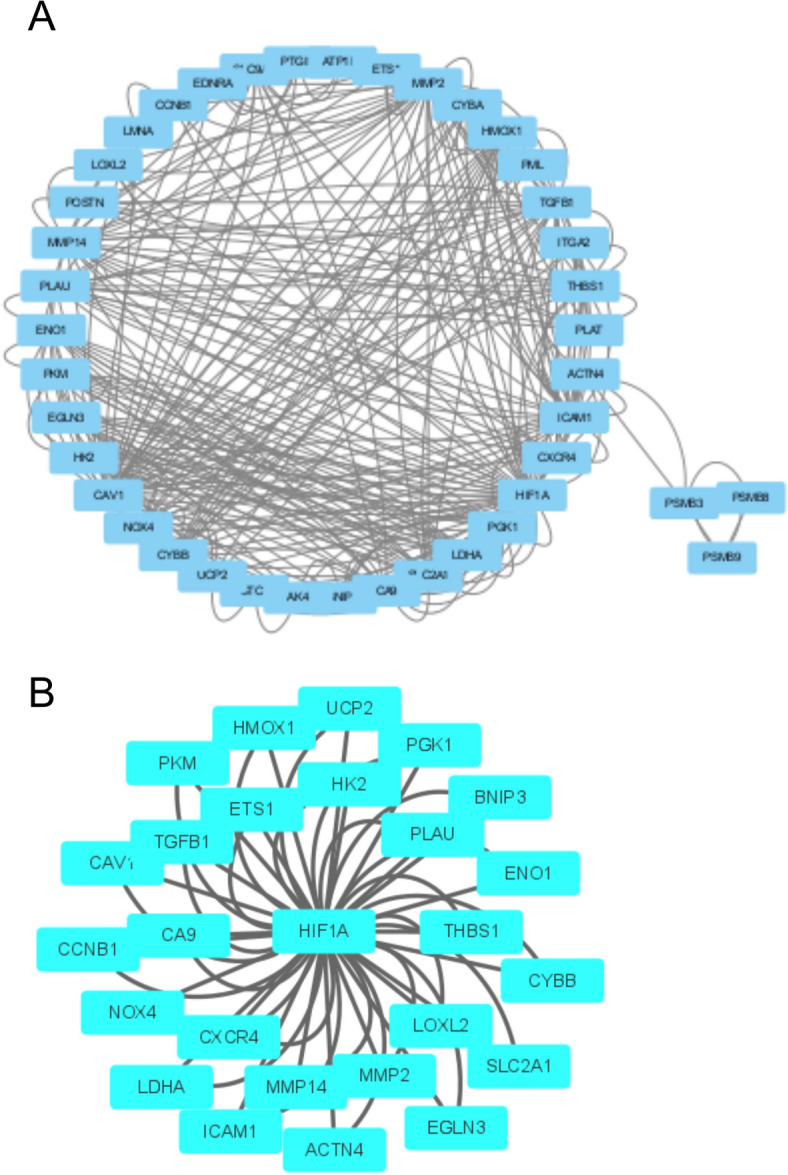
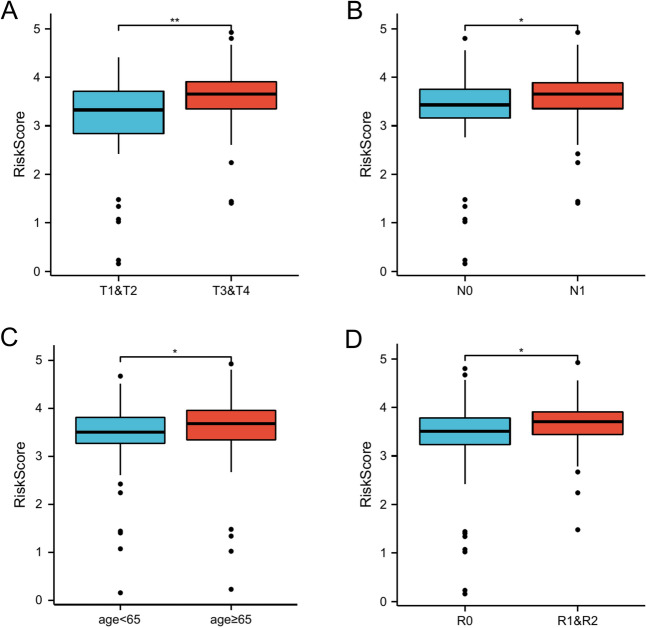
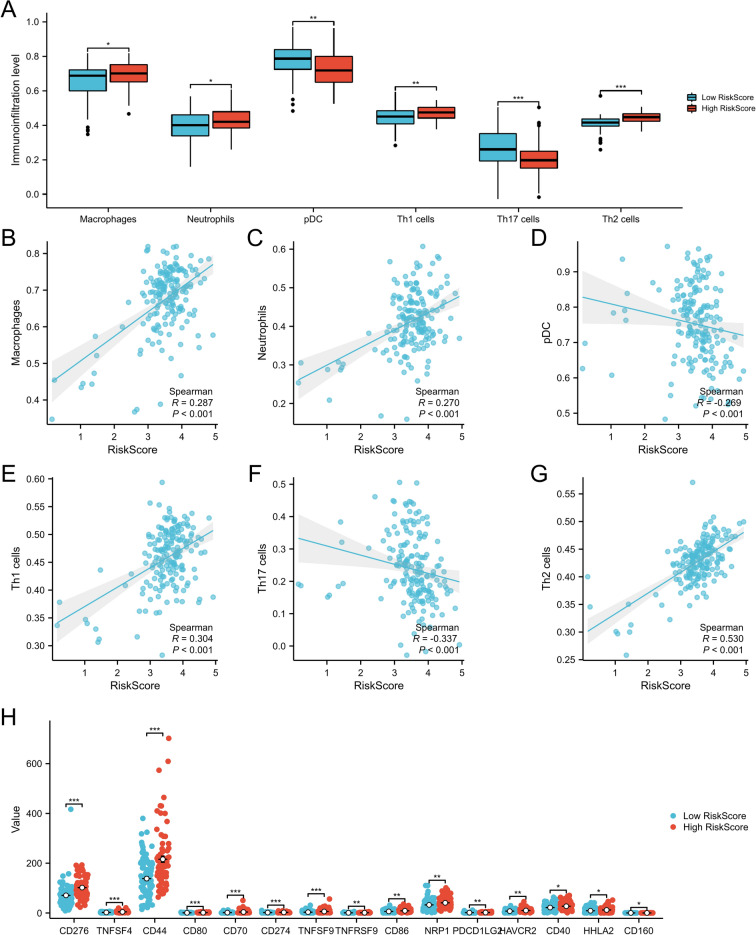
Pancreatic cancer has one of the worst prognoses in the world, which suggests that the tumor microenvironment, which is characterized by hypoxia and immunosuppression, plays a significant role in the prognosis and progression of pancreatic cancer. We identified PLAU, LDHA, and PKM as key genes involved in pancreatic cancer hypoxia through GO/KEGG enrichment related hypoxia pathways and cox regression, established prognostic models, and studied their relationship to immune invasion through bioinformatics using R and related online databases. We verified the high expression of PLAU, LDHA, and PKM in pancreatic cancer cells using qPCR in vitro, and we also discovered that the expression of PLAU, LDHA, and PKM in hypoxic pancreatic cancer cells differed from that in normal cultured pancreatic cancer cells. Finally, we discovered that our prognostic model accurately predicted postrain in pancreatic cancer patients with hypoxia and immune infiltration.


Conflict of interest statement

The authors declare no competing interests.

Figures

Figure 1
Figure 1
Gene differential expression and enrichment analysis from GEPIA2, (A) Pancreatic cancer differential gene from GEPIA2, up-regulated in red and down-regulated in blue, (B) GO/KEGG from the GEPIA2 pancreatic cancer differential gene.
Figure 2
Figure 2
Visualization of genes associated with hypoxia pathways, (A) The PPI network in GO:0001666 and the (B) 25 genes in GO:0001666 are directly related to HIF1A.
Figure 3
Figure 3
Risk score analysis, prognostic performance, and survival analysis of prognostic models, (A). The LASSO regression model of the 3 hypoxia-related genes performed by Lasso-ten-fold cross-validation, (B). The coefficient distribution in the LASSO regression model, (C). Risk scores and survival time distribution of hypoxia-related genes in the TCGA-PAAD cohort, (D). Kaplan–Meier analysis of OS survival between at-risk groups in the TCGA-PAAD cohort, (E). Heat map of gene expression of hypoxia-associated genes in the TCGA-PAAD cohort, (F). The ROC curves of the risk scoring model predict OS of 1-year, 3-year, and 5-year in the TCGA-PAAD cohort.
Figure 4
Figure 4
Analysis of the validation set prognostic model’s risk score, prognostic performance, and survival analysis, (A). The risk scores and survival time distribution of hypoxia-related genes comprise the verification set, (B). Kaplan–Meier survival analysis of OS between at-risk groups in the verification set, (C). The verification set ROC curves of the risk scoring model predicting 1-year, 3-year, and 5-year OS.
Figure 5
Figure 5
Prognosis of 1-year, 3-year, and 5-year OS in PAAD patients by nomogram, (A). nomogram calibration curves to predict 1-year, 3-year, and 5-year OS in TCGA-PAAD cohorts: (B) ROC curves for the prediction of survival by the risk score and other variables (age, gender, T stage, M stage, N stage, G stage); (C) nomogram of risk scores and traditional prognostic factors.
Figure 6
Figure 6
Association between clinical features and risk scores in the TCGA-PAAD dataset; correlation between clinical features and prognostic model risk scores in TCGA-PAAD cohort data: (A) T stage (T1 and T2 vs. T3 and T4), (B) N stage (N0 vs. N1); (C) AGE (age < 65 vs. age ≧65); (D) Residual tumor (R0 vs. R1 and R2).
Figure 7
Figure 7
Immune infiltration and risk score association in the TCGA-PAAD dataset, (A). The box plot shows the level of immune cell infiltration between high-risk and low-risk groups, (BG). Scatter plot of immune cell infiltration associated with risk score, (H) The box plot shows the level of immune checkpoint expression between high-risk and low-risk groups.
Figure 8
Figure 8
The gene was expressed in PANC-1 and hTERT-HPNE cells ((A) PLAU, (B) LDHA, and (C) PKM), and in hypoxic-treated PANC-1 cells and untreated PANC-1 cells ((D) PLAU, (E) LDHA, and (F) PKM).

References

    1. Midha S, Chawla S, Garg PK. Modifiable and non-modifiable risk factors for pancreatic cancer: A review. Cancer Lett. 2016;381(1):269–277. doi: 10.1016/j.canlet.2016.07.022. - DOI - PubMed
    1. Huang S, Zhao J, Song J, Li Y, Zuo R, Sa Y, Ma Z, OuYang H. Interferon alpha-inducible protein 27 (IFI27) is a prognostic marker for pancreatic cancer based on comprehensive bioinformatics analysis. Bioengineered. 2021 doi: 10.1080/21655979.2021.1985858. - DOI - PMC - PubMed
    1. Cao F, Li J, Li A, Li F. Radical antegrade modular pancreatosplenectomy versus standard procedure in the treatment of left-sided pancreatic cancer: A systemic review and meta-analysis. BMC Surg. 2017;17(1):67. doi: 10.1186/s12893-017-0259-1. - DOI - PMC - PubMed
    1. Koller M, Hartmans E, de Groot DJA, Zhao XJ, van Dam GM, Nagengast WB, et al. Data-driven prioritization and review of targets for molecular-based theranostic approaches in pancreatic cancer. J. Nucl. Med. 2017;58(12):1899–1903. doi: 10.2967/jnumed.117.198440. - DOI - PubMed
    1. Ansari D, Tingstedt B, Andersson B, Holmquist F, Sturesson C, Williamsson C, Sasor A, Borg D, Bauden M, Andersson R. Pancreatic cancer: Yesterday, today and tomorrow. Future Oncol. 2016 doi: 10.2217/fon-2016-0010. - DOI - PubMed

Publication types

Substances