. 2023 Jun;4(6):812-828.
doi: 10.1038/s43018-023-00577-0. Epub 2023 Jun 5.

An allosteric pan-TEAD inhibitor blocks oncogenic YAP/TAZ signaling and overcomes KRAS G12C inhibitor resistance

Affiliations

An allosteric pan-TEAD inhibitor blocks oncogenic YAP/TAZ signaling and overcomes KRAS G12C inhibitor resistance

Thijs J Hagenbeek et al. Nat Cancer. 2023 Jun.

Abstract

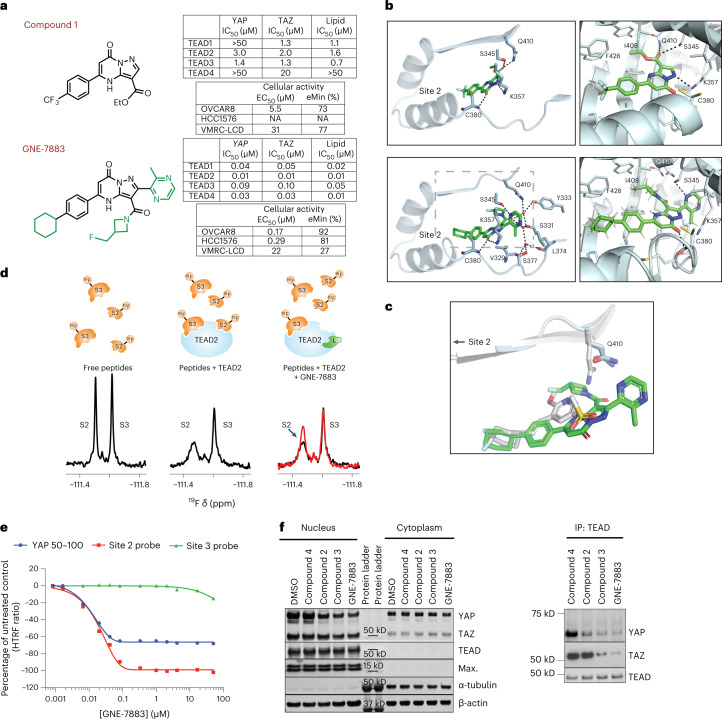
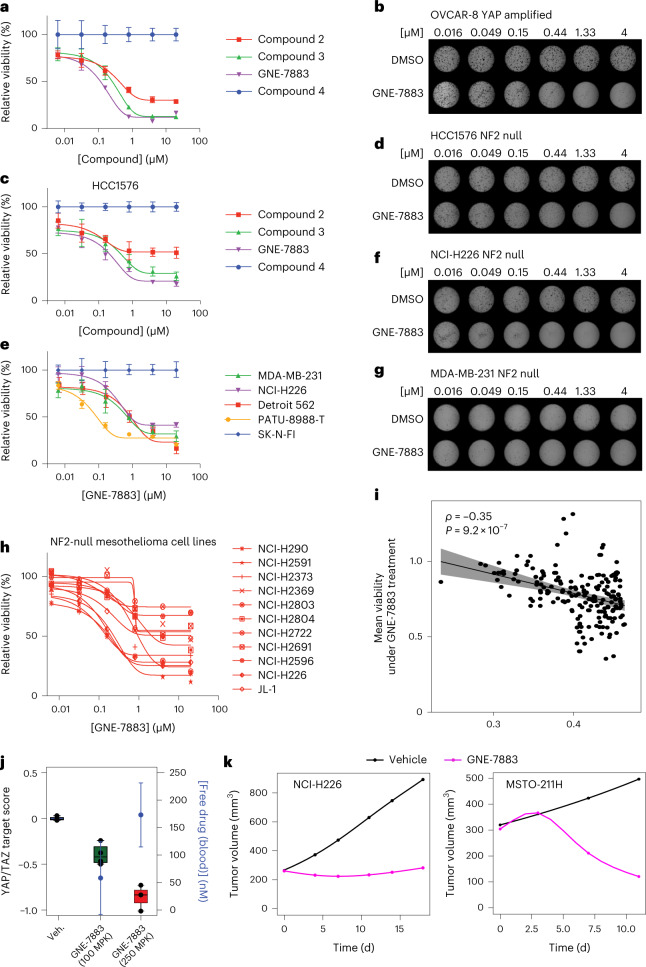
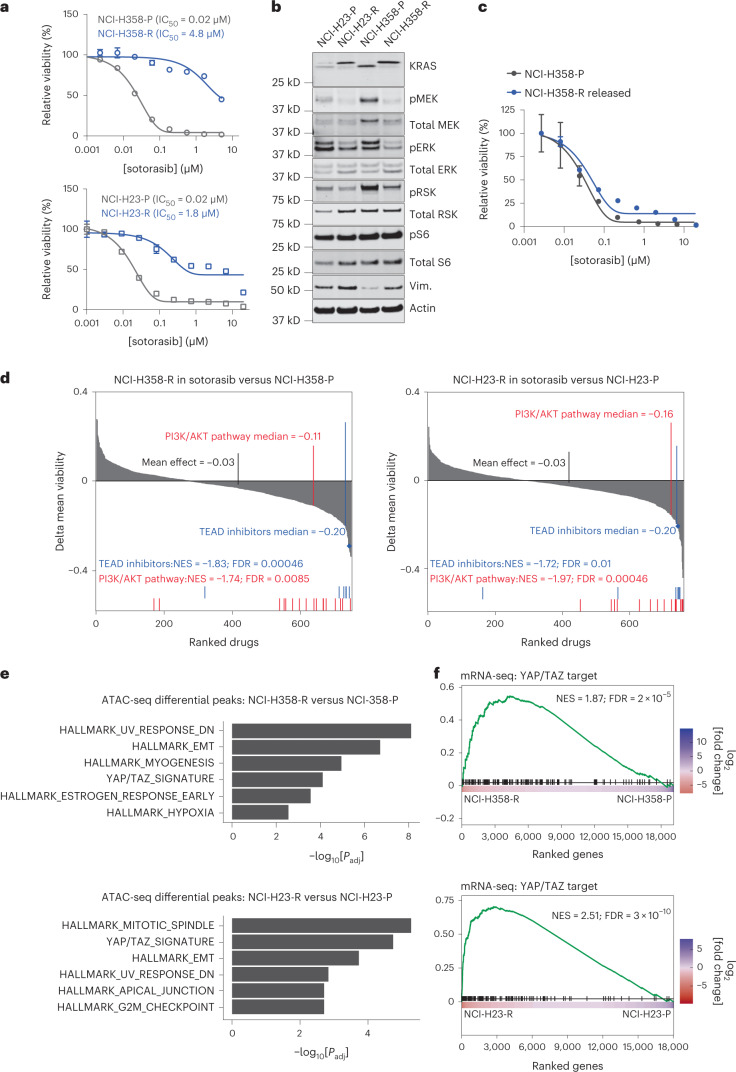
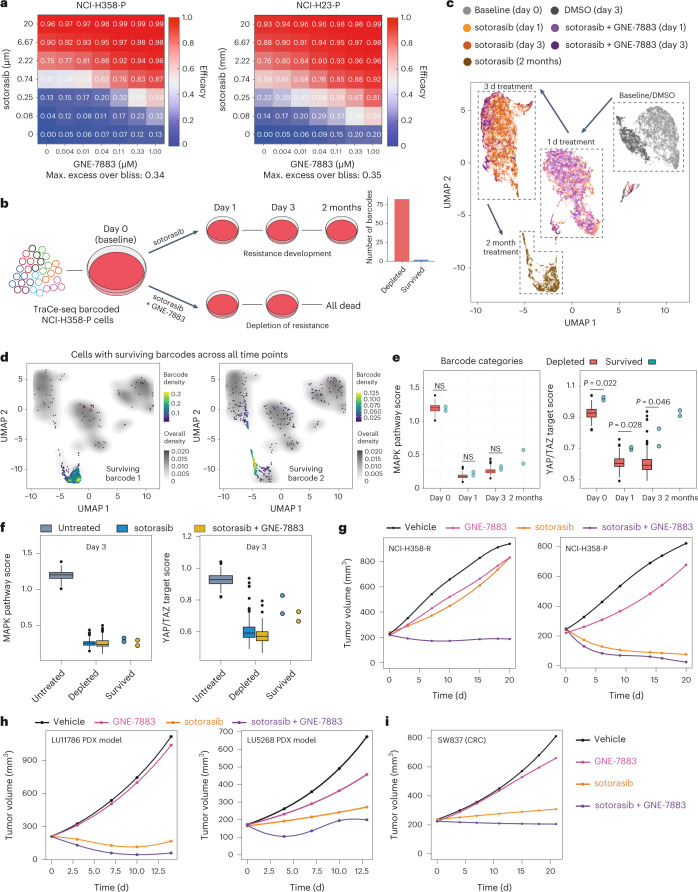
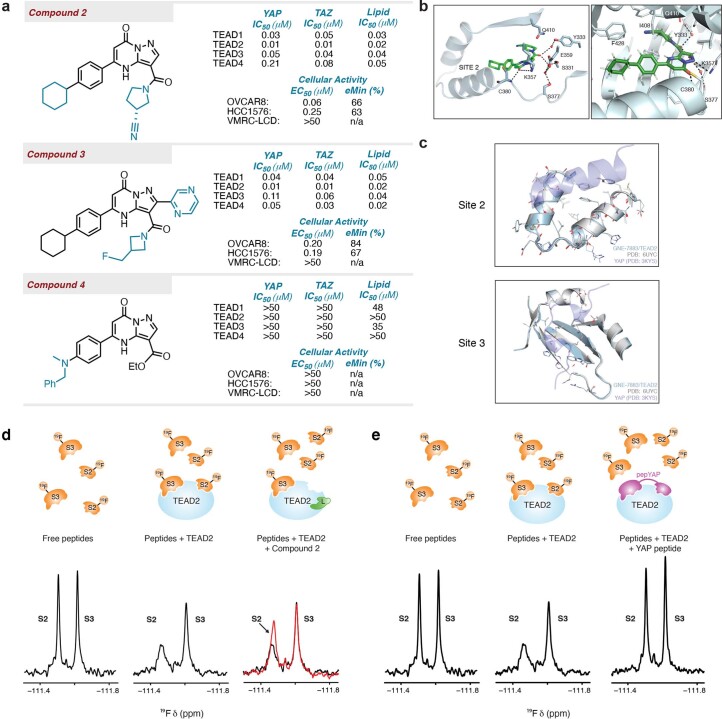
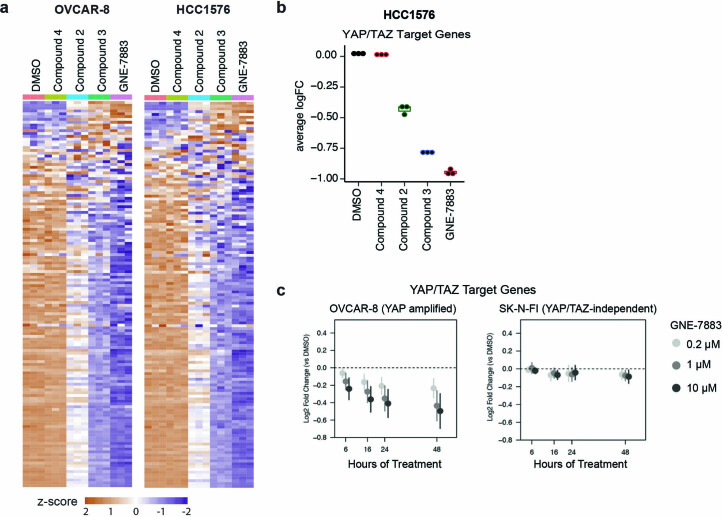
The Hippo pathway is a key growth control pathway that is conserved across species. The downstream effectors of the Hippo pathway, YAP (Yes-associated protein) and TAZ (transcriptional coactivator with PDZ-binding motif), are frequently activated in cancers to drive proliferation and survival. Based on the premise that sustained interactions between YAP/TAZ and TEADs (transcriptional enhanced associate domain) are central to their transcriptional activities, we discovered a potent small-molecule inhibitor (SMI), GNE-7883, that allosterically blocks the interactions between YAP/TAZ and all human TEAD paralogs through binding to the TEAD lipid pocket. GNE-7883 effectively reduces chromatin accessibility specifically at TEAD motifs, suppresses cell proliferation in a variety of cell line models and achieves strong antitumor efficacy in vivo. Furthermore, we uncovered that GNE-7883 effectively overcomes both intrinsic and acquired resistance to KRAS (Kirsten rat sarcoma viral oncogene homolog) G12C inhibitors in diverse preclinical models through the inhibition of YAP/TAZ activation. Taken together, this work demonstrates the activities of TEAD SMIs in YAP/TAZ-dependent cancers and highlights their potential broad applications in precision oncology and therapy resistance.


Conflict of interest statement

All authors are employed by Genentech or were employed by Genentech at the time of their contributions to this work.

Figures

Fig. 1
Fig. 1. Discovery and characterization of the potent pan-TEAD inhibitor GNE-7883.
a, Chemical structures and key biochemical and cellular activity data for compound 1 and GNE-7883. b, Crystal structure of compound 1 (top row) and GNE-7883 (bottom row) bound in the TEAD2 lipid pocket. Site 2 is shown for reference. The compounds are shown in green stick representation. c, Overlay of the crystal structures of GNE-7883 bound to TEAD2 and a compound known to bind in the lipid pocket but not inhibit YAP/TAZ binding (Protein Data Bank accession 6UYC, colored gray). d, Left, 19F NMR spectrum of fluorinated peptides S2 and S3 at 20 μM. Middle, 19F NMR spectrum of fluorinated peptides S2 and S3 at 20 μM in the presence of 10 μM TEAD2. The 19F NMR signals for the free S2 and S3 peptides are reduced upon binding to TEAD2. Right, overlay between the 19F NMR spectra of 20 μM S2 and S3 in the presence of 10 μM TEAD2 (black trace) and after the addition of 55 μM GNE-7883 (red trace). e, Dose–response curve showing displacement of the site 2 probe by GNE-7883, confirming allosteric perturbation of TEAD2 site 2. Under the same assay conditions, YAP 50–100 displacement plateaus at 60%, while no perturbation of the site 3 probe is observed with GNE-7883. The experiment was performed once with two technical replicates. f, Nuclear and cytosolic fractionation (left) of YAP-amplified OVCAR-8 cells treated with 3 μM TEAD SMI or dimethyl sulfoxide (DMSO). In parallel, reciprocal immunoblotting of YAP and TAZ was conducted following immunoprecipitation with a pan-TEAD antibody (right). The experiments were repeated twice with consistent results. Source data
Fig. 2
Fig. 2. GNE-7883 specifically decreases chromatin accessibility at TEAD motifs and YAP/TAZ target genes.
a, Differential analysis of ATAC-seq of OVCAR-8 cells treated with dimethyl sulfoxide (DMSO) or GNE-7883 for 48 h (n = 3 independently treated cell cultures). The pink points are significantly altered regions. The red line is a fitted Lowess curve through all of the regions. b, Genomic annotations of the differential ATAC-seq peaks by ChIPAnnotate. CDS, coding sequence; UTR, untranslated region. c, deepTools visualization of lost ATAC-seq peaks and motif enrichment analysis. d, Lost peaks were assigned to genes using known distal enhancer–gene target links in Poly-Enrich and the ten most significant pathways were computed by gene set enrichment. P values was derived from one-sided binomial test. e, UCSC genome browser view of ATAC-seq at known targets of TEAD, ANKRD1 (ankyrin repeat domain 1) and CCN1 (cellular communication network factor 1). Promoter regions are shaded in yellow and enhancer regions are shaded in blue. The experiments were repeated twice with consistent results. f, Box plots showing aggregated expression level changes of the YAP/TAZ target genes, as measured by messenger RNA-seq in OVCAR-8 cells under the indicated treatments for 48 h (n = 3 independently treated cell cultures). The data are presented as medians ± 25%. The lower and upper whiskers extend from the hinge to the smallest or largest values. Source data
Fig. 3
Fig. 3. GNE-7883 inhibits the growth of YAP/TAZ-dependent cell lines in vitro and in vivo.
a, Viability dose–response curves (means ± s.d.) of OVCAR-8 cells treated with TEAD SMIs (n = 10 independently treated cell cultures). b, Soft agar colony formation dose responses of OVCAR-8 cells treated with GNE-7883 versus dimethyl sulfoxide (DMSO) control. The experiment was performed twice with similar results. c, Viability dose–response curves (means ± s.d.) of HCC1576 cells treated with TEAD SMIs (n = 5 independently treated cell cultures). d, Soft agar colony formation dose responses of HCC1576 cells treated with GNE-7883 versus DMSO control. The experiment was performed twice with similar results. e, Viability dose–response curves (means ± s.d.) of YAP/TAZ-dependent OVCAR-8, HCC1576, MDA-MB-231 and NCI-H226 cells versus YAP/TAZ-independent SK-N-FI cells treated with GNE-7883 (n = 5 independently treated cell cultures per condition). f,g, Soft agar colony formation dose responses of NCI-H226 (f) and MDA-MB-231 (g) cells treated with GNE-7883 or DMSO control. The experiment was performed twice with similar results. h, Viability dose–response curves (means ± s.d.) of NF2-null mesothelioma cell lines treated with GNE-7883 (n = 5 independently treated cell cultures) i, Cell viability responses to GNE-7883 in 196 cell lines correlate (Spearman’s ρ = −0.35; P = 9.2 × 10−7) with baseline transcriptional YAP/TAZ target scores. The error band represents the 95% confidence interval. j, Pharmacodynamic analysis of GNE-7883, including unbound compound concentrations (means ± s.d.) in the blood and YAP/TAZ target scores of NCI-H226 xenograft tumors treated with GNE-7883 once daily for 4 days (n = 4 mice per group). The lower and upper hinges of the boxes correspond to the first and third quartiles (that is, the 25th and 75th percentiles). The lower and upper whiskers extend from the hinge to the smallest or largest values. MPK, milligrams per kilogram. k, In vivo efficacy study of mice bearing NCI-H226 (left; n = 10 mice per group) and MSTO-211H (right; n = 9 mice per group) xenograft tumors treated with GNE-7883 (magenta) at 250 mg kg−1 (4 d on 2 d off) or control vehicle (black) until the end of the treatment. Source data
Fig. 4
Fig. 4. The YAP/TAZ transcriptional program is a prominent driver of KRAS G12C inhibitor resistance in lung cancer cells.
a, Sotorasib viability dose–response curves (means ± s.d.) for NCI-H358-P and NCI-H358-R cells (top) and NCI-H23-P and NCI-H23-R cells (bottom) (n = 3 independently treated cell cultures per condition). b, Western blot analysis showing KRAS G12C alkylation and target engagement and key pathway nodes in untreated parental cells versus NCI-H23-R and NCI-H358-R cells maintained in sotorasib. The experiments were repeated four times with consistent results. Vim., vimentin. c, Sotorasib viability dose–response curves (means ± s.d.) for parental NCI-H358-P cells and NCI-H358-R cells passaged in drug-free media for 8 weeks (NCI-H358-R released) (n = 3 independently treated cell cultures per condition) d, Chemical genetic screens of 720 small molecules, assessing differences in the mean viability values between sotorasib-resistant NCI-H358-R (left) and NCI-H23-R (right) cells versus their corresponding parental lines. The most enriched drug classes are shown, along with the median delta mean viability, normalized enrichment score (NES) and corresponding FDR value. The blue diamonds represent GNE-7883. e, Pathway enrichment for genes associated with upregulated ATAC-seq peaks in sotorasib-resistant NCI-H358-R (top) and NCI-H23-R (bottom) cells compared with parental cells under acute sotorasib treatment. Padj, adjusted P value. f, GSEA plot showing the enrichment of YAP/TAZ target genes among differentially expressed genes in sotorasib-resistant NCI-H358-R (top) and NCI-H23-R (bottom) cells and their corresponding parental cells under acute sotorasib treatment for 24 h. For df, the P values were calculated using GSEA and adjusted using Benjamini–Hochberg procedure. Source data
Fig. 5
Fig. 5. GNE-7883 overcomes sotorasib resistance by suppressing the reactivation of YAP/TAZ target genes.
a, Heatmaps showing the efficacy (1 for maximum efficacy and 0 for no efficacy) across a dose–response matrix of GNE-7883 and sotorasib combination in NCI-H358 (left) and NCI-H23 (right) cells in 7 d viability assays. b, Schematic of the TraCe-seq setup to compare the response of NCI-H358 cells to sotorasib treatment alone versus in combination with GNE-7883. The bar graph shows the number of barcodes that were depleted versus survived after 2 months of sotorasib treatment. c, Uniform manifold approximation and projection visualization of all cells collected across all time points and conditions. d, Density plot visualization of the distribution of cells carrying either of the surviving barcodes across all time points and treatments. e, Plots showing the MAPK pathway (left) and YAP/TAZ target scores (right) for NCI-H358 cells belonging to different barcode categories (n = 82 distinct depleted barcodes and n = 2 distinct survived barcodes) at baseline (day 0) or under treatment. f, Comparison of the MAPK pathway (left) and YAP/TAZ target scores (right) for each NCI-H358 barcode category (n = 82 distinct depleted barcodes and n = 2 distinct survived barcodes) treated for 3 d with sotorasib alone or in combination with GNE-7883. For e and f, the boxes (for n > 3 only) represent the distribution of scores per barcode for all barcodes in a given category (the counts are aggregated based on the cell barcodes and the box plots comprise the pseudo-bulk values for barcodes in the different categories). The lower and upper hinges correspond to the first and third quartiles (that is, the 25th and 75th percentiles). The lower and upper whiskers extend from the hinge to the smallest or largest value no further than 1.5× the interquantile range from the hinge. The data beyond the ends of the whiskers are outlying points and have been plotted individually. P values were calculated by two-sided Wilcoxon rank-sum test. NS, not significant (P > 0.05). gi, Fitted tumor volumes of the sotorasib-resistant NSCLC NCI-H358-R xenograft model (g; left; n = 7 mice per group) and sotorasib treatment-naive NSCLC NCI-H358-P xenograft model (g; right; n = 10 mice per group), NSCLC PDX LU11786 (h; left; n = 5 mice per group) and LU5268 models (h; right; n = 5 mice per group) and colorectal SW837 xenograft model (i; n = 10 mice per group) treated with sotorasib, GNE-7883 or both in combination. Source data
Extended Data Fig. 1
Extended Data Fig. 1. Discovery of small molecule inhibitors blocking TEAD interaction with YAP/TAZ.
(a) Chemical structures and key biochemical and cellular activity data for Compounds 2, 3, and 4. (b) Crystal structure of Compound 2 bound in the TEAD2 lipid pocket. Site 2 is shown for reference. Compound is shown in green stick representation. (c) Overlay of Sites 2 and 3 for the structures of GNE-7883 bound to TEAD2 (blue) and a non-allosteric lipid pocket compound bound to TEAD2 (PDB 6UYC, grey). The YAP Site 2 helix or Site 3 omega loop from PDB 3KYS is overlaid in transparent purple for reference. (d) (Left) 19F NMR spectrum of fluorinated peptides S2 and S3 at and (Middle) in the presence of TEAD2. The 19F NMR signals for the free S2 and S3 peptides are reduced upon binding to TEAD2. (Right) Overlay of the 19F NMR spectra of S2 and S3 in the presence of TEAD2 (black trace) and after addition of Compound 2 (red trace). (e) (Left) 19F NMR spectrum of fluorinated peptides S2 and S3 at 20 μM. (Middle) 19F NMR spectrum of peptides S2 and S3 at 20 μM in the presence of 10 μM TEAD. (Right) 19F NMR spectrum of peptide S2 and S3 at 20 μM in the presence of 10 μM TEAD2-YAP and 55 μM pepYAP. Source data
Extended Data Fig. 2
Extended Data Fig. 2. TEAD SMIs selectively modulate YAP/TAZ target genes.
a) Heatmap showing expression of the YAP/TAZ target genes measured by mRNA-sequencing in OVCAR-8 and HCC1576 cells treated with the indicated compounds (n = 3 independently treated cell cultures). (b) Box plot showing aggregated expression changes of the YAP/TAZ target genes in HCC1576 cells treated with the indicated compounds (n = 3 indepedently treated cell culture). Data are presented as median +/− 25%. The lower and upper whiskers extend from the hinge to the smallest or largest values. (c) Downregulation of YAP/TAZ target genes in a time- and concentration-dependent manner in YAP-amplified OVCAR-8 cells (left), but not in control NF2 wildtype, YAP/TAZ negative SK-N-FI cells (right). Error bars represent SD (n = 3 independently treated cell cultures). Source data
Extended Data Fig. 3
Extended Data Fig. 3. Compound 4 does not impact growth of YAP/TAZ-dependent cell lines in vitro.
(a) Viability dose-response curves (mean±SD) of OVCAR-8 cells, HCC1576, and NCI-H226 cells treated with Compound 4 or DMSO. (n > 5 replicates per condition) (b) Viability dose-response curves (mean±SD) of OVCAR-8 cells, HCC1576 cells, versus YAP/TAZ-independent SK-N-FI cells treated with Compound 3 or Compound 4. (n = 5 independently treated cell cultures per condition) (c) Soft agar colony formation dose-response of OVCAR-8 cells, HCC1576 and MDA-MB-231 cells, versus YAP/TAZ-independent control SK-N-FI cells treated with Compound 3 or Compound 4. Experiments were repeated twice with similar results. (d) Box plot showing aggregated expression changes of proliferative and apoptosis genes measured by mRNA-sequencing in OVCAR-8 and HCC1576 cells treated with the indicated compounds (n = 3 independently treated cell cultures). Data are presented as median +/− 25%. The lower and upper whiskers extend from the hinge to the smallest or largest values. Source data
Extended Data Fig. 4
Extended Data Fig. 4. TEAD SMIs inhibit growth of YAP/TAZ-dependent cell lines in vitro and in vivo.
(a) Pharmacodynamic analysis of GNE-7883 by measuring unbound compound concentration in blood (mean±SD). EC50 (unbound values derived from in vitro assays and corrected for 88.3% binding to 10% FCS) concentration is indicated by the dotted line. n = 4 mice per timepoint. (b) Growth contrast plot comparing growth rates (point estimate ± 95% confidence interval) of tumors treated with GNE-7883 at 250 mg/kg, 4 days on 2 days off (magenta) versus the vehicle control (black). n = 10 animals per group. (c) Fitted tumor volume estimates are shown alongside tumor measurement of individual animals over time. Dashed blue lines in the right plot represent the fitted tumor growth curve under vehicle treatment. n = 10 mice per group. (d) Percent changes in body of mice treated with indicated compounds over time. The fitted estimates are shown alongside with body weight measurement of individual animals. n = 10 mice per group. Source data
Extended Data Fig. 5
Extended Data Fig. 5. Development of sotorasib resistant lung cell line models.
(a) Schematic showing cross talk between KRAS/MAPK signaling and YAP/TAZ activity and how GNE-7883 may overcome resistance to KRAS G12C inhibition by sotorasib. (b) Schematic showing resistance modeling KRAS G12C mutant lung cancer cell line models. (c) Graph of cell growth dynamics and adaptation of NCI-H23 and NCI-H358 cells through sotorasib treatment assessed as percent plate confluence using Incucyte. Experiments were repeated three times with similar results. (d) Immunofluorescence images showing YAP staining (red) in NCI-H358-P cells (left panel) versus in NCI-H358-R cells (right panel). The graph shows quantification of nuclear/cytoplasmic ratio of YAP (n = 801 cells for NCI-H358-P and n = 1494 cells for H358-R). p value was derived from two-sided Wilcoxon Rank Sum Test. The experiment was performed three times with similar results. Source data
Extended Data Fig. 6
Extended Data Fig. 6. GNE-7883 suppresses sotorasib resistance in NCI-H23 cells.
(a) Schematic illustrating TraCe-seq setup comparing the response of NCI-H23 cells to sotorasib treatment alone versus in combination with GNE-7883. (b) Number of TraCe-seq barcodes belong to each of the categories. (c) The MAPK pathway (left) and YAP/TAZ target (right) scores for NCI-H23 cells belonging to different barcode categories (n = 28 distinct depleted barcodes, n = 19 distinct unchanged barcodes, n = 9 distinct enriched barcodes) at baseline (Day 0) or under treatment for 3 or 15 days. Boxes represent the distribution of scores per barcode (average of all cells with the same barcode) for all barcodes in a given category. (d) Comparison of the MAPK pathway (left) and YAP/TAZ target (right) scores for each NCI-H23 barcode categories (n = 28 distinct depleted barcodes, n = 19 distinct unchanged barcodes, n = 9 distinct enriched barcodes) treated for 3 days with sotorasib alone or in combined with GNE-7883. For panels (c) and (d), Boxes represent the distribution of scores per barcode for all barcodes in a given category (Counts are aggregated based on the cell barcodes and the box plots comprise the pseudo-bulk values for barcodes in the different categories). Lower and upper hinges correspond to the first and third quartiles (the 25th and 75th percentiles). The lower and upper whiskers extend from the hinge to the smallest or largest value no further than 1.5 × interquantile range (IQR) from the hinge. Data beyond the end of the whiskers are called ‘outlying’ points and are plotted individually. p-values were derived from two-sided Wilcoxon’s rank sum tests between time points, and from Kruskal-Wallis one-way analysis of variance between categories for each time point. NS, not significant (p > 0.05). Source data
Extended Data Fig. 7
Extended Data Fig. 7. GNE-7883 overcomes intrinsic and acquired sotorasib-resistance in NCI-H358 model in vivo.
(a) Growth contrast plot comparing growth rates (point estimate ± 95% confidence interval) of NCI-H358-R tumors treated with the indicated compounds. n = 8 animals per group. (b) Fitted NCI-H358-R tumor volume estimates are shown alongside tumor measurement of individual animals (n = 7 mice per group) over time. Dashed blue lines in the three right plots represent the fitted tumor growth curve under sotorasib treatment. (c) Percent changes in body weight of NCI-H358-R tumor-bearing mice (n = 7 mice per group) treated with indicated compounds over time. (d) Growth contrast plot comparing growth rates (point estimate ± 95% confidence interval) of NCI-H358-P tumors treated with the indicated compounds. The difference was statistically significant between sotorasib + GNE-7883 combo and sotorasib single agent (Dunnett’s test). (e) Fitted NCI-H358-P tumor volume estimates are shown alongside tumor measurement of individual animals (n = 10 mice per group) over time. Dashed blue lines in the three right plots represent the fitted tumor growth curve under vehicle treatment. (f) Percent changes in body weight of NCI-H358 xenograft tumor-bearing mice (n = 10 mice per group) treated with indicated compounds over time. Source data
Extended Data Fig. 8
Extended Data Fig. 8. GNE-7883 enhances sotorasib response in PDX and SW837 CRC xenograft models in vivo.
(a) Growth contrast plot comparing growth rates (point estimate ± 95% confidence interval) of PDX LU11786 tumors treated with the indicated compounds. n = 5 mice per group. The difference was statistically significant between sotorasib + GNE-7883 combo and sotorasib single agent (Dunnett’s test). (b) Fitted PDX LU11786 tumor volume estimates are shown alongside tumor measurement of individual animals (n = 5 mice per group) over time. Dashed blue lines in the three right plots represent the fitted tumor growth curve under vehicle treatment. (c) Percent changes in body weight of PDX LU11786 tumor-bearing mice (n = 5 mice per group) treated with indicated compounds over time. (d) Growth contrast plot comparing growth rates (point estimate ± 95% confidence interval) of PDX LU5268 tumors treated with the indicated compounds. The difference was statistically significant between sotorasib + GNE-7883 combo and sotorasib single agent (Dunnett’s test). n = 5 mice per group. (e) Fitted PDX LU5268 tumor volume estimates are shown alongside tumor measurement of individual animals (n = 5 mice per group) over time. Dashed blue lines in the three right plots represent the fitted tumor growth curve under vehicle treatment. (f) Percent changes in body weight of PDX LU5268 tumor-bearing mice treated with indicated compounds (n = 5 mice per group) over time. (g) Growth contrast plot comparing growth rates (point estimate ± 95% confidence interval) of SW837 tumors treated with the indicated compounds. n = 10 mice per group. The difference was statistically significant sotorasib + GNE-7883 combo and sotorasib single agent (Dunnett’s test). (h) Fitted SW837 tumor volume estimates are shown alongside tumor measurement of individual animals (n = 10 mice per group) over time. Dashed blue lines in the three right plots represent the fitted tumor growth curve under vehicle treatment. (i) Percent changes in body weight of SW837 xenograft tumor-bearing mice treated with indicated compounds (n = 10 mice per group) over time. Source data

Comment in

References

    1. Dey A, Varelas X, Guan KL. Targeting the Hippo pathway in cancer, fibrosis, wound healing and regenerative medicine. Nat. Rev. Drug Discov. 2020;19:480–494. doi: 10.1038/s41573-020-0070-z. - DOI - PMC - PubMed
    1. Zheng Y, Pan D. The Hippo signaling pathway in development and disease. Dev. Cell. 2019;50:264–282. doi: 10.1016/j.devcel.2019.06.003. - DOI - PMC - PubMed
    1. Yu FX, Guan KL. The Hippo pathway: regulators and regulations. Genes Dev. 2013;27:355–371. doi: 10.1101/gad.210773.112. - DOI - PMC - PubMed
    1. Zanconato F, Cordenonsi M, Piccolo S. YAP/TAZ at the roots of cancer. Cancer Cell. 2016;29:783–803. doi: 10.1016/j.ccell.2016.05.005. - DOI - PMC - PubMed
    1. Zanconato F, Cordenonsi M, Piccolo S. YAP and TAZ: a signalling hub of the tumour microenvironment. Nat. Rev. Cancer. 2019;19:454–464. doi: 10.1038/s41568-019-0168-y. - DOI - PubMed

Substances

LinkOut - more resources