. 2023 Jul;8(7):1280-1292.
doi: 10.1038/s41564-023-01396-w. Epub 2023 Jun 5.

Sexual differentiation in human malaria parasites is regulated by competition between phospholipid metabolism and histone methylation

Affiliations

Sexual differentiation in human malaria parasites is regulated by competition between phospholipid metabolism and histone methylation

Chantal T Harris et al. Nat Microbiol. 2023 Jul.

Abstract

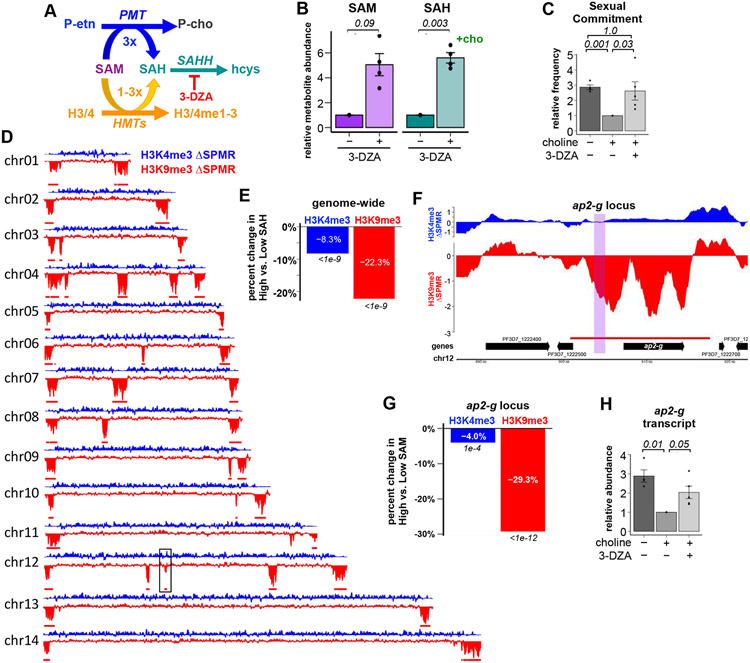
For Plasmodium falciparum, the most widespread and virulent malaria parasite that infects humans, persistence depends on continuous asexual replication in red blood cells, while transmission to their mosquito vector requires asexual blood-stage parasites to differentiate into non-replicating gametocytes. This decision is controlled by stochastic derepression of a heterochromatin-silenced locus encoding AP2-G, the master transcription factor of sexual differentiation. The frequency of ap2-g derepression was shown to be responsive to extracellular phospholipid precursors but the mechanism linking these metabolites to epigenetic regulation of ap2-g was unknown. Through a combination of molecular genetics, metabolomics and chromatin profiling, we show that this response is mediated by metabolic competition for the methyl donor S-adenosylmethionine between histone methyltransferases and phosphoethanolamine methyltransferase, a critical enzyme in the parasite's pathway for de novo phosphatidylcholine synthesis. When phosphatidylcholine precursors are scarce, increased consumption of SAM for de novo phosphatidylcholine synthesis impairs maintenance of the histone methylation responsible for silencing ap2-g, increasing the frequency of derepression and sexual differentiation. This provides a key mechanistic link that explains how LysoPC and choline availability can alter the chromatin status of the ap2-g locus controlling sexual differentiation.


Figures

Extended Data Figure 1:
Extended Data Figure 1:. Central methylation-related metabolites in this study.
Names of enzymes involved in their interconversion are noted in italics and methyl groups being transferred are highlighted in red.
Extended Data Figure 2:
Extended Data Figure 2:. Dose-dependent metabolic response to LysoPC.
Parasites were cultured in media spiked with increasing concentrations of LysoPC. Bar graphs show the mean intracellular metabolite abundances per thousand parasites ± s.e.m (n=3-5). Italicized numbers are p-values based on two-sided ANOVA tests.
Extended Data Figure 3.
Extended Data Figure 3.. Schizont AP2-G transcript abundances closely track sexual commitment under various nutrient conditions.
Bars indicate the mean sexual commitment (left) and AP2-G transcript abundance (right) in schizonts relative to conditions of abundant choline and methionine (+cho) when parasites where exposed to different growth media during the commitment cycle. Error bars and p-values indicate the standard error of the mean and the significance of the mean difference relative to those under conditions of abundant choline and methionine (+cho+met), respectively. n=4-5.
Extended Data Figure 4:
Extended Data Figure 4:. Changes in SAM/SAH metabolism are specific to parasite metabolism.
LCMS quantification of indicted metabolites. Infected and uninfected cultures were cultured in the presence or absence of 20 μM LysoPC or 420μM choline for ~36 hpi during the commitment cycle. Infected (iRBC) and uninfected (uRBC) erythrocytes were then extracted, and metabolite abundances were quantified by LCMS. Bar graphs show the mean intracellular metabolite abundances per thousand cells ± s.e.m (n=3-5). Italicized numbers are p-values based on two-sided paired t-tests.
Extended Data Figure 5:
Extended Data Figure 5:. Validation of PMT-glmS knockdown parasite line.
(A) Generation of PMT-glmS knockdown parasites by selection-linked integration. (B) Validation PCR demonstrating tagging of the endogenous PMT locus.
Extended Data Figure 6:
Extended Data Figure 6:. Removal of methionine (blue diamond) or supplementation with choline (red circles) had no observable effect on growth of NF54 compared to growth in standard malaria medium (green squares).
Extended Data Figure 7:
Extended Data Figure 7:. Validation of pfsams-glmS knockdown parasite line.
(A) Generation of pfsams-glmS knockdown parasites by selection-linked integration. (B) PCR Validation demonstrating tagging of the endogenous pfsams locus.
Extended Data Figure 8:
Extended Data Figure 8:. Validation of pbsams-DD knockdown parasite line.
(A) The endogenous pbsams locus in the P. berghei ANKA strain background was modified by homologous integration to add the ecDHFR destabilization domain (DD) and hemagglutinin epitope tag (HA) at the 3’ end of the pbsams coding sequence. Simultaneous integration of a hDHFR expression cassette allows for selection of integrants. (B) PCR validation of successful tagging in PbSAMS-DD-HA parasites. (C) Successful knockdown of PbSAMS upon removal of trimethoprim (TMP) from the drinking water in mice infected with pbsams-DD parasites. Parasite lysates were assayed for the abundance of PbSAMS-DD with antibodies against the HA epitope tag and PbBIP, which served as a loading control and was used for normalization.
Extended Data Figure 9:
Extended Data Figure 9:. Coverage comparisons of H3K4me3 and H3K9me3 at two representative chromosome 6 loci under Low vs. High SAM conditions.
Coverage of H3K4me3 (blue) and H3K9me3 (red) at representative regions on chromosome 6 that include euchromatin and either subtelomeric heterochromatin (A) or a heterochromatin island (B) under Low SAM (top track of each color) and High SAM conditions (middle track of each color) and the relative difference in coverage (third track of each color). Heterochromatin regions are marked with a red bar. Coverage was normalized as signal per million reads (SPRM) using macs2.
Extended Data Figure 10:
Extended Data Figure 10:. Dose-response of parasite sexual commitment (A) and growth (B) to 3-DZA.
Italicized number is the p-value based on a two-sided t-tests for the +/− choline comparison and ANOVA for the DZA dose response (n=4).
Extended Data Figure 11:
Extended Data Figure 11:. Coverage comparisons of H3K4me3 and H3K9me3 at two representative chromosome 6 loci under High vs. Low SAH conditions.
Coverage of H3K4me3 (blue) and H3K9me3 (red) at representative regions on chromosome 6 that include euchromatin and either subtelomeric heterochromatin (A) or a heterochromatin island (B) under High SAH (top track of each color) and Low SAH conditions (middle track of each color) and the relative difference in coverage (third track of each color). Heterochromatin regions are marked with a red bar. Coverage was normalized as signal per million reads (SPRM) using macs2.
Figure 1.
Figure 1.. Phosphocholine precursor availability alters parasite SAM and SAH levels.
(A) PtdCho (PC) is generated exclusively from P-cho, which can be scavenged from extracellular choline or LysoPC or synthesized de novo via triple methylation of P-etn by PMT, consuming 3 equivalents of SAM and producing 3 equivalents of SAH per P-cho. (B) Synchronous blood-stages were grown for a single cycle (commitment cycle) under various nutrient conditions and samples were collected 36 hours post-invasion. Treated parasites were allowed to re-invade and 50 mM N-acetylglucosamine was added on Day +1 to block asexual replication. The sexual differentiation rate is defined as the percentage of Day +1 ring stages that differentiate into stage III gametocytes by Day +6. (C) P-cho precursors inhibit the frequency of sexual differentiation (n=3). Italicized numbers are p-values from two-sided paired t-tests. (D-E) Intracellular metabolite levels are altered in response to LysoPC or choline supplementation in parasite media. (n=4-6). Bar graphs indicate the mean values relative to the reference condition ± s.e.m. Italicized numbers are p-values from two-sided t-tests.
Figure 2.
Figure 2.. De novo synthesis of P-cho by PMT is a major sink of SAM and source of SAH.
(A-C) Increases in P-choline from choline scavenging downregulates PMT activity as indicated by decreases in the monomethyl- and dimethyl-phopho-ethanolamine (P-etn-me1/2) reaction intermediates (B, n=4) and PMT transcript levels (C, n=3). Transcript abundance was normalized to seryl-tRNA synthetase transcript and shown relative to no choline supplementation. (D) Inducible knockdown of PMT upon addition of 2.5 mM glucosamine (Glm) in PMT-glmS parasites significantly reduces PMT protein abundance relative to PfHSP70 loading control. (n=3) (E) Knockdown of PMT increases intracellular SAM levels (n=6). (F) Knockdown of PMT reduces sexual commitment even in the absence of P-cho precursors. (n=3) Bar graphs indicate the mean values relative to the reference condition ± s.e.m. Italicized numbers are p-values from two-sided paired t-tests.
Figure 3.
Figure 3.. Intracellular SAM abundance regulates the frequency of sexual differentiation in human and rodent malaria parasites.
(A) SAM and SAH are substrate and product, respectively, of both de novo P-cho synthesis and histone methylation. (B) Intracellular levels of methionine, SAM and SAH in growth medium containing standard (100 μM) or no methionine (n=3). (C) Removal of extracellular methionine reverses the suppressive effects of choline supplementation on sexual commitment (n=5). (D) Knockdown of PfSAMS in pfsams-HA-glmS parasites by treatment with 2.5 mM glucosamine (Glm) resulted in a 58% reduction in SAMS protein levels. (E) Knockdown of SAMS reduced intracellular SAM levels by 59% and (F) resulted in a 2.5-fold increase in sexual differentiation even in the presence of choline (n=3). (G) Loss of PMT in rodent malaria parasites, such as P. berghei, decouples SAM and SAH from PtdCho synthesis. (H) Removal of the stabilizing ligand TMP from P. berghei pbsams-DD knockdown parasites reduced PbSAMS by 61% and (I) resulted in a 2-fold increase in sexual differentiation (n=3-4). Bar graphs show mean values relative to the reference condition ± s.e.m. Italicized numbers are p-values based on two-sided paired t-tests.
Figure 4.
Figure 4.. Reducing intracellular SAM levels impairs heterochromatin maintenance and increases both AP2-G expression and sexual commitment.
(A-B) Relative intracellular abundances of SAM and SAH (n=5) (A), and sexual commitment (n=4) (B) under high SAM (+cho & met) vs. low (−cho & met) SAM conditions. (C) Differences in H3K4me3 (blue) and H3K9me3 (red) abundance between parasites grown in low SAM versus high SAM conditions. The box on chromosome 12 indicates the pfap2-g locus. Red bars indicate regions of heterochromatin under high SAM conditions (n=2). SPMR: signal per million reads. (D) Genome-wide change in H3K4me3 (blue) and H3K9me3 (red) coverage under low SAM versus high SAM conditions. (E) Changes in the distribution of H3K4me3 (blue) and H3K9me3 (red) at the pfap2-g locus between parasites grown under low SAM versus high SAM conditions. The purple shaded region contains the AP2-G binding sites within the ap2-g promoter that drive the transcriptional feedback loop. (F) Change in coverage across the pfap2-g heterochromatin peak (red bar) of H3K4me3 (blue) and H3K9me3 (red) between parasites grown under low SAM versus high SAM conditions. (G) Relative abundance of ap2-g transcript levels between parasites grown under low SAM versus high SAM conditions (n=4).
Figure 5.
Figure 5.. Increasing intracellular SAH impairs heterochromatin maintenance and increased both AP2-G expression and sexual commitment.
Inhibition of SAHH with 3-DZA (A) increases intracellular SAM and SAH (n=5) (B) and sexual commitment (n=4) (C). (D) Genome-wide differences in the distribution of H3K4me3 (blue) and H3K9me3 (red) between parasites grown in high SAH (+cho, +met, +3-DZA) versus low SAH (+cho, +met) condition as determined by CUT& RUN. The box on chromosome 12 indicates location of the pfap2-g locus. Red bars indicate regions of heterochromatin (n=2). SPMR: signal per million reads. (E) Mean genome-wide change in H3K4me3 (blue) and H3K9me3 (red) coverage in high SAH versus low SAH conditions. (F) Differences in the distribution of H3K4me3 (blue) and H3K9me3 (red) between parasites grown in high SAH versus low SAH conditions at the pfap2-g locus on chromosome 12. The purple shaded region contains key AP2-G binding sites that drive the transcriptional feedback loop. (G) Mean change in coverage across the pfap2-g heterochromatin peak (red bar) of H3K4me3 (blue) and H3K9me3 (red) between parasites grown in high SAH versus low SAH conditions. Italicized numbers are p-values based on two-sided paired t-tests for metabolite abundance or based on HOMER annotatePeaks and DESeq2 for histone modification abundance. (H) Relative abundance of ap2-g transcript levels between parasites grown under high SAH versus low SAH conditions (n=4).
Figure 6.
Figure 6.. Metabolic competition between PMT and H3K9 methylation controls the rate of sexual commitment.
(A) When P-cho precursors are available, H3K9me3 heterochromatin is efficiently maintained during schizogony resulting in low sexual commitment. (B) When P-cho precursors are scarce, increased de novo P-cho synthesis by PMT reduces SAM and increases SAH, both of which impair deposition H3K9me3 genome. Leaky silencing at the pfap2-g locus increases the probability of activating the positive transcriptional feedback loop, thereby increasing the frequency of commitment to sexual differentiation.

Similar articles

Cited by

References

    1. Drakeley C, Sutherland C, Bousema JT, Sauerwein RW & Targett GAT The epidemiology of Plasmodium falciparum gametocytes: weapons of mass dispersion. Trends in Parasitology 22, 424–430 (2006). - PubMed
    1. Kafsack BFC, Rovira-Graells N, Clark TG, Bancells C, Crowley VM, Campino SG, Williams AE, Drought LG, Kwiatkowski DP, Baker DA, Cortés A & Llinás M A transcriptional switch underlies commitment to sexual development in malaria parasites. Nature 507, 248–252 (2014). - PMC - PubMed
    1. Sinha A, Hughes KR, Modrzynska KK, Otto TD, Pfander C, Dickens NJ, Religa AA, Bushell E, Graham AL, Cameron R, Kafsack BFC, Williams AE, Llinás M, Berriman M, Billker O & Waters AP A cascade of DNA-binding proteins for sexual commitment and development in Plasmodium. Nature 507, 253–257 (2014). - PMC - PubMed
    1. Brancucci NMB, Bertschi NL, Zhu L, Niederwieser I, Chin WH, Wampfler R, Freymond C, Rottmann M, Felger I, Bozdech Z & Voss TS Heterochromatin protein 1 secures survival and transmission of malaria parasites. Cell Host Microbe 16, 165–176 (2014). - PubMed
    1. Fraschka SA, Filarsky M, Hoo R, Niederwieser I, Yam XY, Brancucci NMB, Mohring F, Mushunje AT, Huang X, Christensen PR, Nosten F, Bozdech Z, Russell B, Moon RW, Marti M, Preiser PR, Bartfai R & Voss TS Comparative Heterochromatin Profiling Reveals Conserved and Unique Epigenome Signatures Linked to Adaptation and Development of Malaria Parasites. Cell Host Microbe 23, 407–420.e8 (2018). - PMC - PubMed

Publication types