. 2023 Jun;55(6):995-1008.
doi: 10.1038/s41588-023-01409-8. Epub 2023 Jun 5.

Genetic studies of paired metabolomes reveal enzymatic and transport processes at the interface of plasma and urine

Affiliations

Genetic studies of paired metabolomes reveal enzymatic and transport processes at the interface of plasma and urine

Pascal Schlosser et al. Nat Genet. 2023 Jun.

Abstract

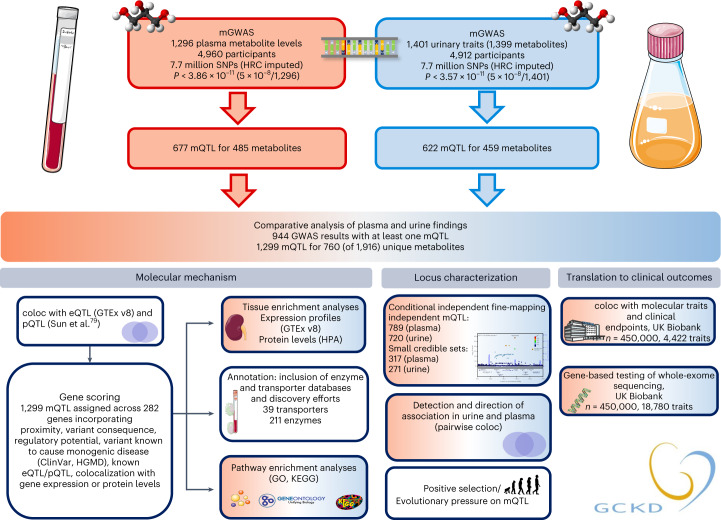
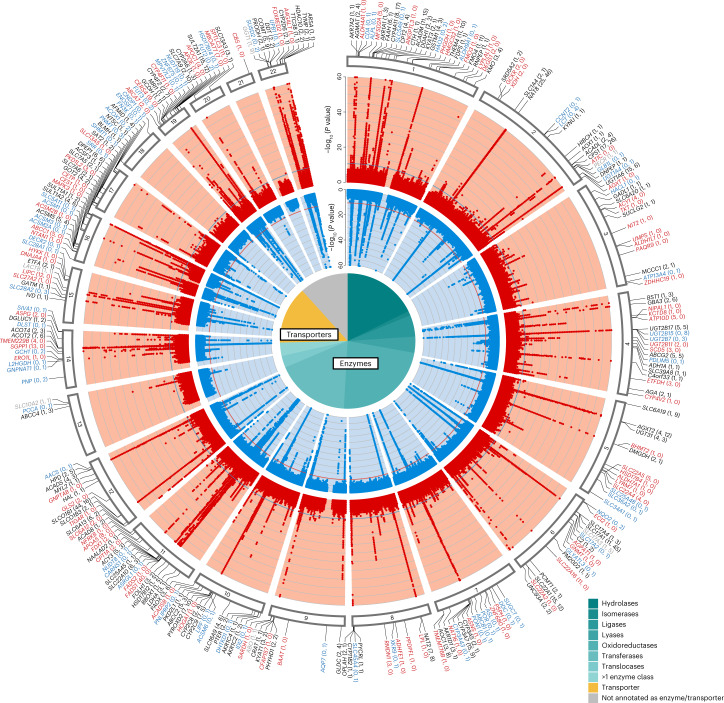
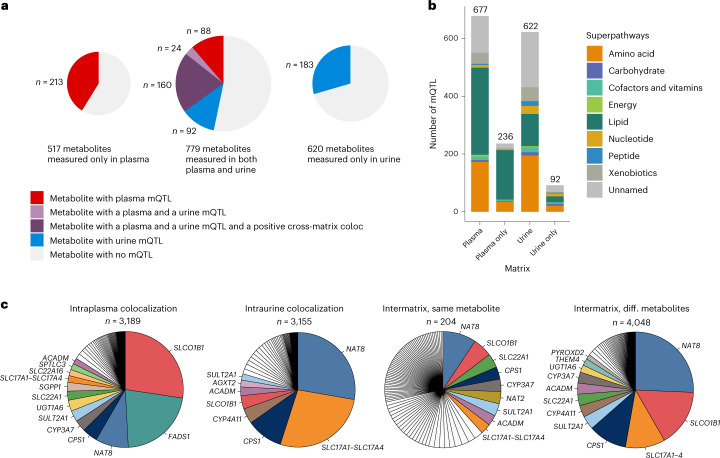
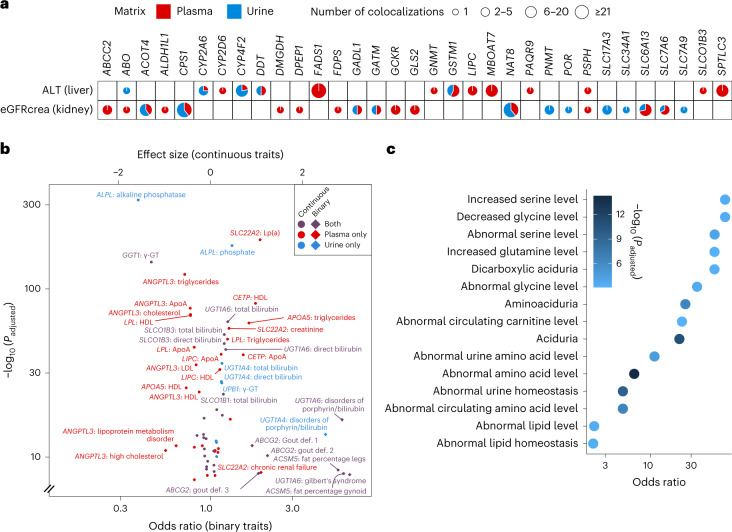
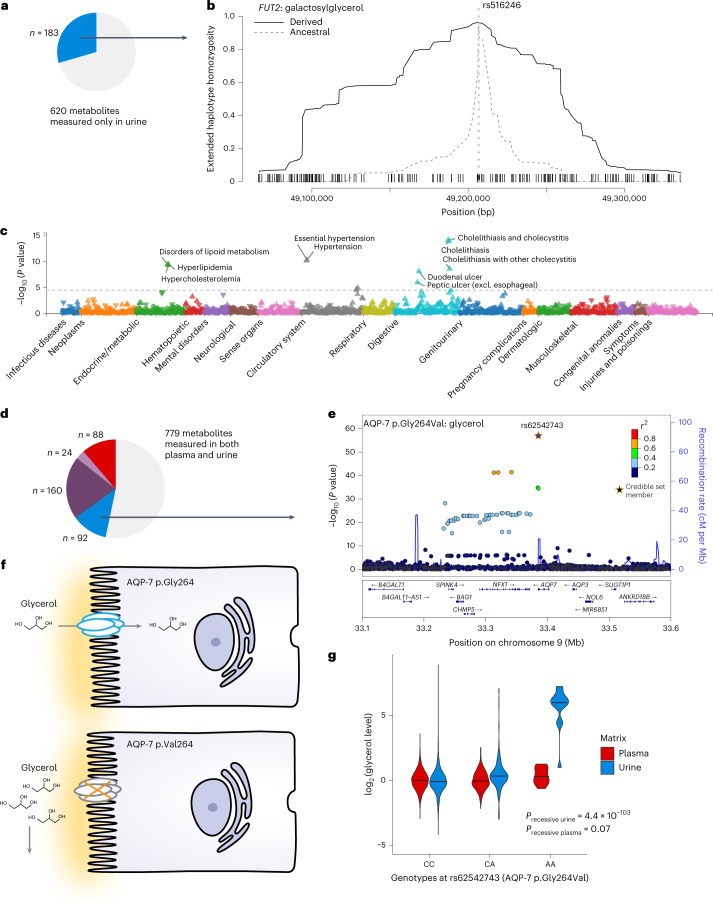
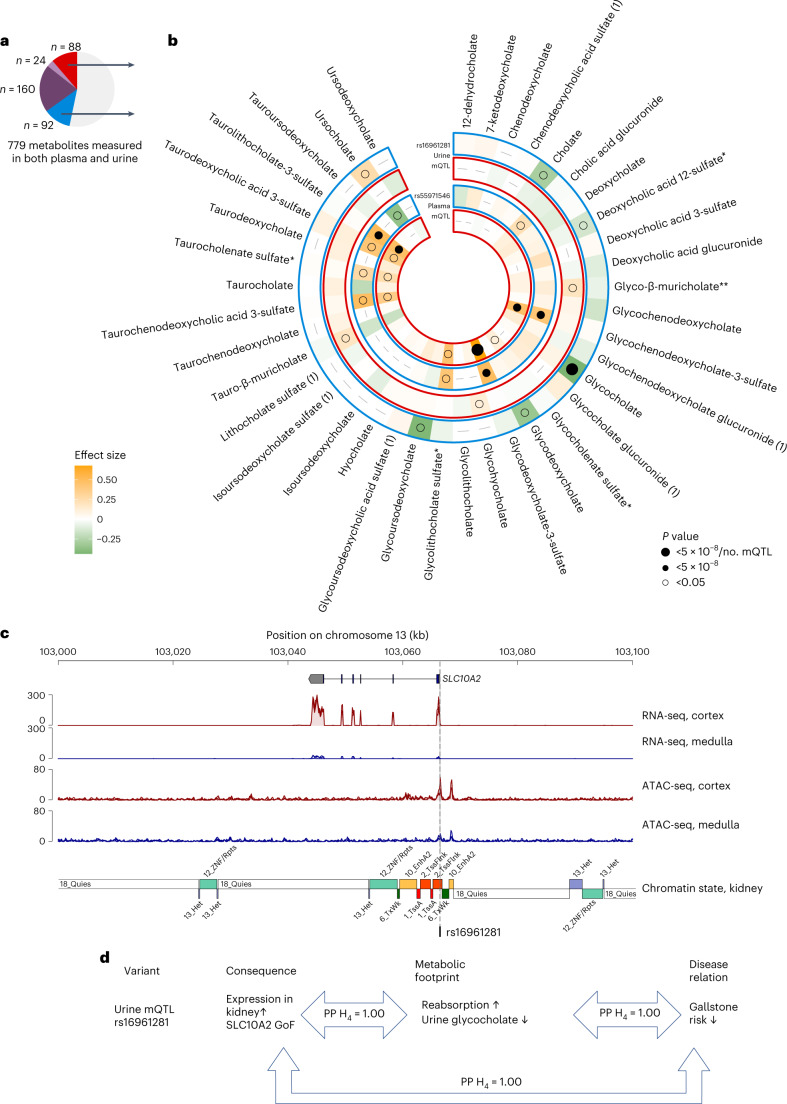
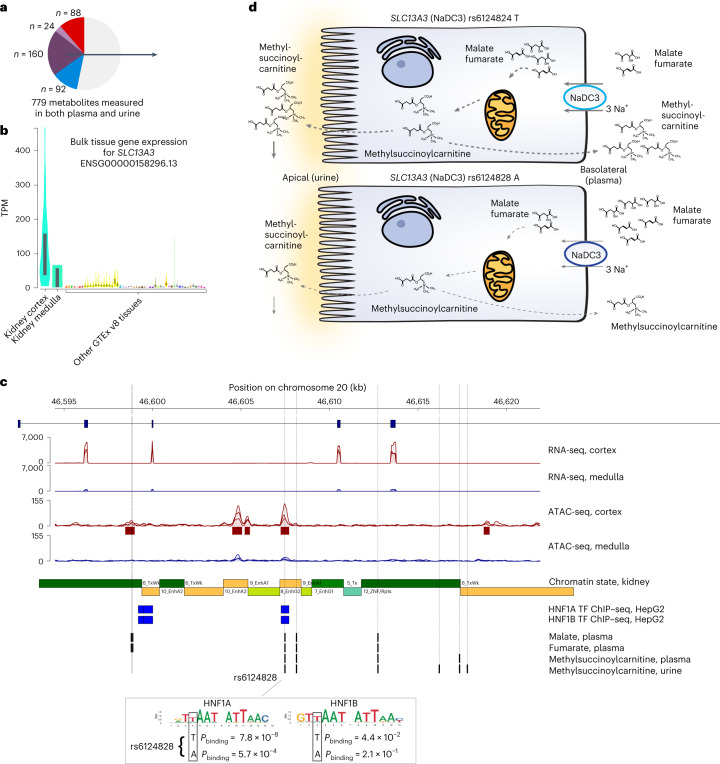
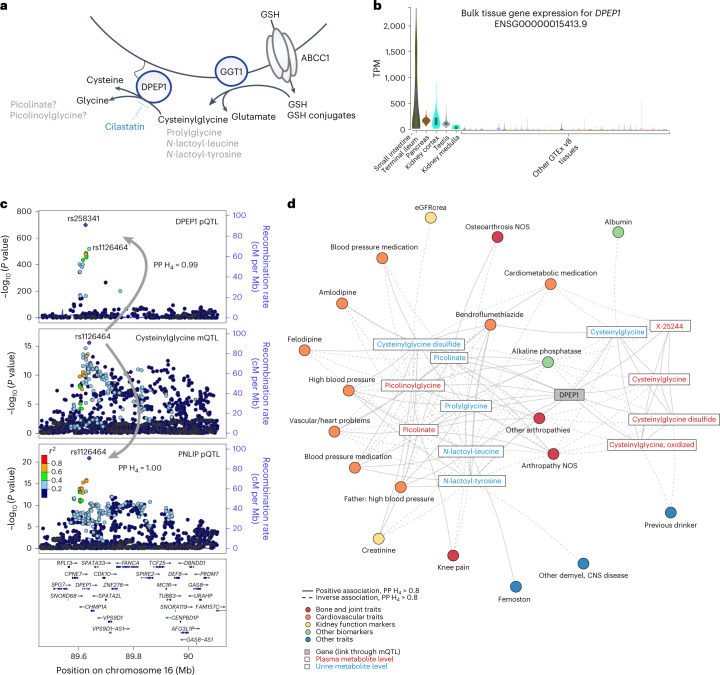
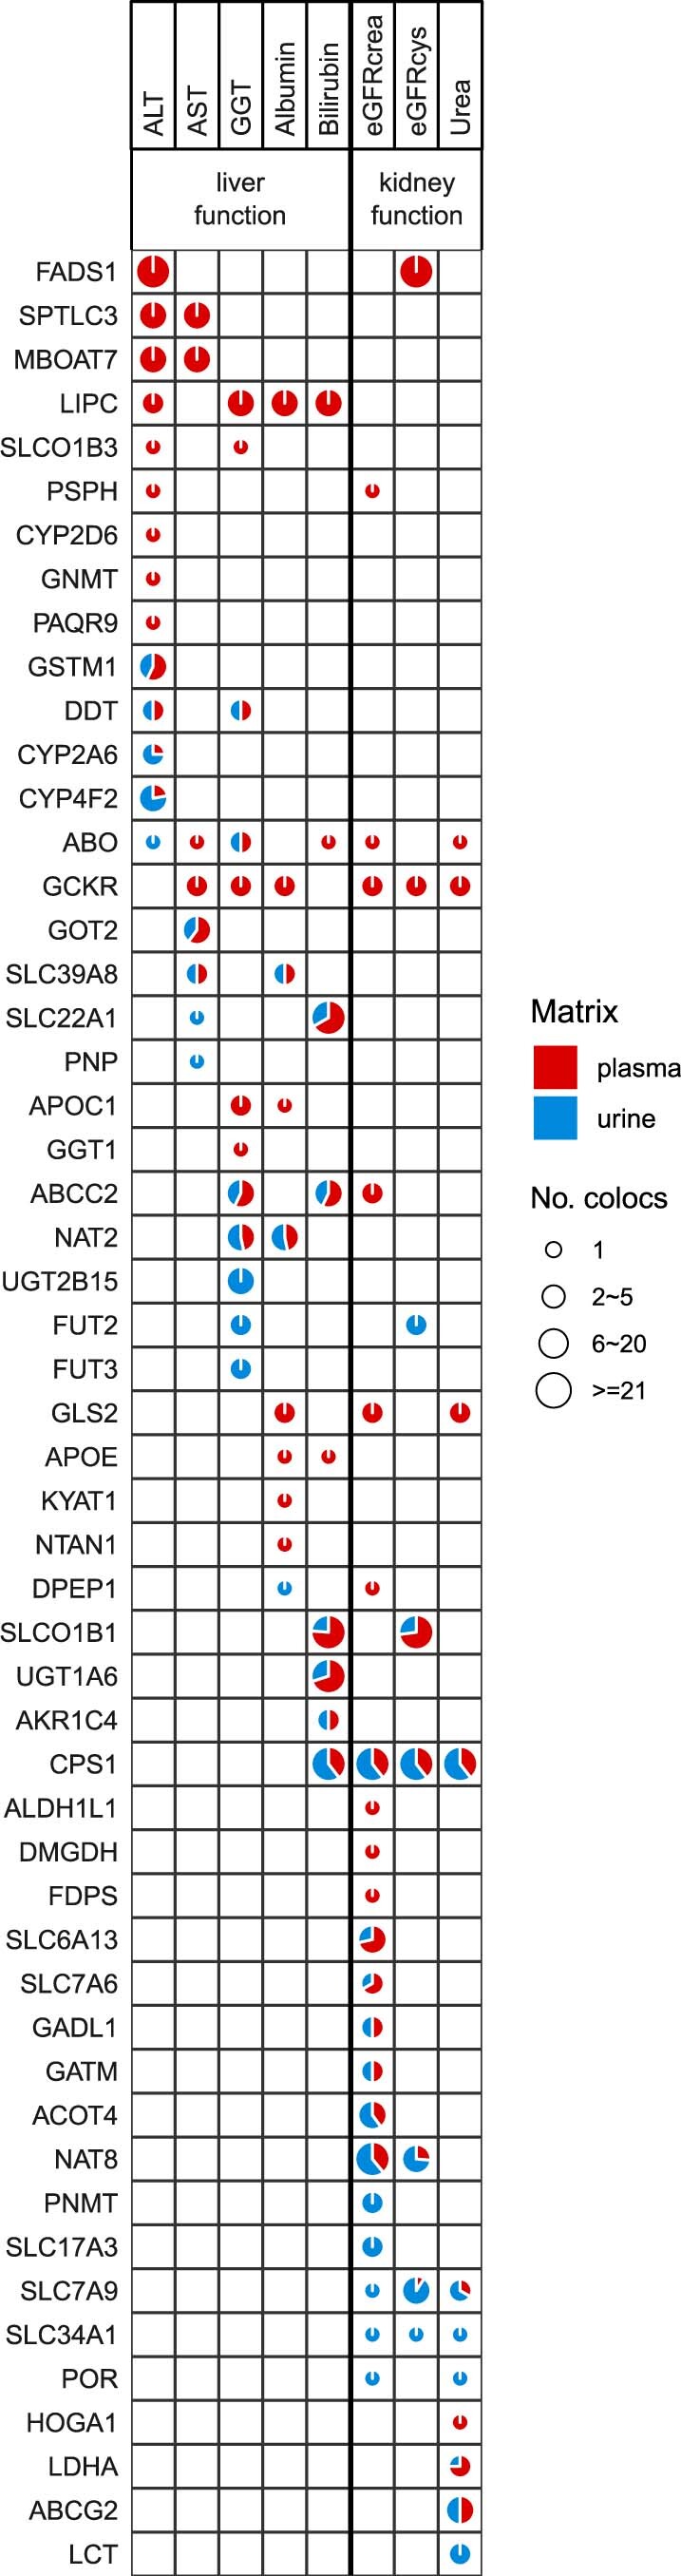
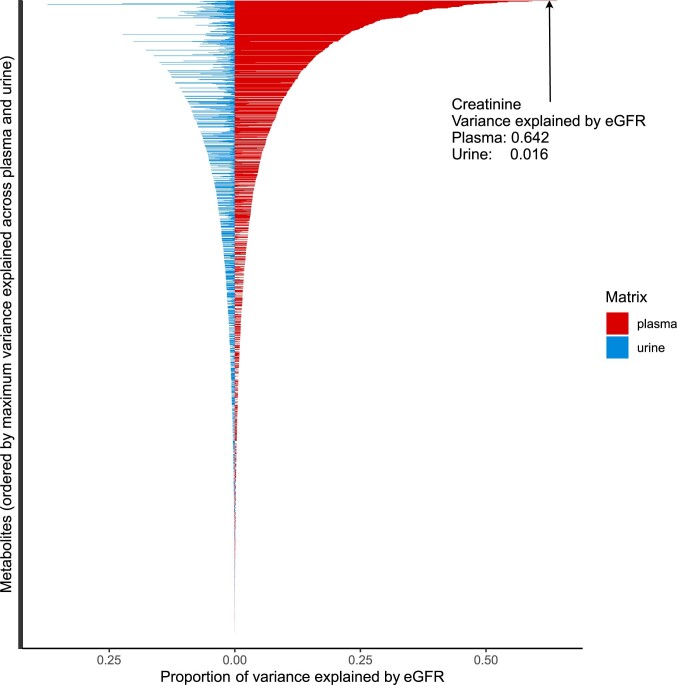
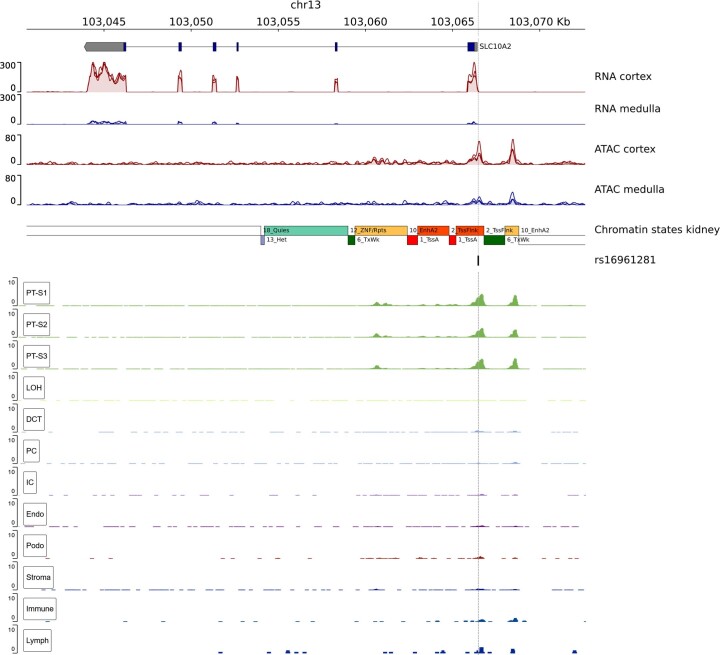
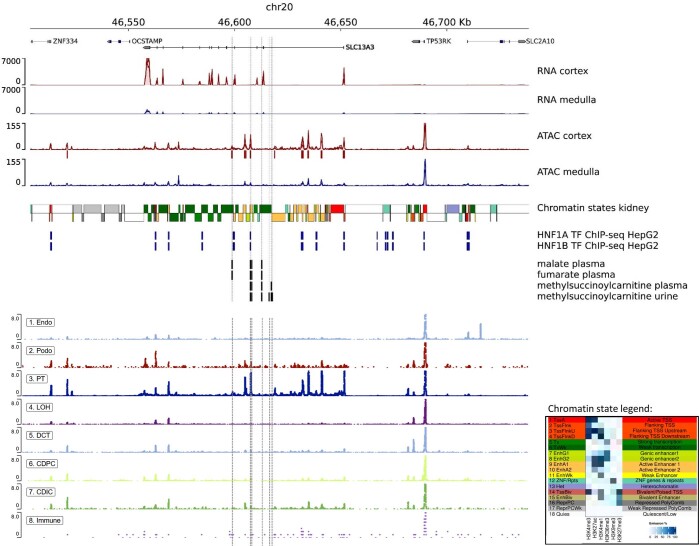
The kidneys operate at the interface of plasma and urine by clearing molecular waste products while retaining valuable solutes. Genetic studies of paired plasma and urine metabolomes may identify underlying processes. We conducted genome-wide studies of 1,916 plasma and urine metabolites and detected 1,299 significant associations. Associations with 40% of implicated metabolites would have been missed by studying plasma alone. We detected urine-specific findings that provide information about metabolite reabsorption in the kidney, such as aquaporin (AQP)-7-mediated glycerol transport, and different metabolomic footprints of kidney-expressed proteins in plasma and urine that are consistent with their localization and function, including the transporters NaDC3 (SLC13A3) and ASBT (SLC10A2). Shared genetic determinants of 7,073 metabolite-disease combinations represent a resource to better understand metabolic diseases and revealed connections of dipeptidase 1 with circulating digestive enzymes and with hypertension. Extending genetic studies of the metabolome beyond plasma yields unique insights into processes at the interface of body compartments.


Conflict of interest statement

R.P.M. and E.D.K. are employees of Metabolon and, as such, have affiliations or financial involvement with Metabolon. J.M. is an employee of Bayer. All other authors declare no competing interests.

Figures

Fig. 1
Fig. 1. Overview of the study design.
Schematic representation of the genome-wide screens for plasma and urine metabolite levels and their follow-up analyses. Analyses based on data from plasma are presented in red, analyses based on data from urine in blue, comparative analyses of results based on plasma and urine are shown in a red–blue gradient, and matrix-independent analyses are in white. Icon credit, Servier Medical Art by Servier (licensed under a Creative Commons Attribution 3.0 Unported License). HMGD, Human Gene Mutation Database; HPA, Human Protein Atlas; HRC, Haplotype Reference Consortium; v8, version 8.
Fig. 2
Fig. 2. Circular presentation of the 1,299 identified genetic associations with metabolite levels in plasma and urine.
The light red band shows the −log10 (P values) for genetic associations with metabolite levels in plasma by chromosomal position, and the light blue band shows the associations with metabolite levels in urine. Results from all 1,296 plasma and 1,401 urine GWAS traits are based on linear regressions and are overlaid in the respective bands, with P values truncated at 1 × 10−60. The horizontal lines (blue and red) indicate genome-wide significance (Pplasma = 3.9 × 10−11 and Purine = 3.6 × 10−11). Supplementary Table 3 contains details about index SNP associations (mQTLs). Gene labels for significant loci were assigned based on mQTL annotations, colocalization analysis with gene expression and protein levels, and literature research (Methods). Black gene labels indicate genetic regions identified in both plasma and urine with intermatrix colocalization (PP H4 > 0.8), gray labels indicate genetic regions identified in both plasma and urine without intermatrix colocalization, and red or blue labels indicate genetic regions exclusively identified in plasma or urine, respectively. The number of plasma and urine mQTLs annotated to a gene is given in parentheses (plasma, urine). The pie chart reflects the proportions of the 282 unique genes that were annotated as enzymes and transporters. Official gene symbols for PYCRL and ERO1L are PYCR3 and ERO1A, respectively.
Fig. 3
Fig. 3. Comparative analyses of mQTLs from plasma and urine.
a, Proportions and counts of metabolites with mQTL split by measurement matrix. b, mQTL annotation by metabolite superpathway for mQTLs identified in plasma, in urine and in plasma and urine only. mQTLs identified in plasma contained a higher proportion of lipids, whereas mQTLs identified in urine contained a higher proportion of unnamed molecules, peptides and nucleotides. c, Major genes underlying colocalizing association signals of metabolites in four different groups: intraplasma colocalizations (551 distinct mQTLs involved), intraurine colocalizations (497 distinct mQTLs involved), intermatrix colocalizations with the same metabolite (408 distinct mQTLs involved) and intermatrix colocalizations with different (diff.) metabolites (837 distinct mQTLs involved, distinguishing between mQTL in plasma and urine). For the smallest ‘intermatrix, same metabolite’ group, all genes assigned to >5 colocalizing regions are color coded and labeled. For the three other groups, all genes assigned to >50 colocalizing metabolite regions are color coded and labeled.
Fig. 4
Fig. 4. Association of mQTLs and implicated genes with clinical biomarkers, diseases and phenotypes in genetically manipulated mice.
a, Colocalization of mQTLs with clinical markers of kidney (eGFR) and liver (ALT) function. mQTLs are represented by the implicated genes on the x axis. The size of the pie represents the total number of colocalizations grouped into four categories. The slices in each pie colored in red and blue represent the proportion of colocalizations of plasma and urine mQTLs with the respective markers. b, Effect size (continuous traits) and odds ratio (binary traits) estimates from tests comparing carriers and noncarriers of rare, presumed deleterious mutations in a gene (Supplementary Table 15; gene-based testing; Methods). The matrix of the origin of mQTL-implicated genes is color coded (red, plasma; blue, urine; purple, both). ApoA, apolipoprotein A; γ-GT, gamma glutamyltransferase; HDL, high-density lipoprotein; LDL, low-density lipoprotein; Lp(a), lipoprotein A. c, Over-representation of the 282 genes identified in the mGWAS among phenotypes arising from genetically manipulated mice as part of the Mouse Genome Informatics resource. Only the 15 significant terms with the lowest P values are shown (Fisher’s exact test); a full list is found in Supplementary Table 20.
Fig. 5
Fig. 5. Urine-specific mQTLs deliver insights into systemic and kidney-specific processes.
a, The mQTLs highlighted in b,c belongs to the group arising from metabolites only measured in urine. b, The haplotype carrying the derived allele at the galactosylglycerol-associated mQTL at the FUT2 locus shows extended homozygosity as compared to the haplotype carrying the ancestral allele; the x axis represents the genomic coordinates (bp in build 37) around the tested SNP rs516246, the proxy for the index SNP rs679574 (r2 = 1); the y axis displays the extended haplotype homozygosity (EHH) statistic (Methods). The EHH around the derived allele is shown by the solid black line, whereas the one of the ancestral allele is shown by the gray dashed line. The dotted light gray line indicates the position of the tested SNP. Black dashes on the x axis represent the positions of SNPs that were used to compute the EHH statistic. c, Phenome-wide association study for rs516246 based on UK Biobank data (https://pheweb.org/UKB-TOPMed/variant/19:48702915-C-T). Excl., excluding. d, The mQTLs highlighted in eg belongs to the group of urine-specific mQTLs arising from metabolites measured in plasma and urine. e, Regional association plot of the GWAS of urine glycerol levels (linear regression) around the most likely gene, AQP7. The index variant rs62542743 is shown in purple. f, Schematic representation of a presumed loss-of-function effect of AQP-7 p.Gly264Val on tubular reuptake of glycerol. g, Distribution of the log2-transformed glycerol levels in plasma (red) and urine (blue) by genotype at rs62542743. The black line in the center of each violin represents the median of the data.
Fig. 6
Fig. 6. Plasma and urine implicate distinct causal variants and bile acid metabolites in the SLC10A2 locus.
a, The SLC10A2 locus contains two metabolite- and matrix-specific mQTLs. b, Systematic exploration of the effect of the urine mQTL rs16961281 (outer two bands) and the plasma mQTL rs55971546 (inner two bands) on levels of 39 bile acids quantified in plasma (red frames) and urine (blue frames) from their respective GWAS showed a urine-specific inverse association of the urine mQTL with glycocholate as well as other known substrates of the bile acid transporter encoded by SLC10A2 in urine but not in plasma. The plasma mQTL was positively associated with specific, sulfated bile acids in plasma, and this metabolomic footprint was propagated to urine likely via glomerular filtration. The direction and magnitude of the modeled minor alleles on bile acid levels is color coded; dot size corresponds to significance levels. c, RNA-seq shows that SLC10A2 expression is specific to the kidney cortex (plotted using pyGenomeTracks version 3.7). ATAC-seq highlights cortex-pronounced active chromatin that directly intersects with the fine-mapped urine mQTL rs16961281 (credible set size = 1), located in the 5′ untranslated region, flanking the active transcription start site (TSSFInk, chromatin state band). RNA-seq and ATAC-seq tracks are an overlay of signal from three different tissue donors; chromatin states were derived from histone ChIP–seq data (see Extended Data Fig. 9 for the chromatin state legend; Methods). d, The findings for the urine-specific mQTL suggest that urine is the appropriate matrix to detect the effect of a minor allele at a regulatory variant that increases expression of SLC10A2 in the kidney cortex, leading to lower urine levels of the ASBT substrate glycocholate through reabsorption, which translates into lower risk of gallstone disease. GoF, gain of function with respect to ASBT-mediated transport.
Fig. 7
Fig. 7. Primary human kidney tissue permits prioritization of causal variants in kidney-enriched genes implicated by mQTLs.
a, The locus highlighted in this figure contains an mQTL identified with both plasma and urine measurements of a metabolite. b, SLC13A3 transcript levels are particularly high in the kidney cortex and medulla among Genotype–Tissue Expression (GTEx) version 8 samples (nkidney cortex = 85, nkidney medulla = 4, nothers = 9–803; Methods). The dark bars in the violin plots mark the 25th and 75th percentiles. TPM, transcripts per million. c, RNA-seq shows that SLC13A3 is predominantly expressed in the kidney cortex. ATAC-seq highlights cortex-specific active chromatin around the rs6124828 index SNP, which was associated with malate, fumarate (both in plasma) and methylsuccinoylcarnitine (in plasma and urine). RNA-seq and ATAC-seq tracks are an overlay of signal from three different tissue samples (donors). Chromatin states derived from histone ChIP–seq data show an active enhancer state at the rs6124828 position (see Extended Data Fig. 9 for the chromatin state legend). The transcription factor (TF) motifs for HNF1A and HNF1B overlap rs6124828, and transcription factor ChIP–seq from HepG2 cells shows that the motifs are bound by both transcription factors. The minor A allele results in a higher predicted binding P value for HNF1A and HNF1B. d, Schematic representation of the effect of genotype at the mQTL rs6124828 on NaDC3-mediated metabolite transport and subsequent intracellular metabolism. Intermatrix colocalization of genetic associations with methylsuccinoylcarnitine suggests that its levels in urine may reflect filtration from plasma, but an exit at the apical membrane cannot be excluded.
Fig. 8
Fig. 8. DPEP1 influences plasma levels of major digestive enzymes.
a, Schematic representation of the role of DPEP1, encoded by DPEP1, and several other genes in glutathione (GSH) metabolism, highlighting identified metabolites and genes. ABCC1, ATP-binding cassette subfamily C member 1; GGT1, γ-glutamyltransferase 1. b, DPEP1 transcript levels are particularly high in the small intestine (terminal ileum), pancreas, kidney and testis among GTEx version 8 samples (nsmall intestine, terminal ileum = 187, npancreas = 328, nkidney cortex = 85, ntestis = 361, nkidney medulla = 4, nothers = 9–803; Methods). The dark bars in the violin plots mark the 25th and 75th percentiles. c, Regional association plots of association patterns at the DPEP1 locus (linear regression). SNPs are plotted by position (build 38) versus −log10 (association P values) of plasma DPEP1 levels (top; conditional independent protein quantitative trait locus (pQTL) statistics with the index SNP rs258341), urine cysteinylglycine (middle; mQTL) and plasma levels of the digestive enzyme pancreatic triacylglycerol lipase (PNLIP) (bottom; conditional independent pQTL statistics with the index SNP rs1126464). The purple diamond highlights the index SNP for each association. SNPs are color coded to reflect their LD with this SNP (pairwise European-ancestry r2 values from the 1000 Genomes Project phase 3). Genes, exons and the direction of transcription from the University of California at Santa Cruz Genome Browser are depicted. Plots were generated using LocusZoom. d, Network representation of metabolites with a DPEP1 mQTL as well as of all traits in the phenome-wide scan that are linked through positive colocalization for one of these. mQTLs are represented by the edge connecting the respective gene and metabolite, and all other edges are established through positive colocalization (PP H4 > 0.8), with color coding representing the phenotype category. Effect directions are indicated by the line type (solid, positive association; dashed, inverse association). CNS, central nervous system; NOS, not otherwise specified.
Extended Data Fig. 1
Extended Data Fig. 1. Evaluation of genetic associations of plasma mQTLs from CKD patients in a multi-ethnic, population-based sample.
Each point represents the index SNP of one of 459 (EA) and 430 (AA) associations that could be matched between the Metabolon platforms of the GCKD and ARIC studies (see Supplementary Table 6). Data are presented as effect size estimate +/- 1.96x standard errors in each study and the dot size is proportional to the two-sided -log10(P-value) in GCKD (NGCKD = 4960, NARIC EA = 3603, NARIC AA = 818).
Extended Data Fig. 2
Extended Data Fig. 2. Comparison of the heritability for 184 matched plasma and urine metabolites with at least one mQTL.
The positive correlation between the estimated heritabilities for a given metabolite’s plasma and urine levels is consistent with the metabolites’ filtration from plasma to urine, without substantial additional genetic influences on their tubular handling. The blue line is the linear regression line and the gray shaded area represents the 95%-confidence interval. Differences in estimated heritability for plasma and urine (instances with >25% are labeled with the associated metabolite and most likely gene; error bars represent h2 variance) can contain interesting biological information: for example, three metabolites with larger estimated heritabilities in urine than in plasma are N-acetylated amino acids, all of which have an mQTL at NAT8. NAT8 is highly and selectively expressed in the kidney, where the encoded enzyme N-acetylates molecules to make them water soluble for subsequent excretion.
Extended Data Fig. 3
Extended Data Fig. 3. Post-hoc power analyses for plasma and urine mQTLs by metabolite super-pathway.
Power analyses are based on a sample size of 5,000, the genome-wide statistical significance thresholds used in our study, and are conducted across a range of minor allele frequencies. For each matrix-super-pathway subgroup, the median observed effect size across mQTLs as well as the median standard deviation of the metabolites with an mQTL within the group were used.
Extended Data Fig. 4
Extended Data Fig. 4. Comparison of direction of genetic associations and explained variance at inter-matrix mQTLs.
Comparison of effect sizes and explained variance for colocalization signals for mQTLs detected for the same metabolite in both plasma and urine (N = 204; only the 99 mQTLs for which the explained variance in metabolite levels in at least one of both matrices is >3% are shown). The two inner bands represent the effect size of the mQTL in plasma (framed in red) and urine (framed in blue). Shades of orange indicate positive effect sizes, shades of aquamarine negative ones. The two outer bands represent the variance in metabolite levels in plasma and urine explained by the index SNP of the corresponding mQTL, where a darker shade of green corresponds to a greater explained variance.
Extended Data Fig. 5
Extended Data Fig. 5. Colocalization of mQTLs with selected clinical markers of kidney and liver function.
The mQTLs are represented by the implicated genes on the rows and the colocalized clinical markers are on the columns. Liver function markers include alanine aminotransferase (ALT), aspartate aminotransferase (AST), gamma glutamyltransferase (GGT), albumin and bilirubin. Kidney function markers include eGFRcrea, eGFRcys and urea. The size of pie represents the total number of colocalizations grouped into four categories. The slices in each pie colored in red and blue represent the proportion of colocalizations of plasma and urine mQTLs with the respective clinical markers.
Extended Data Fig. 6
Extended Data Fig. 6. Proportion of metabolite variance explained by eGFR.
The proportion of a metabolite’s variance explained by eGFR is represented on the x-axis. All metabolites quantified from plasma and urine are shown along the y-axis, ordered by the maximum variance explained across plasma (red color) and urine (blue color). The metabolite with the largest amount of variance explained by eGFR was plasma creatinine.
Extended Data Fig. 7
Extended Data Fig. 7. Enrichment of mQTL-related genes among GO terms, KEGG pathways, tissues, and cell types.
(a) Similarities and differences between terms and pathways enriched for genes identified by all plasma vs. all urine mQTLs; (b) mQTLs exclusively identified in plasma and urine; (c) between tissues enriched for genes identified by all plasma vs. all urine mQTLs, and (d) between cell types enriched for genes identified by all plasma vs. all urine mQTLs. Terms significantly (adjusted P-value < 0.05) enriched for genes identified by mQTLs from only one matrix are colored in red and blue respectively and terms significantly enriched for genes from both matrices are colored in purple. OR: odds ratio.
Extended Data Fig. 8
Extended Data Fig. 8. Extended view of the SLC10A2 region.
The upper part of the figure shows the same RNA-seq, ATAC-seq, chromatin state and histone ChIP-seq tracks as Fig. 6. The RNA-seq and ATAC-seq tracks show the overlayed signal from tissue of three different donors. The index SNP rs16961281, that is associated with urine glycocholate, is located at the vertical dashed line. The bottom part shows publicly available single nucleus (sn)ATAC-seq data for different kidney cell types, which was derived from primary human kidney samples. The position of rs16961281 is nearly exclusively accessible in cells of all proximal tubule segments (PT-S1, PT-S2, PT-S3). PTs are the predominant cell type in kidney cortex, underscoring the consistency of the snATAC-seq data and the bulk ATAC-seq data. Other cell types shown include: Endothelial cells (Endo), podocytes (Podo), loop of Henle cells (LOH), distal convoluted tubule cells (DCT), collecting duct principal cells (PC), collecting duct intercalated cells (IC), stroma cells (Stroma), immune cells (Immune), lymph cells (Lymph).
Extended Data Fig. 9
Extended Data Fig. 9. Extended view of the SLC13A3 region.
The upper part of the figure shows the same RNA-seq, ATAC-seq, chromatin state and histone ChIP-seq tracks as Fig. 7. The index SNP rs6124828, that is associated with malate, fumarate, and methylsuccinoylcarnitine in plasma as well as with methylsuccinoylcarnitine in urine is located at the second vertical dashed line from the left. The bottom part shows single nucleus (sn)ATAC-seq data for different kidney cell types, which was derived from primary human kidney samples. The position of rs6124828 is nearly exclusively accessible in proximal tubule cells (PT). PTs are the predominant cell type in the kidney cortex, underscoring the consistency of the snATAC-seq data and the bulk ATAC-seq data. Other cell types shown include: Endothelial cells (Endo), podocytes (Podo), loop of Henle cells (LOH), distal convoluted tubule cells (DCT), collecting duct principal cells (CDPC), collecting duct intercalated cells (CDIC), immune cells (Immune).

References

    1. Boron, W. F. & Boulpaep, E. L. Medical Physiology (Elsevier, 2017).
    1. Gyimesi G, Pujol-Gimenez J, Kanai Y, Hediger MA. Sodium-coupled glucose transport, the SLC5 family, and therapeutically relevant inhibitors: from molecular discovery to clinical application. Pflugers Arch. 2020;472:1177–1206. - PMC - PubMed
    1. Anzai N, Endou H. Urate transporters: an evolving field. Semin. Nephrol. 2011;31:400–409. - PubMed
    1. Evans AM, et al. High resolution mass spectrometry improves data quantity and quality as compared to unit mass resolution mass spectrometry in high-throughput profiling metabolomics. Metabolomics. 2014;4:132.
    1. Schlosser P, et al. Genetic studies of urinary metabolites illuminate mechanisms of detoxification and excretion in humans. Nat. Genet. 2020;52:167–176. - PMC - PubMed

Publication types