. 2023 Jul;24(7):1200-1210.
doi: 10.1038/s41590-023-01527-9. Epub 2023 Jun 5.

Drivers of heterogeneity in synovial fibroblasts in rheumatoid arthritis

Affiliations

Drivers of heterogeneity in synovial fibroblasts in rheumatoid arthritis

Melanie H Smith et al. Nat Immunol. 2023 Jul.

Abstract

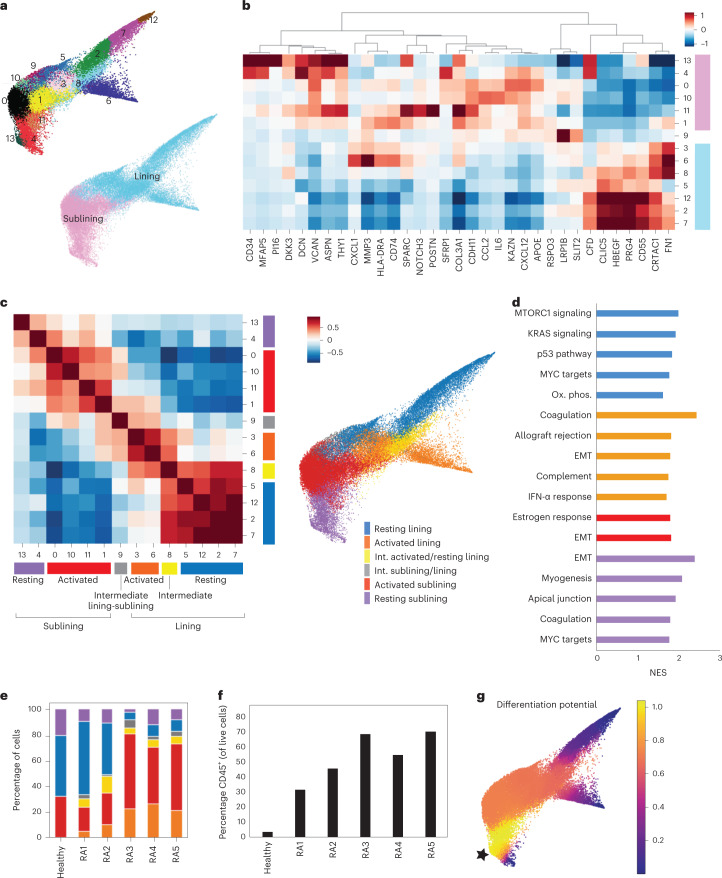
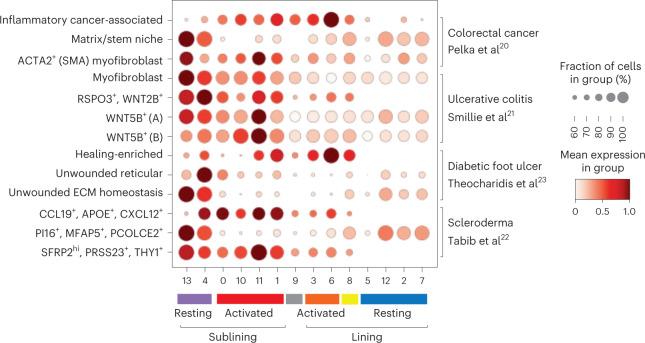
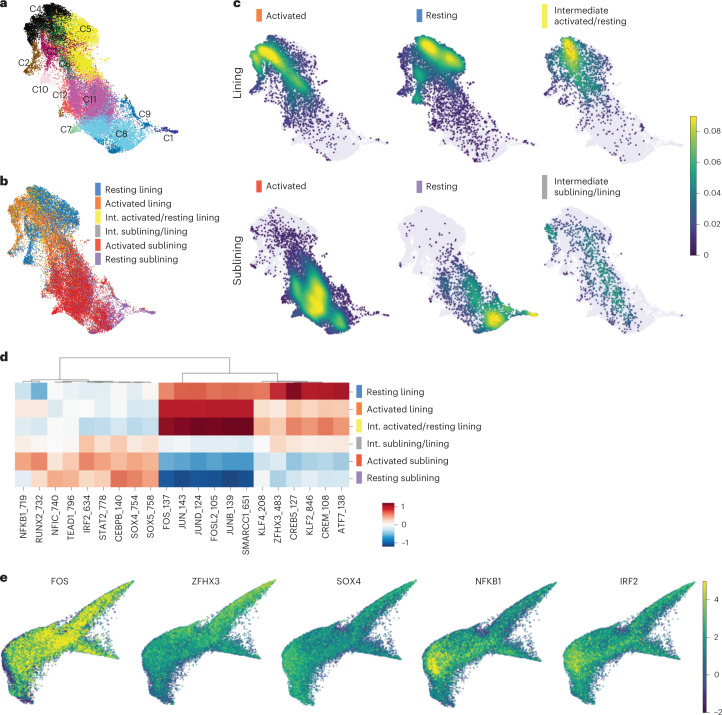
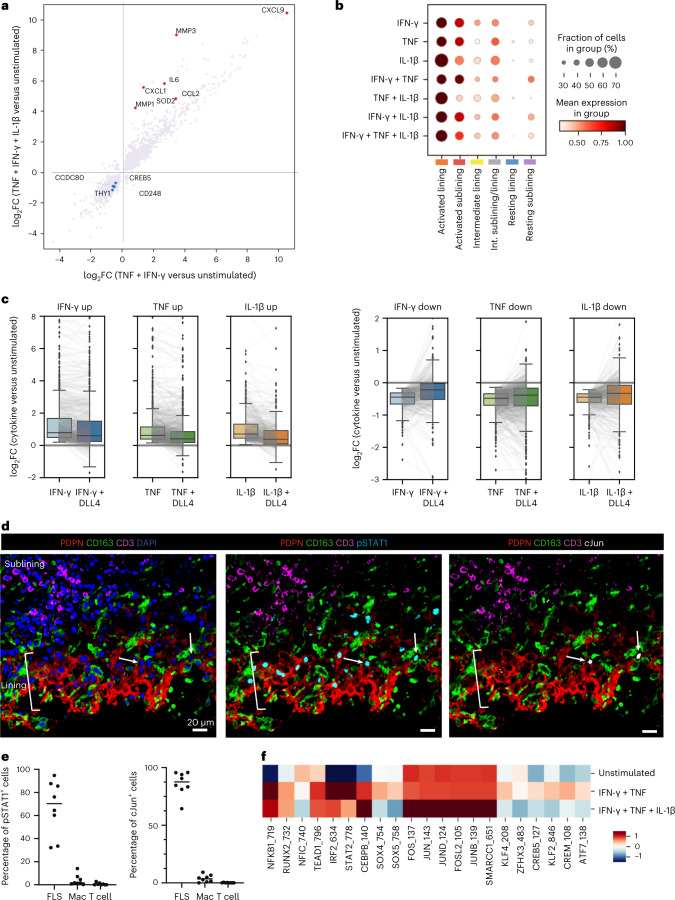
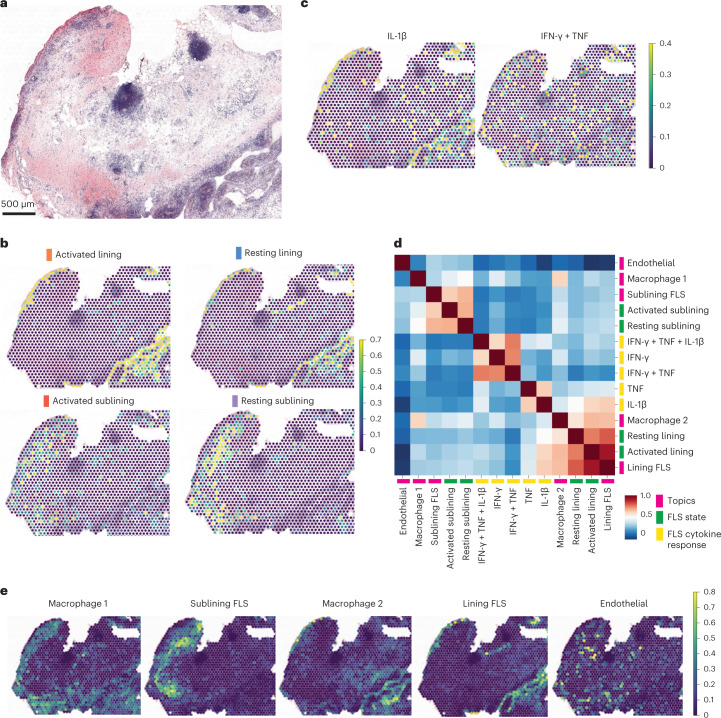
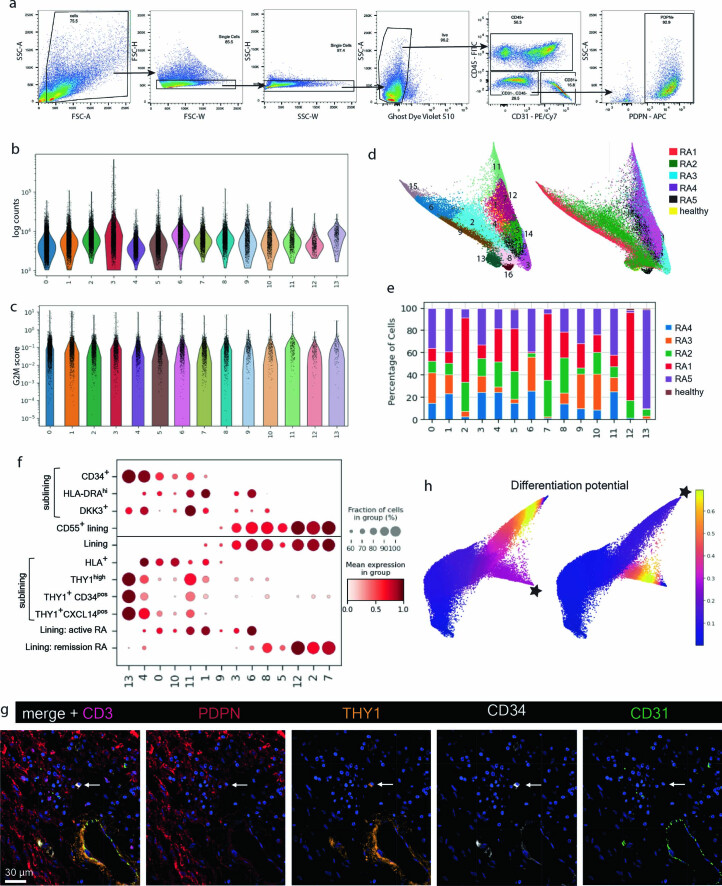
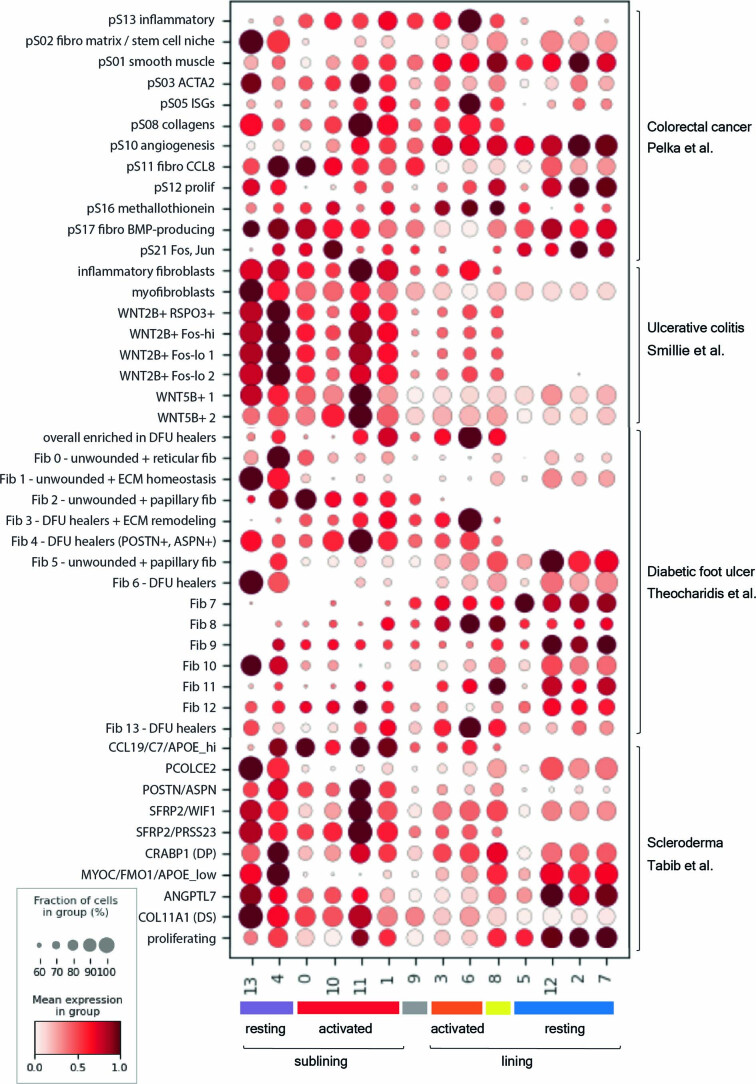
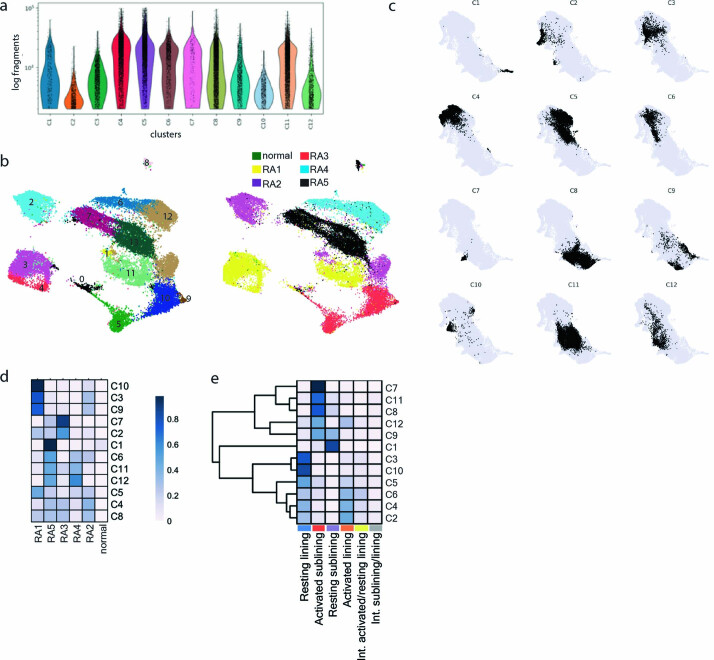
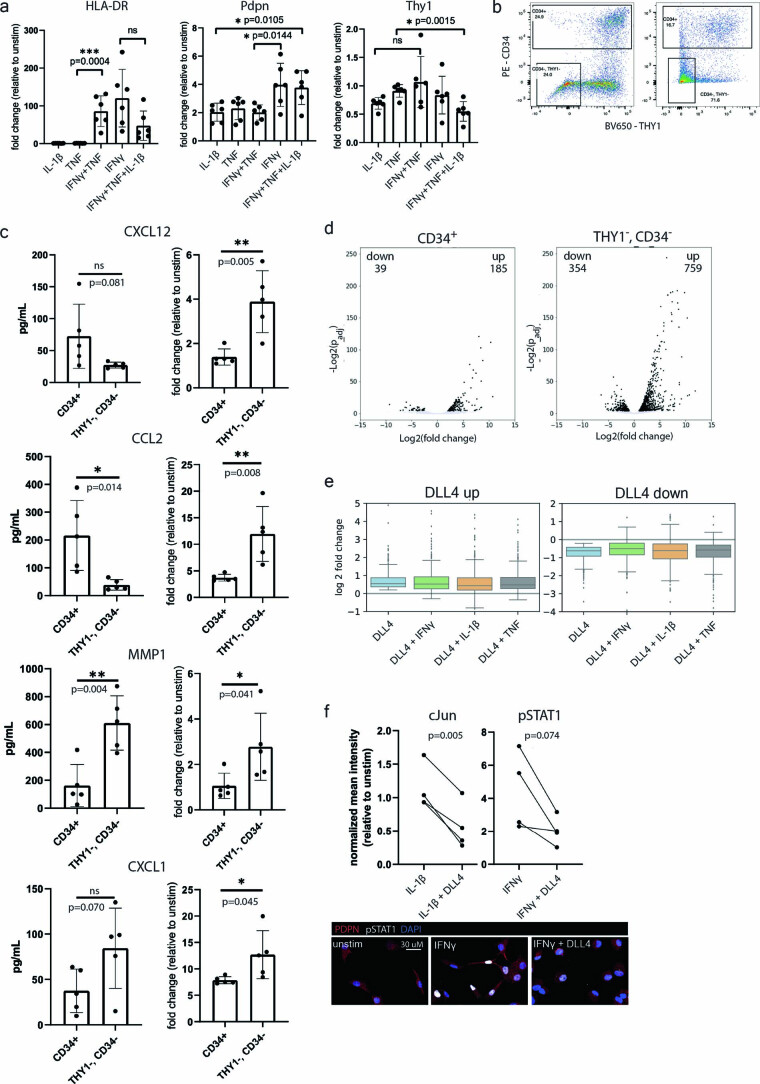
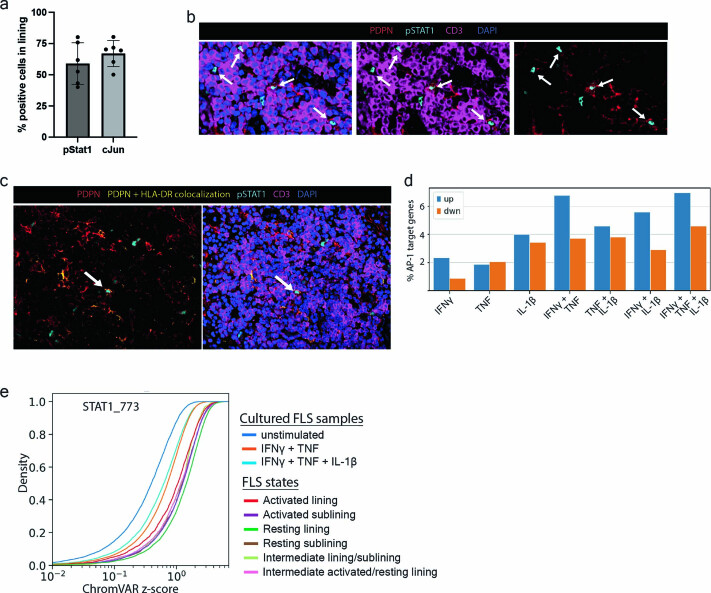
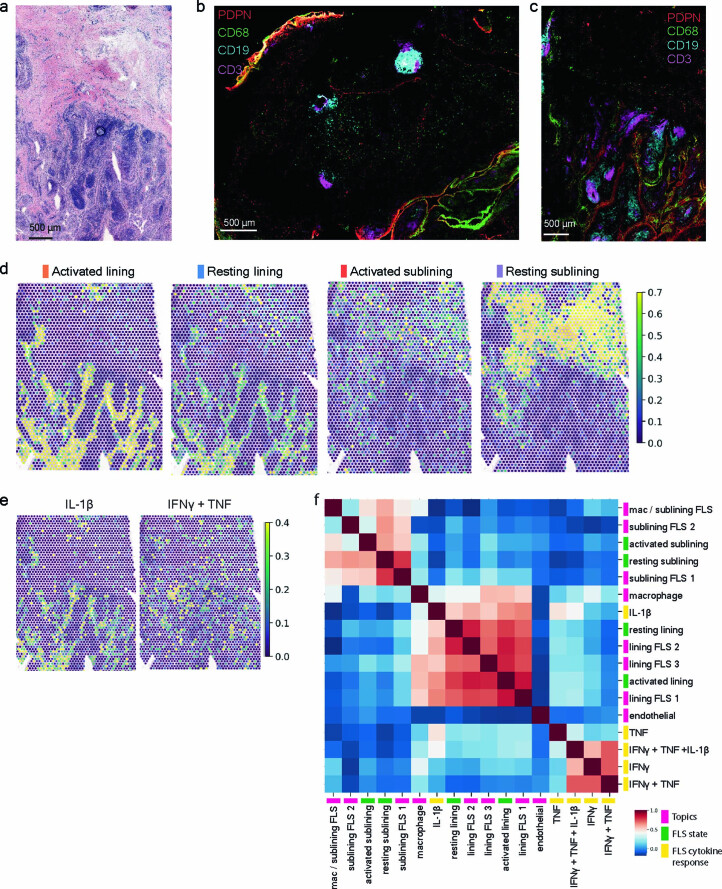
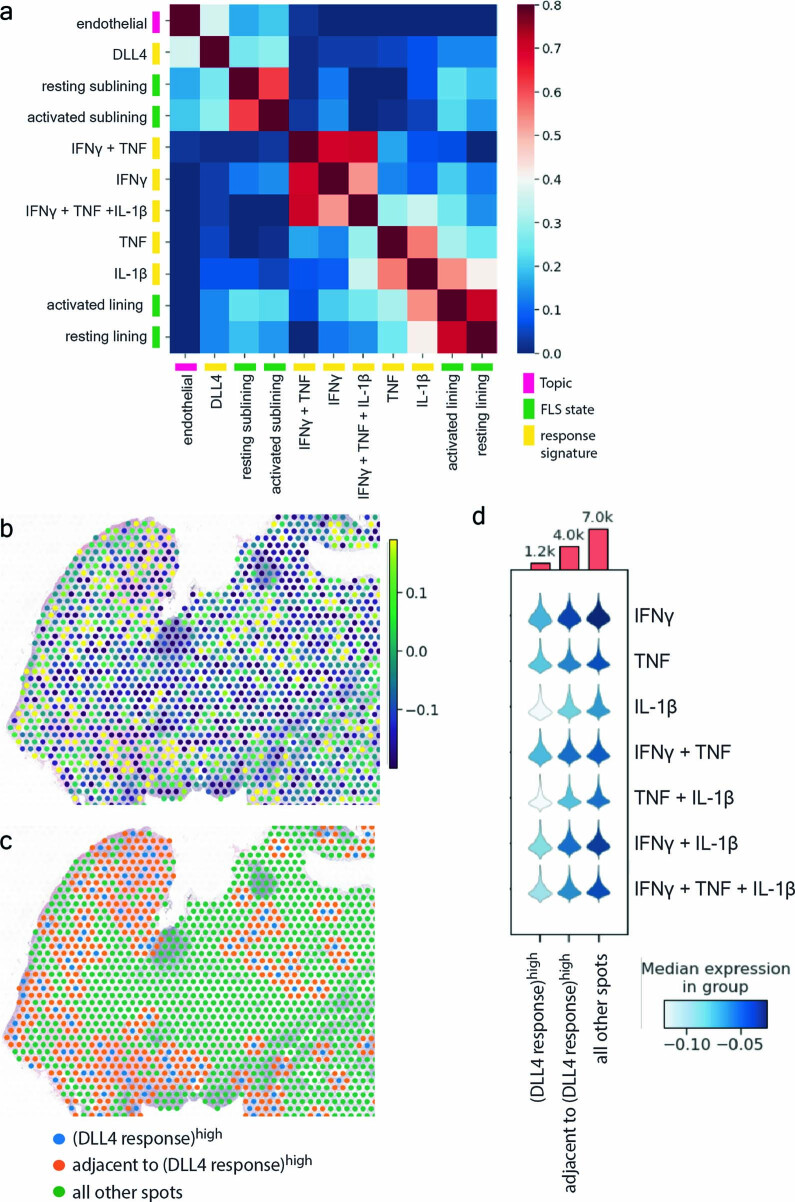
Inflammation of non-barrier immunologically quiescent tissues is associated with a massive influx of blood-borne innate and adaptive immune cells. Cues from the latter are likely to alter and expand activated states of the resident cells. However, local communications between immigrant and resident cell types in human inflammatory disease remain poorly understood. Here, we explored drivers of fibroblast-like synoviocyte (FLS) heterogeneity in inflamed joints of patients with rheumatoid arthritis using paired single-cell RNA and ATAC sequencing, multiplexed imaging and spatial transcriptomics along with in vitro modeling of cell-extrinsic factor signaling. These analyses suggest that local exposures to myeloid and T cell-derived cytokines, TNF, IFN-γ, IL-1β or lack thereof, drive four distinct FLS states some of which closely resemble fibroblast states in other disease-affected tissues including skin and colon. Our results highlight a role for concurrent, spatially distributed cytokine signaling within the inflamed synovium.


Conflict of interest statement

A.Y.R. is an SAB member and has equity in Sonoma Biotherapeutics, Santa Ana Bio, RAPT Therapeutics and Vedanta Biosciences. He is an SEB member of Amgen and BioInvent and is a co-inventor or has IP licensed to Takeda that is unrelated to the content of the present study. S.M.G. consults for UCB and has research support from Novartis both of which are unrelated to the present study. The remaining authors declare no competing interests.

Figures

Fig. 1
Fig. 1. FLS states in the RA synovium exhibit evidence of activation by immune cells.
a, Force-directed layout of 14 FLS clusters identified by scRNA-seq analysis with Harmony batch correction with corresponding annotations of synovial localization. b, Heat map of selected differentially expressed genes (DEGs) for each cluster colored by synovial localization. c, Cluster-by-cluster correlation of the mean expression of highly variable genes in clusters from a with defined FLS states colored on the force-directed layout. d, GSEA showing top HALLMARK pathways with false discovery rate (FDR) < 0.1 (up to 5) for each of the states defined in c. EMT, epithelial–mesenchymal transition; NES, normalized enrichment score. e, Percent FLS in each state defined in c for each synovial tissue sample. f, Percent CD45+ cells in each of the dissociated synovial tissue samples by flow cytometry. g, Trajectory analysis using Palantir starting from a sublining cell from the healthy synovial sample (starting point marked with a star).
Fig. 2
Fig. 2. Shared functional gene expression programs in FLS and non-synovial fibroblasts across tissues and diseases.
Dot-plot showing relative expression of selected gene signatures from published tissue fibroblast populations in FLS clusters colored according to FLS states.
Fig. 3
Fig. 3. Chromatin accessibility analysis of FLS states reveals their distinct transcriptional regulation.
a, UMAP of 12 FLS clusters identified by tile-based scATAC-seq analysis after Harmony batch correction. b, Annotations of FLS states on the scATAC-seq UMAP. c, Projection of FLS states onto scATAC-seq UMAP. d, Heat map with top-six differentially accessible TF motifs identified by ChromVAR for each FLS state. Motifs filtered to include only those for which the corresponding TF was expressed by >20% of cells in the corresponding state. e, ChromVAR z scores projected onto scRNA-seq force-directed layout for a selection of top differentially accessible TF motifs derived from each FLS state.
Fig. 4
Fig. 4. Cytokine signaling drives transcriptional FLS heterogeneity.
a, Changes in gene expression (log fold change) after combinatorial stimulation of cultured FLS by the cytokines indicated. Red and blue dots highlight upregulated and downregulated genes, respectively. b, Dot-plot showing relative expression of the identified cytokine response signatures in each of the FLS states. c, Effect of Notch signaling on FLS cytokine responses. Cultured FLS were treated with the individual cytokines indicated in vitro and RNA-seq was used to identify genes that were upregulated (left) or downregulated (right). Box plots compare the distribution of log2 fold changes in the expression of these genes (in stimulated versus control) in FLS treated with each cytokine alone or in combination with DLL4. Gray lines connect individual genes across conditions. Boxes show lower and upper quartiles of the data with a line marking the median. Whiskers indicate extent of data, capped at 1.5 times the interquartile range, outside of which points are marked as outliers (ticks). d, Representative confocal images of staining for pSTAT1 (cyan), cJun (white), PDPN (red), CD163 (green), CD3 (magenta) and nuclear marker (blue) (n = 4 tissues with total of eight sections). White arrows indicate FLS with nuclear cJun staining in the lining. e, Percentage of cells staining for nuclear pSTAT1 or cJun annotated as FLS, macrophage (Mac) or T cell as identified by cell markers PDPN (FLS), CD163 (macrophage) and CD3 (T cell) in confocal images from d. f, ChromVAR z score of motifs from Fig. 3d in cultured FLS that were unstimulated, simulated with TNF and IFN-γ or stimulated with TNF, IFN-γ and IL-1β. Source data
Fig. 5
Fig. 5. Cytokine signaling is spatially constrained and correlated with cellular localization.
a, H&E staining of a tissue section used for ST (RA3 in Supplementary Table 1) (n = 2 tissues for ST; other tissue shown in Extended Data Fig. 6). b, Relative expression of FLS states in each RNA capture area on the ST slide. c, Relative expression of selected FLS cytokine response signatures in each RNA capture area on the ST slide. d, Correlation between FLS state gene signatures derived from scRNA-seq data, in vitro cytokine response gene signatures and cell types as defined by topic modeling within individual RNA capture spots for RA3. e, Expression of cell type-specific topics from d in each RNA capture area on the ST slide.
Extended Data Fig. 1
Extended Data Fig. 1. scRNA-seq analysis of FLS isolated from RA synovium.
a, Gating strategy for FACS sorting of FLS to exclude PDPN- mural cells. Numbers below population are percentage of parent population. b, Numbers of UMI counts per cluster. c, Cell cycle G2M score per cluster. d, Force directed layout without batch correction colored by cluster (left) and patient (right). e, Cluster composition by patient after Harmony batch correction. f, Dotplot showing the relative per cluster expression of previously published cluster-derived gene signatures: Zhang et al2 above and Alivernini et al4 below horizontal line. g, Representative confocal image of PDPN (red), THY1 (orange), CD34 (white), CD31 (green), CD3 (magenta) and nuclear marker (blue) from RA synovial tissue (n = 4 tissues). White arrow indicates individual CD34+ THY1+PDPNlowCD31 cell. h, Trajectory analysis using Palantir starting from cells in either the activated (left) or resting (right) lining states (starting point marked with a star).
Extended Data Fig. 2
Extended Data Fig. 2. Expression of non-synovial fibroblast gene signatures in FLS.
Dot plot showing relative expression of all gene signatures from published tissue fibroblast populations20–23 in FLS clusters colored according to FLS states. Abbreviations: ISG: interferon- stimulated genes; DFU: diabetic foot ulcers; ECM: extracellular matrix; DP: dermal papilla; DS: dermal sheath.
Extended Data Fig. 3
Extended Data Fig. 3. Paired scATAC-seq analysis of isolated FLS.
a, Number of fragments detected in each scATAC-seq cluster from Fig. 3a. b, scATAC-seq UMAP without batch correction colored by clusters (left) and patients (right). c, Individual scATAC-seq clusters imposed on scATAC-seq UMAP after Harmony batch correction. d, Contribution of each patient to scATAC-seq clusters. e, scATAC-seq cluster composition by FLS states.
Extended Data Fig. 4
Extended Data Fig. 4. Effects of cytokine and Notch signaling on FLS.
a, Surface protein expression of HLA-DR, PDPN and Thy1 on cultured FLS as measured by flow cytometry (mean fluorescence intensity) after indicated stimuli relative to unstimulated FLS (n = 6: FLS isolated from 6 different tissues and assayed independently). Error bars: mean ± standard deviation. Statistical comparisons made via unpaired t-test with two-tailed p-value. b, Two representative flow cytometry plots from tissues with different population distributions showing gating strategy for FACS sorting of CD34+ and THY1-CD34- FLS used following the gating strategy shown in Extended Data Fig. 1a. c, Expression of soluble proteins by CD34+ sublining or THY1-CD34- lining FLS directly sorted from dissociated synovium and cultured for 24 h either without stimulation (left) or with TNF, IFNγ and IL-1β (right) (n = 5 tissues). Error bars: mean ± standard deviation. Statistical comparisons made via unpaired t-test with two-tailed p-value. d, Changes in gene expression by bulk RNA-seq in sorted CD34+ sublining or THY1-CD34- lining FLS stimulated with TNF, IFNγ and IL-1β relative to unstimulated controls (n = 2 of tissues used in panel c). Differentially expressed genes were determined using DEseq2 with cutoff at p < 0.05 and absolute log2FC > 1. e, Effect of the cytokine simulation in combination with DLL4 on genes induced or downregulated by FLS treatment with DLL4 alone. Box plots compare the distribution of log2 fold changes in the expression of these genes (in stimulated versus control) in FLS treated with DLL4 alone or in combination with cytokine. Boxes show lower and upper quartiles of the data with line marking the median. Whiskers indicate extent of data, capped at 1.5 times the interquartile range, outside of which points are marked as outliers (ticks). f, Effect of Notch signaling on transcription factor activation in cultured FLS as measured by IF. Mean normalized intensity of nuclear cJun or pSTAT1 after simulation with IL-1β or IFNγ, respectively, with or without DLL4 relative to unstimulated (n = FLS from 4 tissues). Statistical comparisons made via paired t-test with two- tailed p-value. Below: representative confocal images of cultured FLS stimulated with IFNγ with or without DLL4 and stained for pSTAT1 (cyan), PDPN (red) and nuclear marker (blue). Source data
Extended Data Fig. 5
Extended Data Fig. 5. Evidence of STAT1 and AP-1 activation in FLS.
a, Percentage of cells staining for nuclear pSTAT1 or cJun found within the synovial lining, which was manually annotated based on tissue architecture, in confocal images from Fig. 4d (n = 3 tissues, 6 sections). Error bars: mean ± standard deviation. b, Representative confocal images of a lymphocyte aggregate within the sublining stained for phosphorylated STAT1 (cyan), PDPN (red), CD3 (magenta) and nuclear marker (blue) (n = 4 tissues, 8 sections). White arrows indicate FLS with nuclear pSTAT1. c, Representative confocal images of a lymphocyte aggregate stained for the antigens in (b) above as well as the colocalization of HLA-DR and PDPN (yellow) as defined by pixels with fluorescence intensity in the top 10% for both HLA-DR and PDPN (n = 3 tissues). d, Percent of genes identified in the multiome dataset with accessible AP-1 motifs in their promoters that were up- or down-regulated in cultured FLS stimulated with the indicated cytokines. AP-1 target genes (1024 total) in the activated lining FLS state were identified as those with motif matches with a log-odds score of at least 10 (computed by motifmatchr). e, Dynamics of chromatin accessibility of the STAT1 motif containing cis-regulatory elements across ex vivo FLS states and in vitro cytokine stimulated or unstimulated FLS. Empirical cumulative distribution function (ECDF) 600 plots of ChromVAR z-scores for STAT1 motif from scATAC-seq analysis of the indicated cultured FLS samples or FLS states are shown. Source data
Extended Data Fig. 6
Extended Data Fig. 6. Spatial transcriptomic analysis of inflamed RA synovial tissue.
a, H&E staining of second tissue section used for ST (RA6 in Supplementary Table 1) (n = 2 tissues for ST). b, c, IF images of serial tissue sections directly adjacent to those used for ST analysis for RA3 (b) and RA6 (c) stained for PDPN (red), CD68 (green), CD19 (cyan) and CD3 (magenta). (n = 2 tissues, 4 sections adjacent to those used for ST). d, Relative expression of gene signatures of FLS states in each RNA capture area on the ST slide. e, Relative expression of selected FLS cytokine response gene signatures in each RNA capture area on the ST slide. f, Correlation between FLS state gene signatures derived from scRNA-seq data, in vitro cytokine response gene signatures (select ones shown in e) and cell types as defined by topic modeling within individual RNA capture spots for RA6.
Extended Data Fig. 7
Extended Data Fig. 7. Spatial distribution of Notch signaling in FLS.
a, Correlation between localization of endothelial cells (defined by topic modeling), FLS state gene signatures derived from scRNA-seq data and in vitro cytokine or DLL4 response gene signatures within individual RNA capture spots (n = 2 sections for patient RA3 in Supplementary Table 1). b, Relative expression of the FLS response gene signature to stimulation by plate bound DLL4 in each RNA capture area on the ST slide (n = 2 tissues, 2 sections each: RA3 shown). c, Annotation of each RNA capture area into three groups: DLL4 response gene signature score in the top 10th percentile (blue), directly adjacent to these areas (orange), or all other spots (green) (n = 2 tissues, 2 sections each: RA3 shown). d, Violin plot showing the expression of the FLS-specific cytokine response gene signatures in the areas defined in panel (c) (aggregated data from all 4 sections from 2 tissues: RA3 and RA6). The top shows the number of total RNA capture areas in the groups defined in panel (c) for all tissue sections.

Comment in

References

    1. Nygaard G, Firestein GS. Restoring synovial homeostasis in rheumatoid arthritis by targeting fibroblast-like synoviocytes. Nat. Rev. Rheumatol. 2020;16:316–333. doi: 10.1038/s41584-020-0413-5. - DOI - PMC - PubMed
    1. Zhang F, et al. Defining inflammatory cell states in rheumatoid arthritis joint synovial tissues by integrating single-cell transcriptomics and mass cytometry. Nat. Immunol. 2019;20:928–942. doi: 10.1038/s41590-019-0378-1. - DOI - PMC - PubMed
    1. Zhao S, et al. Effect of JAK inhibition on the induction of proinflammatory HLA-DR+CD90+ rheumatoid arthritis synovial fibroblasts by interferon-ɣ. Arthritis Rheumatol. 2022;74:441–452. doi: 10.1002/art.41958. - DOI - PMC - PubMed
    1. Alivernini S, et al. Distinct synovial tissue macrophage subsets regulate inflammation and remission in rheumatoid arthritis. Nat. Med. 2020;26:1295–1306. doi: 10.1038/s41591-020-0939-8. - DOI - PubMed
    1. Boots AM, Wimmers-Bertens AJ, Rijnders AW. Antigen-presenting capacity of rheumatoid synovial fibroblasts. Immunology. 1994;82:268–274. - PMC - PubMed

Publication types