

Identification of genomic biomarkers and their pathway crosstalks for deciphering mechanistic links in glioblastoma
- PMID: 37277696
- PMCID: PMC10439498
- DOI: 10.1049/syb2.12066
Identification of genomic biomarkers and their pathway crosstalks for deciphering mechanistic links in glioblastoma
Abstract
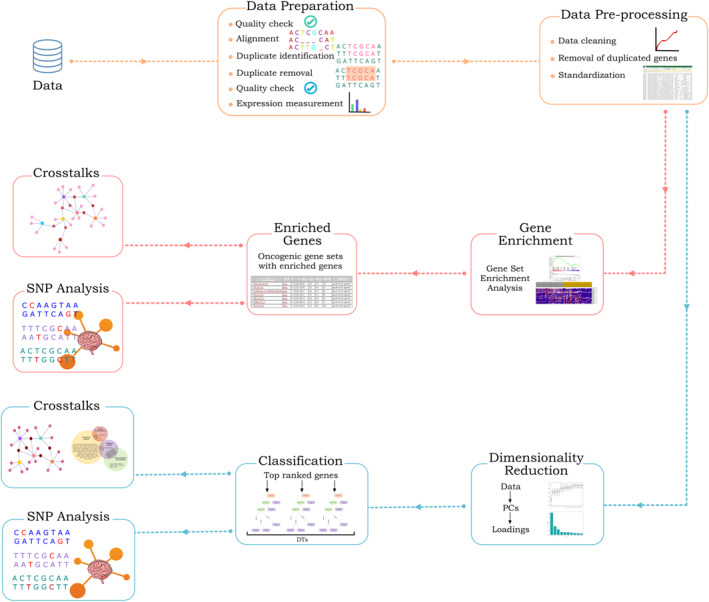
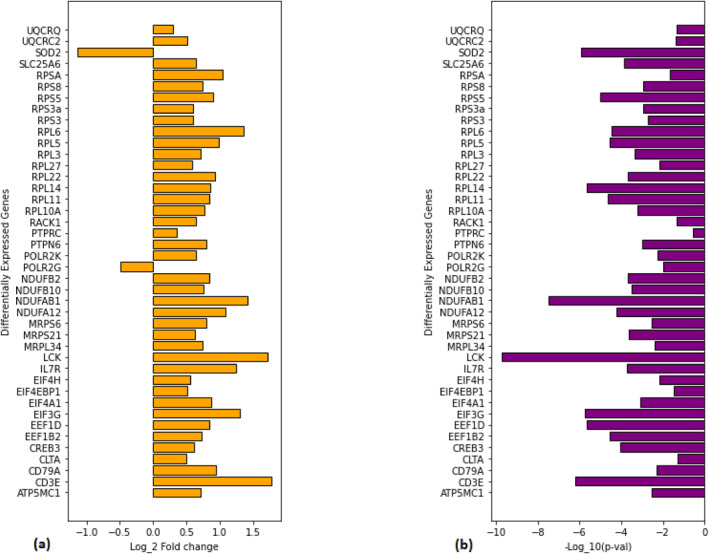
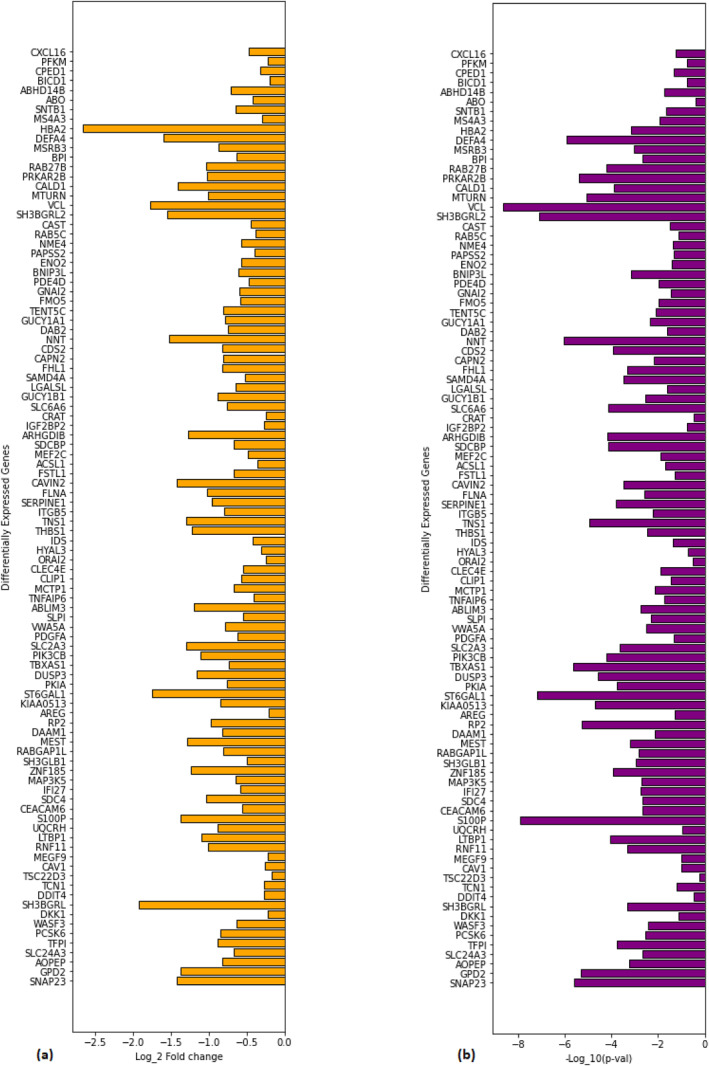
Glioblastoma is a grade IV pernicious neoplasm occurring in the supratentorial region of brain. As its causes are largely unknown, it is essential to understand its dynamics at the molecular level. This necessitates the identification of better diagnostic and prognostic molecular candidates. Blood-based liquid biopsies are emerging as a novel tool for cancer biomarker discovery, guiding the treatment and improving its early detection based on their tumour origin. There exist previous studies focusing on the identification of tumour-based biomarkers for glioblastoma. However, these biomarkers inadequately represent the underlying pathological state and incompletely illustrate the tumour because of non-recursive nature of this approach to monitor the disease. Also, contrary to the tumour biopsies, liquid biopsies are non-invasive and can be performed at any interval during the disease span to surveil the disease. Therefore, in this study, a unique dataset of blood-based liquid biopsies obtained primarily from tumour-educated blood platelets (TEP) is utilised. This RNA-seq data from ArrayExpress is acquired comprising human cohort with 39 glioblastoma subjects and 43 healthy subjects. Canonical and machine learning approaches are applied for identification of the genomic biomarkers for glioblastoma and their crosstalks. In our study, 97 genes appeared enriched in 7 oncogenic pathways (RAF-MAPK, P53, PRC2-EZH2, YAP conserved, MEK-MAPK, ErbB2 and STK33 signalling pathways) using GSEA, out of which 17 have been identified participating actively in crosstalks. Using PCA, 42 genes are found enriched in 7 pathways (cytoplasmic ribosomal proteins, translation factors, electron transport chain, ribosome, Huntington's disease, primary immunodeficiency pathways, and interferon type I signalling pathway) harbouring tumour when altered, out of which 25 actively participate in crosstalks. All the 14 pathways foster well-known cancer hallmarks and the identified DEGs can serve as genomic biomarkers, not only for the diagnosis and prognosis of Glioblastoma but also in providing a molecular foothold for oncogenic decision making in order to fathom the disease dynamics. Moreover, SNP analysis for the identified DEGs is performed to investigate their roles in disease dynamics in an elaborated manner. These results suggest that TEPs are capable of providing disease insights just like tumour cells with an advantage of being extracted anytime during the course of disease in order to monitor it.
Keywords: bioinformatics; cancer; genomics.
© 2023 The Authors. IET Systems Biology published by John Wiley & Sons Ltd on behalf of The Institution of Engineering and Technology.
Conflict of interest statement
There is no conflict of interest.
Figures


References
-
- Jessen, K.R. , Richardson, W.D. : Glial Cell Development: Basic Principles and Clinical Relevance, vol. 1. Oxford University Press, USA: (2001)
-
- Drabycz, S. , Roldán, G. , De Robles, P. , Adler, D. , McIntyre, J.B. , Magliocco, A.M. , Cairncross, J.G. , Mitchell, J.R. : An analysis of image texture, tumor location, and MGMT promoter methylation in glioblastoma using magnetic resonance imaging. Neuroimage 49(2), 1398–1405 (2010). 10.1016/j.neuroimage.2009.09.049 - DOI - PubMed
-
- Ostrom, Q.T. , Cioffi, G. , Gittleman, H. , Patil, N. , Waite, K. , Kruchko, C. , Barnholtz‐Sloan, J.S. : CBTRUS statistical report: primary brain and other central nervous system tumors diagnosed in the United States in 2012–2016. Neuro Oncol. 21(Supplement_5), v1–v100 (2019). Supplement_5):v1–v100. 10.1093/neuonc/noz150 - DOI - PMC - PubMed
MeSH terms
Substances
LinkOut - more resources
Full Text Sources
Research Materials
Miscellaneous
