Observational Study
. 2023 Jun 5;23(1):1061.
doi: 10.1186/s12889-023-15754-0.

Profile and quality of life of the adult population in good health according to the level of vitality: European NHWS cross sectional analysis

Affiliations
Observational Study

Profile and quality of life of the adult population in good health according to the level of vitality: European NHWS cross sectional analysis

Anne-Laure Tardy et al. BMC Public Health. .

Abstract

Background: The World Health Organization's definition of health highlights the importance of mental and physical wellbeing and not only disease state. However, lack of awareness on the burden of impaired vitality and its impact on the quality of life of the general healthy population prevents healthcare providers from delivering appropriate solutions and advice. This study aims to better characterize this population in Europe and identify the profile and the health reported outcomes associated with impaired vitality.

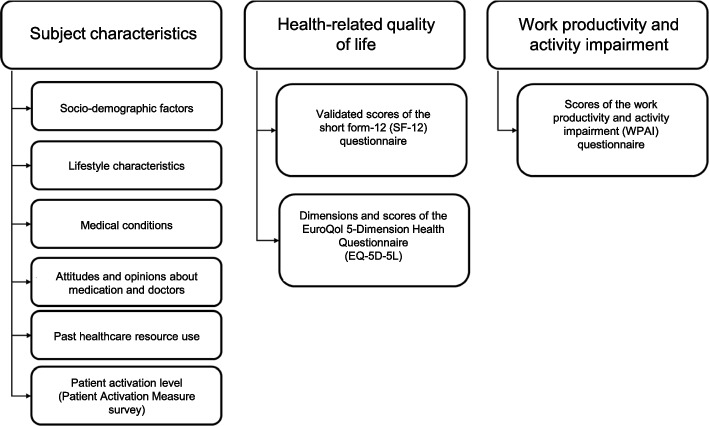
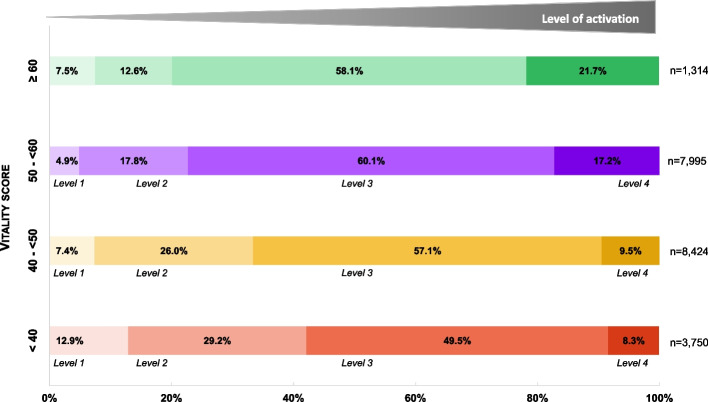
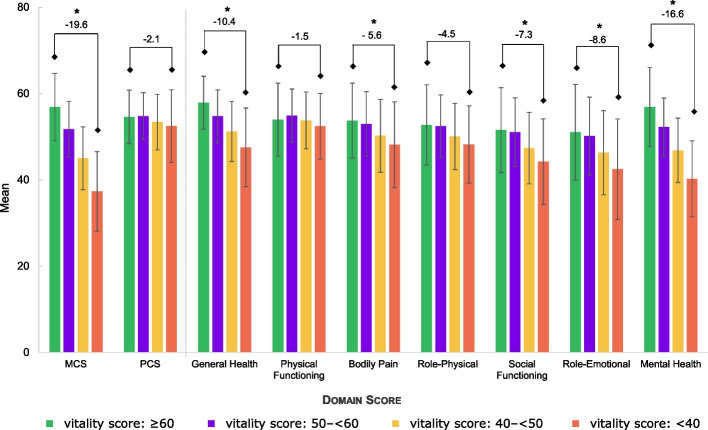
Methods: This retrospective observational study included National Health and Wellness Survey (NHWS) data collected in healthy participants aged 18-65 years from five European Union countries in 2018. Socio-demographic and lifestyle characteristics, comorbidities, attitudes towards healthcare systems, Patient Activation Measure, health-related quality of life outcomes (EQ-5D), and work productivity and activity impairment were analysed according to SF-12 vitality score subgroups (≥ 60, 50- < 60, 40- < 50, < 40).

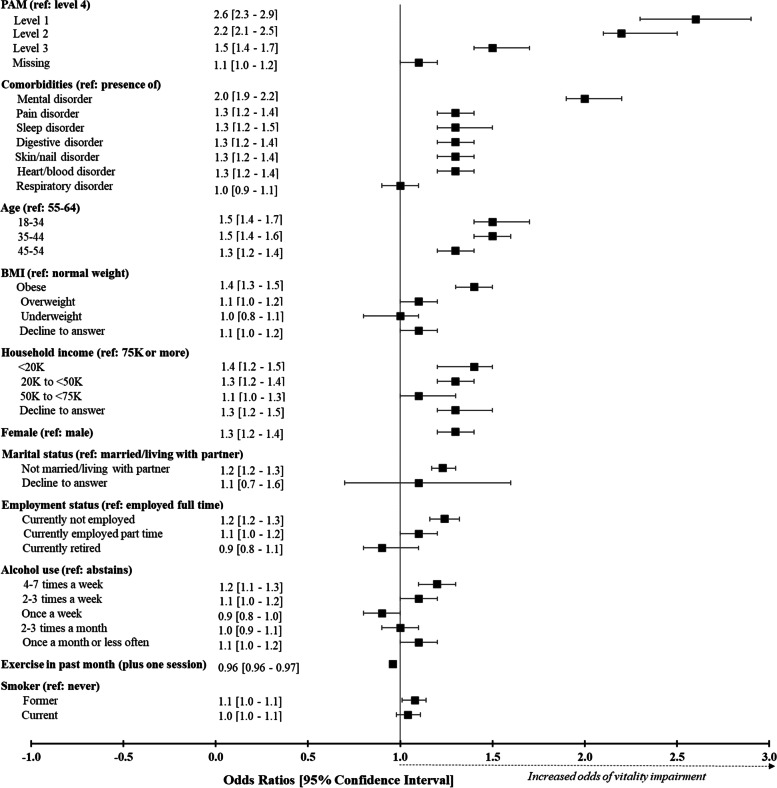
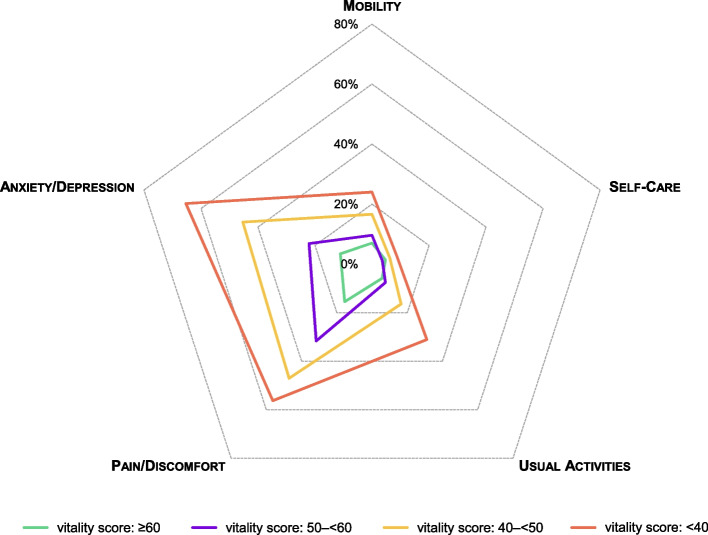
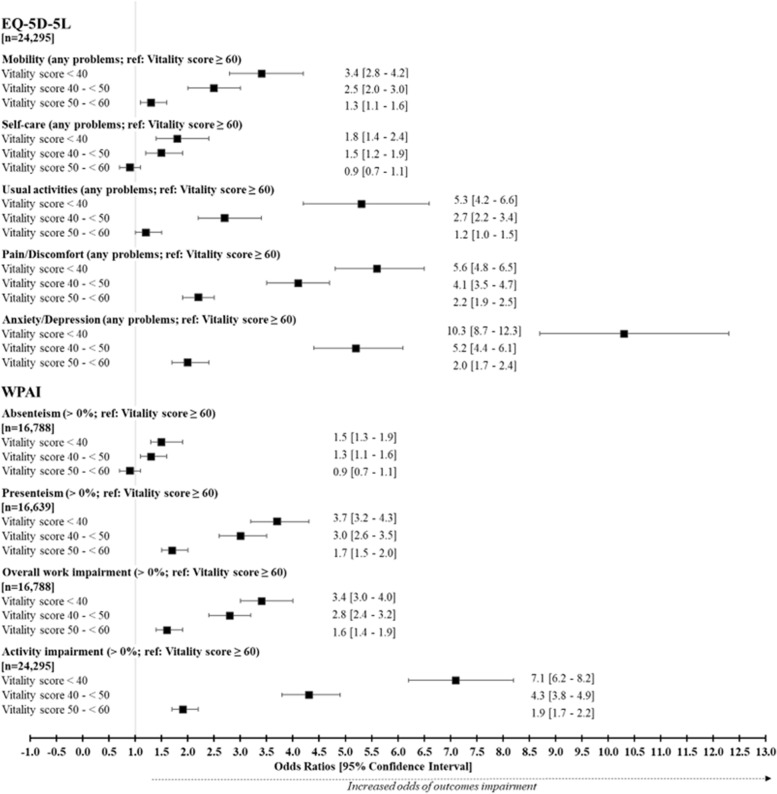
Results: A total of 24,295 participants were enrolled in the main analysis. Being a female, younger, having a lower income and being obese or having sleep and mental disorders was associated with an increased risk of impaired vitality. This was associated with a higher consumption of healthcare resources along with having a weak patient-physician relationship. Participants who were disengaged in the self-management of their health were 2.6 times more likely to have a low level of vitality. For participants in the lowest vitality group, odds of mobility problems increased by 3.4, impairment of usual activity by 5.8, increased of pain and discomfort by 5.6 and depression and anxiety by 10.3, compared with participants in the highest vitality group. Also, odds of presenteeism increased by 3.7, overall work impairment by 3.4 and daily activity losses by 7.1.

Conclusion: Evidence-based trends facilitate the identification of a healthy population with impaired vitality in real-world practice. This study highlights the actual burden of low vitality on daily life activities, particularly on mental health and reduced work productivity. Additionally, our results underline the importance of self-engagement in the management of vitality impairment and highlights the need to implement strategies to address this public health concern in the affected population (HCP-patient communication, supplements, meditation).

Keywords: Fatigue; Good health; Health-related quality of life; NHWS; Patient activation; Patient profile; Vitality.


Conflict of interest statement

Caroline Armand, Andrew Steward and Anne-Laure Tardy are full-time employees of Sanofi Consumer Healthcare.

Sophie Marguet, Halley Costantino and deMauri Mackie are full-time employees of Cerner Enviza (formerly Kantar Health), the organization that received funding from Sanofi Consumer Healthcare for the conduct of this study. Grèce Saba was a full-time employee of Cerner Enviza (formerly Kantar Health) at the time of the study.

The authors report no other conflicts of interest in this work.

Figures

Fig. 1
Fig. 1
National Health and Wellness Survey modules EQ-5D-5L, EuroQol 5-Dimension Health Questionnaire; NHWS, National Health and Wellness Survey; SF-12, short form-12; WPAI, Work Productivity and Activity Impairment
Fig. 2
Fig. 2
Patient activation measure according to vitality groups Percentages were calculated on respondents (N = 21,483)
Fig. 3
Fig. 3
Multivariate analysis of the association between the characteristics of the population (participant profile) and the vitality groups. BMI, body mass index; PAM, patient activation measure a mental disorders: Anxiety (no current use of medications), depression (no current use of medications or not severe when taking medications), others without current use of medications (attention deficit disorder, attention deficit hyperactivity disorder, bipolar disorder, generalized anxiety disorder, obsessive compulsive disorder, panic disorder, phobias, post-traumatic disorder, social anxiety disorder). b pain disorders: Headache (no current use of medications), migraine (no current use of medications), pain (no current use of medications or not severe when taking medications). c sleep disorders: Insomnia (no current use of medications or not moderate to severe when taking medications), others (narcolepsy (no current use of medications), sleep apnea (not severe when taking medications), other sleep difficulties (no current use of medications)). d digestive disorders: GERD / acid reflux, heartburn, others (chronic constipation, diarrhea (frequent), diverticulitis, ulcers (active/peptic stomach or duodenal, no current use of medications)). e skin/ nail disorders: Acne, dermatitis (no current use of medications or not moderate to severe when taking medications), eczema (no current use of medications or not moderate to severe when taking medications), others (Atopic dermatitis (not moderate to severe when taking medications), Fungal infections of the skin or Athlete’s foot, hidradenitis suppurativa, rosacea, shingles, skin ulcers/cellulitis). f heart/blood disorders: Type 2 Diabetes (T2D) (not associated with high blood pressure or high cholesterol if current use of medications for these conditions), High blood pressure (not associated with T2D or high cholesterol if current use of medications for these conditions), High cholesterol (not associated with T2D or high blood pressure if current use of medications for these conditions). g respiratory disorders: Allergies (no current use of medications), asthma (no current use of medications), hay fever
Fig. 4
Fig. 4
SF-12 scores by domains according to vitality groups MCS, mental component summary; PCS, physical component summary; SD, standard deviation; SF-12, short form-12. * Clinically meaningful of at least 5 points of incremental difference between higher vitality score group (≥ 60) and lowest vitality score group (< 40); Error bars show SD. All participant of the main analysis completed the SF-12 questionnaire (N = 24,295). Number of participants by group was as follows: > 60: N = 1,736; 50—< 60: N = 9,059; 40—< 50: N = 9,327; < 40: N = 4,173
Fig. 5
Fig. 5
Proportion of participants reporting problems in EQ-5D-5L questionnaire according to vitality groups EQ-5D-5L, EuroQol 5-Dimension Health. Number of participants by group was as follows: ≥ 60: N = 1,736; 50– < 60: N = 9,059; 40– < 50: N = 9,327; < 40: N = 4,173
Fig. 6
Fig. 6
Work productivity and activity impairment (WPAI scale components) according to vitality groups WPAI, Work Productivity and Activity Impairment. * Significantly different between 4 groups (p < 0.01). Active population (N = 16,788) completed the absenteeism and overall work impairment questions. Active population who declared working at least 1 h during the 7 last days (N = 16,639) completed the question about presenteeism. All participant (N = 24,295) completed the question related to activity impairment
Fig. 7
Fig. 7
Multivariate analyses of the association between the health outcomes and the vitality groups EQ-5D-5L, EuroQol 5-Dimension Health Questionnaire; OR, odds ratio; WPAI, work productivity and activity impairment

References

    1. Lewis G, Wessely S. The epidemiology of fatigue: more questions than answers. J Epidemiol Community Health. 1992;46(2):92–97. doi: 10.1136/jech.46.2.92. - DOI - PMC - PubMed
    1. Billones R, Liwang JK, Butler K, Graves L, Saligan LN. Dissecting the fatigue experience: A scoping review of fatigue definitions, dimensions, and measures in non-oncologic medical conditions. Brain Behav Immun Health. 2021;15:100266. doi: 10.1016/j.bbih.2021.100266. - DOI - PMC - PubMed
    1. van’t Leven M, Zielhuis GA, van der Meer JW, Verbeek AL, Bleijenberg G. Fatigue and chronic fatigue syndrome-like complaints in the general population. Eur J Public Health. 2010;20(3):251–7. doi: 10.1093/eurpub/ckp113. - DOI - PubMed
    1. Aritake S, Kaneita Y, Ohtsu T, Uchiyama M, Mishima K, Akashiba T, et al. Prevalence of fatigue symptoms and correlations in the general adult population. Sleep Biol Rhythms. 2015;13(2):146–154. doi: 10.1111/sbr.12099. - DOI
    1. Galland-Decker C, Marques-Vidal P, Vollenweider P. Prevalence and factors associated with fatigue in the Lausanne middle-aged population: a population-based, cross-sectional survey. BMJ Open. 2019;9(8):e027070. doi: 10.1136/bmjopen-2018-027070. - DOI - PMC - PubMed

Publication types

LinkOut - more resources