

Integrated fecal microbiota and metabolomics analysis of the orlistat intervention effect on polycystic ovary syndrome rats induced by letrozole combined with a high-fat diet
- PMID: 37277785
- PMCID: PMC10240724
- DOI: 10.1186/s13048-023-01193-3
Integrated fecal microbiota and metabolomics analysis of the orlistat intervention effect on polycystic ovary syndrome rats induced by letrozole combined with a high-fat diet
Abstract
Background: This study aimed to compare the characteristics of the gut microbiota and their metabolite profiles between polycystic ovary syndrome (PCOS) and orlistat-treated PCOS rats (ORL-PCOS), which could help to better understand the underlying mechanism of the effect of orlistat on PCOS.
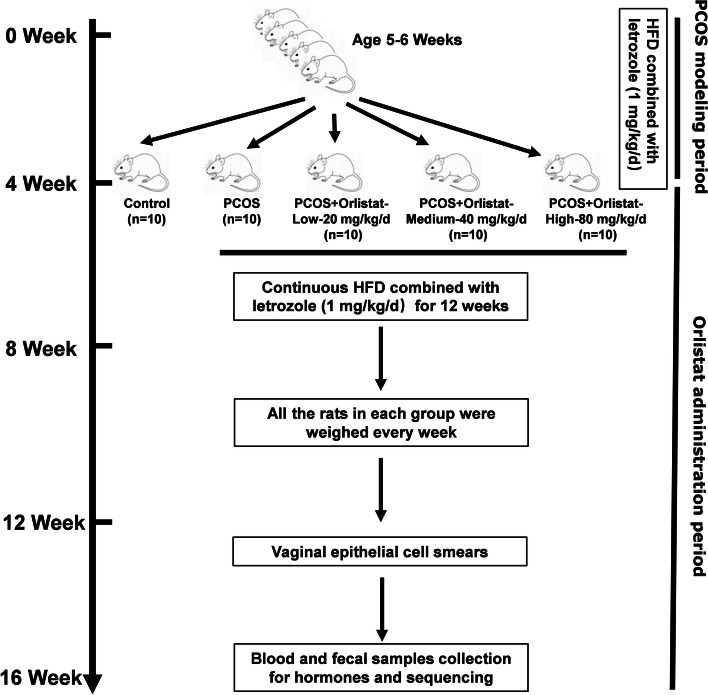
Methods: PCOS rat models were established using letrozole combined with a high-fat diet. Ten rats were randomly selected as a PCOS control group (PCOS). The other three groups (n = 10/group) were additionally supplemented with different doses of orlistat (low, medium, high). Then, fecal samples of the PCOS and ORL-PCOS groups were analysed by 16S rRNA gene sequencing and untargeted metabolomics. Blood samples were collected to detect serum sex hormones and lipids.
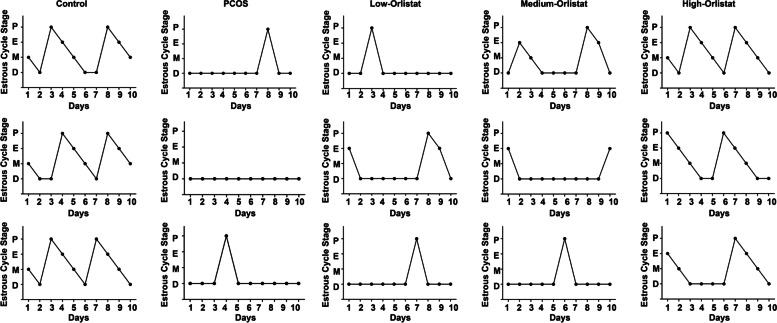
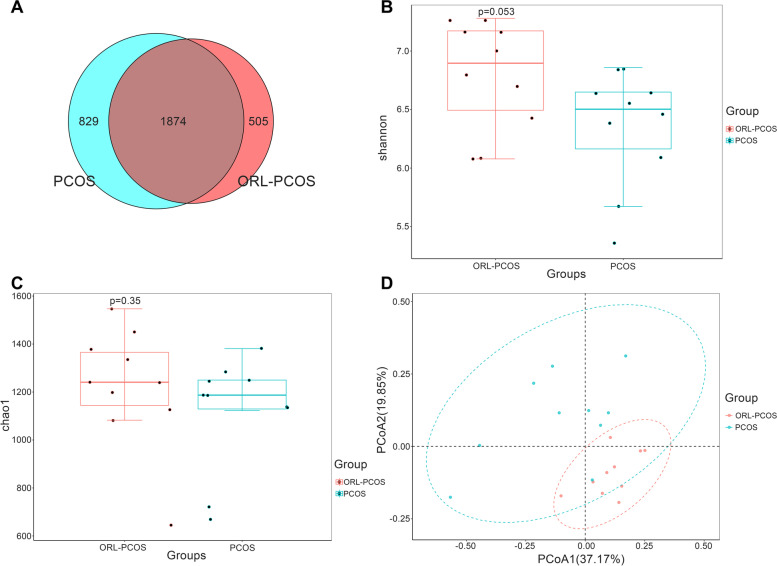
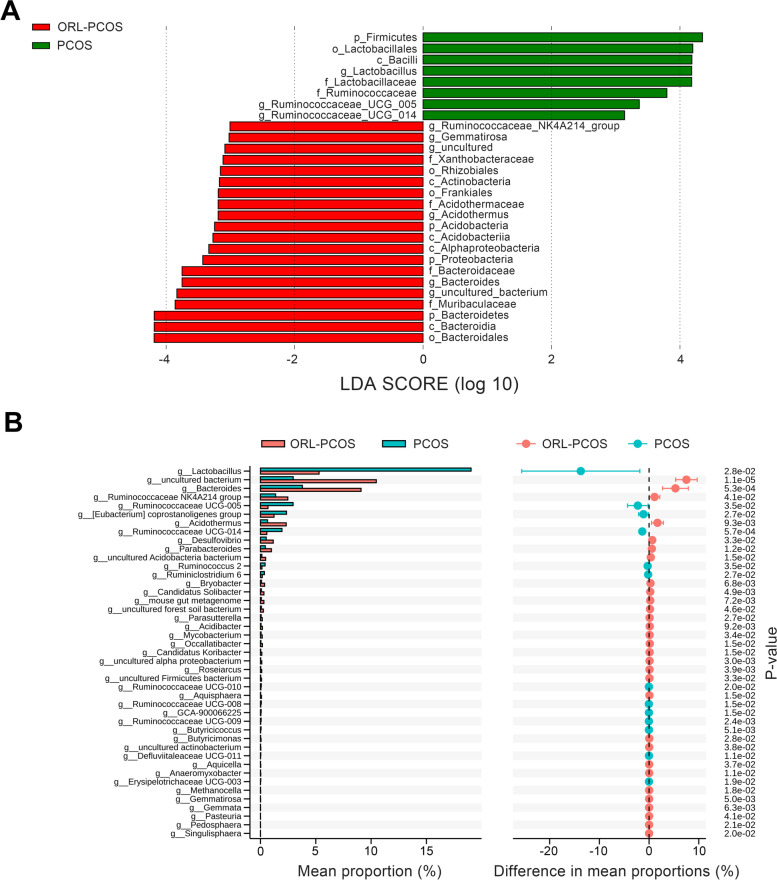
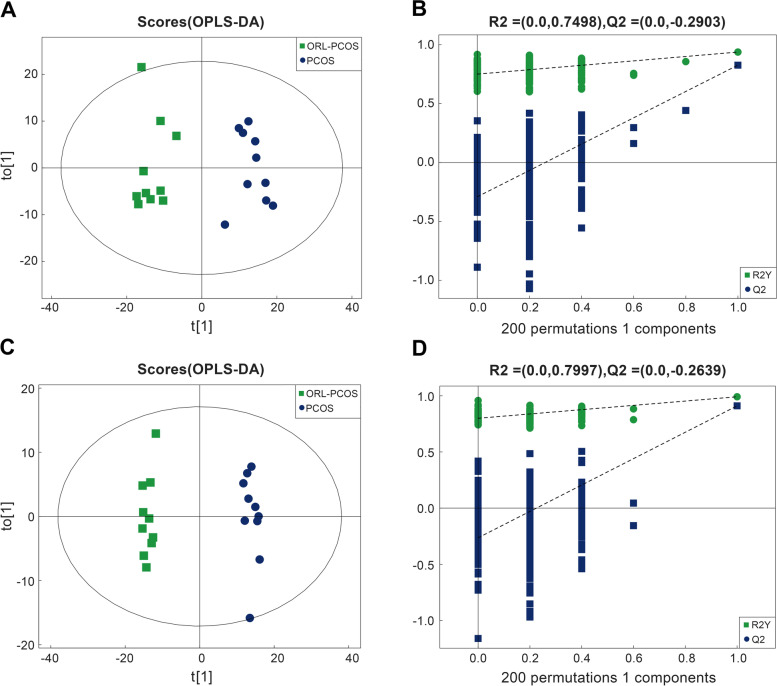
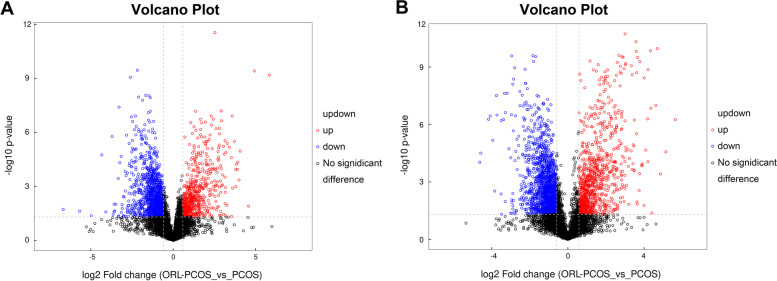
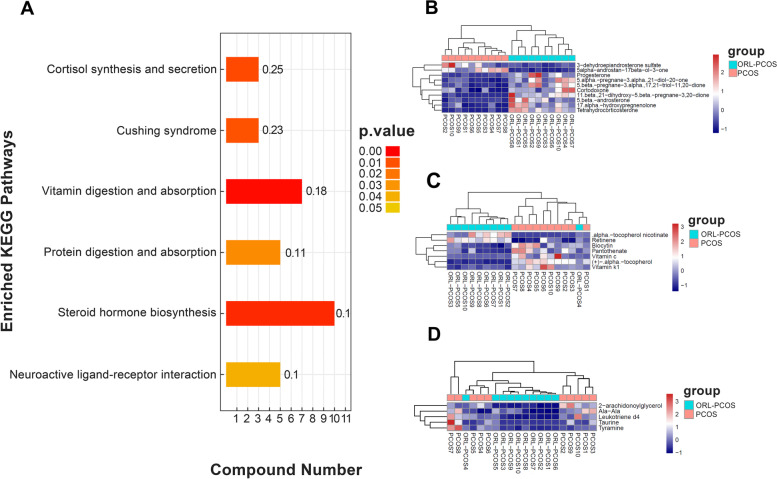
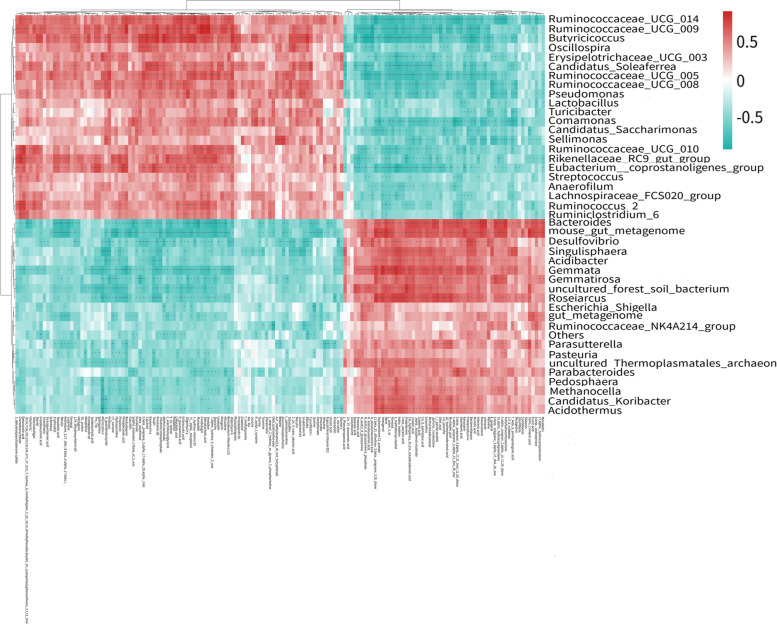
Results: The results showed that orlistat attenuated the body weight gain, decreased the levels of T, LH, the LH/FSH ratio, TC, TG and LDL-C; increased the level of E2; and improved estrous cycle disorder in PCOS rats. The bacterial richness and diversity of the gut microbiota in the ORL-PCOS group were higher than those in the PCOS group. The ratio of Firmicutes to Bacteroidetes was decreased with orlistat treatment. Moreover, orlistat treatment led to a significant decrease in the relative abundance of Ruminococcaceae and Lactobacillaceae, and increases in the abundances of Muribaculaceae and Bacteroidaceae. Metabolic analysis identified 216 differential fecal metabolites in total and 6 enriched KEGG pathways between the two groups, including steroid hormone biosynthesis, neuroactive ligand-receptor interaction and vitamin digestion and absorption. Steroid hormone biosynthesis was the pathway with the most significant enrichment. The correlations between the gut microbiota and differential metabolites were calculated, which may provide a basis for understanding the composition and function of microbial communities.
Conclusions: Our data suggested that orlistat exerts a PCOS treatment effect, which may be mediated by modifying the structure and composition of the gut microbiota, as well as the metabolite profiles of PCOS rats.
Keywords: Gut microbiota; Metabolomics; Obesity; Orlistat; Polycystic ovary syndrome.
© 2023. The Author(s).
Conflict of interest statement
The authors declare no competing interests.
Figures
Similar articles
-
Effect of the ketogenic diet on gut microbiome composition and metabolomics in polycystic ovarian syndrome rats induced by letrozole and a high-fat diet.Nutrition. 2023 Oct;114:112127. doi: 10.1016/j.nut.2023.112127. Epub 2023 Jun 8. Nutrition. 2023. PMID: 37441825
-
Dietary α-Linolenic Acid-Rich Flaxseed Oil Exerts Beneficial Effects on Polycystic Ovary Syndrome Through Sex Steroid Hormones-Microbiota-Inflammation Axis in Rats.Front Endocrinol (Lausanne). 2020 May 27;11:284. doi: 10.3389/fendo.2020.00284. eCollection 2020. Front Endocrinol (Lausanne). 2020. PMID: 32670195 Free PMC article.
-
Depletion of gut microbiota influents glucose metabolism and hyperandrogenism traits of mice with PCOS induced by letrozole.Front Endocrinol (Lausanne). 2023 Oct 20;14:1265152. doi: 10.3389/fendo.2023.1265152. eCollection 2023. Front Endocrinol (Lausanne). 2023. PMID: 37929036 Free PMC article.
-
Sex, Microbes, and Polycystic Ovary Syndrome.Trends Endocrinol Metab. 2019 Jan;30(1):54-65. doi: 10.1016/j.tem.2018.11.001. Epub 2018 Nov 29. Trends Endocrinol Metab. 2019. PMID: 30503354 Free PMC article. Review.
-
Kuntai Capsule Combined With Letrozole on Gonadal Hormone Levels and Ovarian Function in Patients With PCOS: A Systematic Review and Meta-Analysis.Front Endocrinol (Lausanne). 2021 Dec 28;12:789909. doi: 10.3389/fendo.2021.789909. eCollection 2021. Front Endocrinol (Lausanne). 2021. PMID: 35027910 Free PMC article.
Cited by
-
Sphingolipid metabolism-related genes for the diagnosis of metabolic syndrome by integrated bioinformatics analysis and Mendelian randomization identification.Diabetol Metab Syndr. 2025 Jun 19;17(1):234. doi: 10.1186/s13098-025-01803-8. Diabetol Metab Syndr. 2025. PMID: 40537868 Free PMC article.
References
MeSH terms
Substances
Grants and funding
LinkOut - more resources
Full Text Sources
Medical
Miscellaneous
