

Disease-specific health spending by age, sex, and type of care in Norway: a national health registry study
- PMID: 37277874
- PMCID: PMC10243068
- DOI: 10.1186/s12916-023-02896-6
Disease-specific health spending by age, sex, and type of care in Norway: a national health registry study
Abstract
Background: Norway is a high-income nation with universal tax-financed health care and among the highest per person health spending in the world. This study estimates Norwegian health expenditures by health condition, age, and sex, and compares it with disability-adjusted life-years (DALYs).
Methods: Government budgets, reimbursement databases, patient registries, and prescription databases were combined to estimate spending for 144 health conditions, 38 age and sex groups, and eight types of care (GPs; physiotherapists & chiropractors; specialized outpatient; day patient; inpatient; prescription drugs; home-based care; and nursing homes) totaling 174,157,766 encounters. Diagnoses were in accordance with the Global Burden of Disease study (GBD). The spending estimates were adjusted, by redistributing excess spending associated with each comorbidity. Disease-specific DALYs were gathered from GBD 2019.
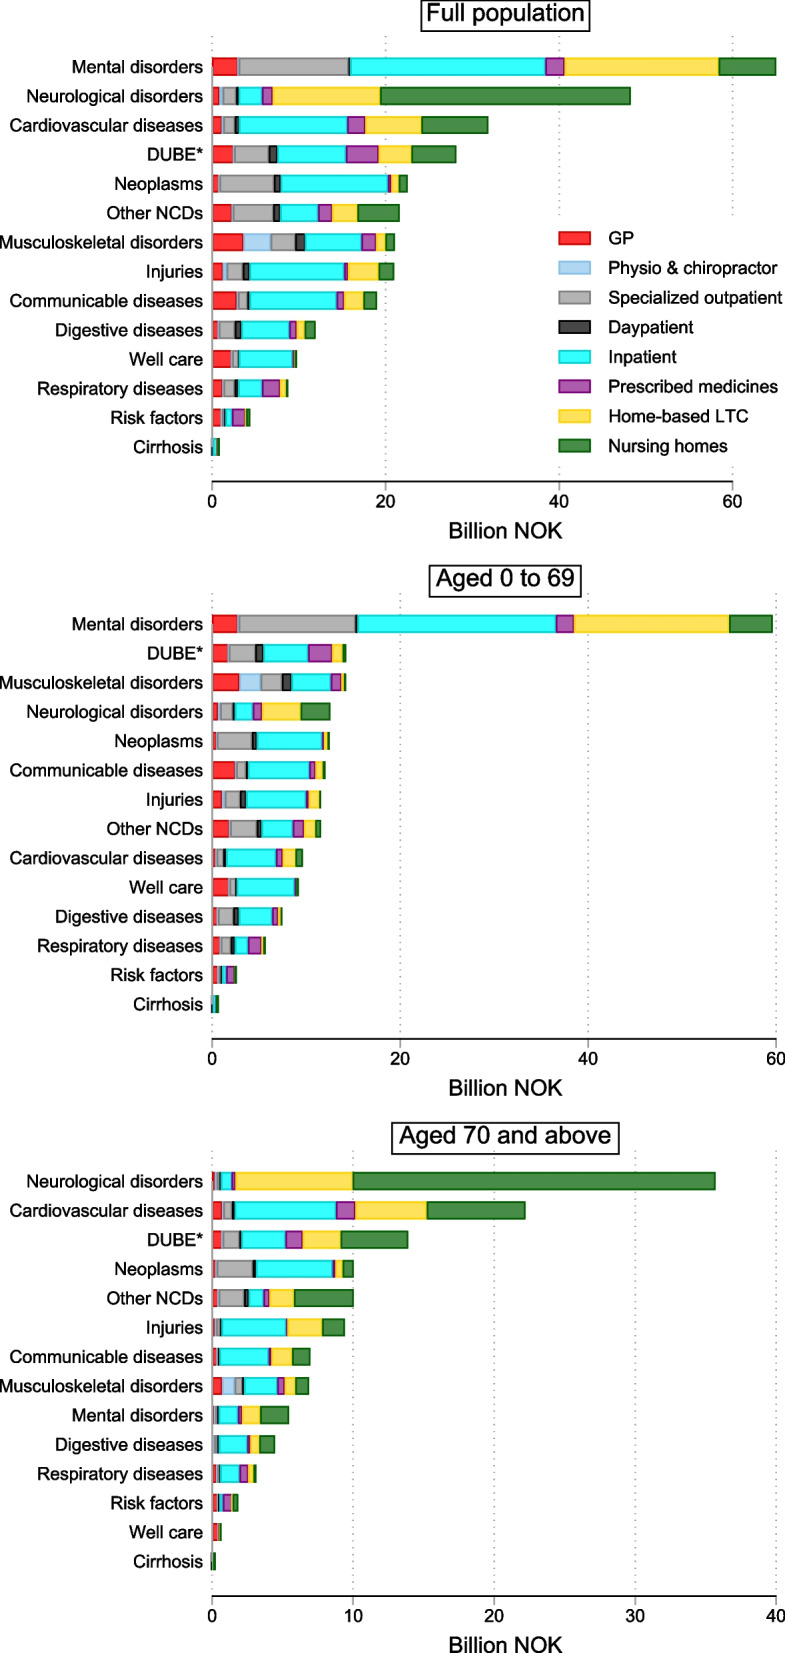
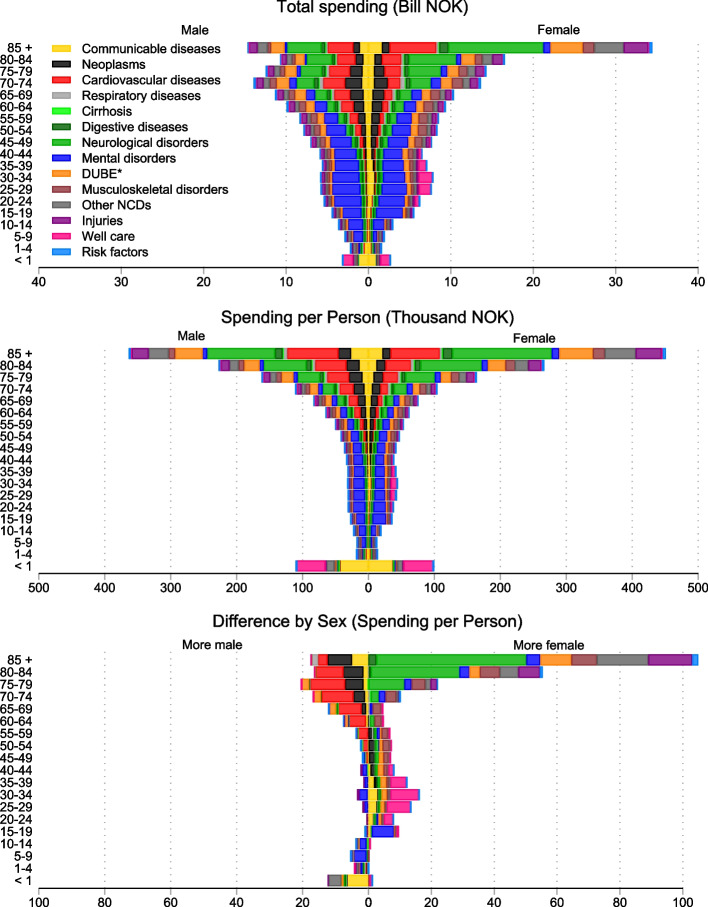
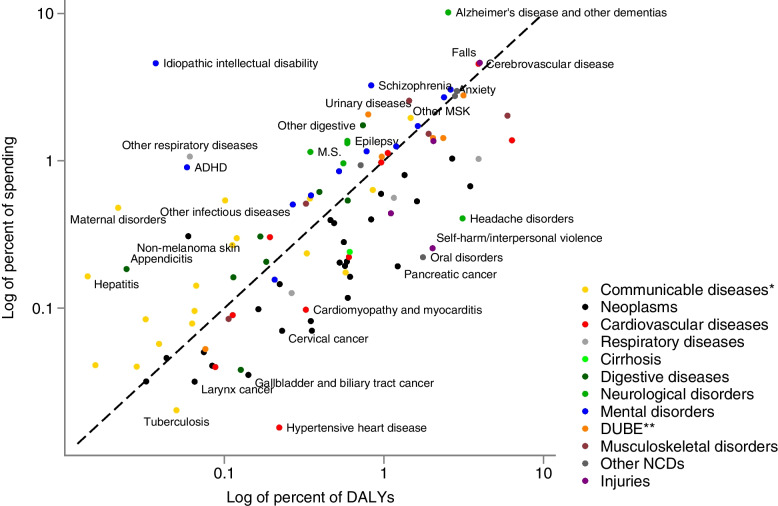
Results: The top five aggregate causes of Norwegian health spending in 2019 were mental and substance use disorders (20.7%), neurological disorders (15.4%), cardiovascular diseases (10.1%), diabetes, kidney, and urinary diseases (9.0%), and neoplasms (7.2%). Spending increased sharply with age. Among 144 health conditions, dementias had the highest health spending, with 10.2% of total spending, and 78% of this spending was incurred at nursing homes. The second largest was falls estimated at 4.6% of total spending. Spending in those aged 15-49 was dominated by mental and substance use disorders, with 46.0% of total spending. Accounting for longevity, spending per female was greater than spending per male, particularly for musculoskeletal disorders, dementias, and falls. Spending correlated well with DALYs (Correlation r = 0.77, 95% CI 0.67-0.87), and the correlation of spending with non-fatal disease burden (r = 0.83, 0.76-0.90) was more pronounced than with mortality (r = 0.58, 0.43-0.72).
Conclusions: Health spending was high for long-term disabilities in older age groups. Research and development into more effective interventions for the disabling high-cost diseases is urgently needed.
Keywords: Burden of disease; Cost of illness; Disability-adjusted life years (DALYs); Disease expenditures; Norway.
© 2023. The Author(s).
Conflict of interest statement
Søren Toksvig Klitkou, formerly employed by the Norwegian Institute of Public Health, is currently an employee of MSD Norway, a subsidiary of Merck & Co., Inc., Kenilworth, NJ, USA, which manufactures drugs and vaccines.
Øystein Karlstad reports participation in research projects funded by Novo Nordisk, LEO Pharma, and Bristol Myers Squibb, all regulator-mandated phase IV studies, all with funds paid to his institution (no personal fees), outside of the submitted work.
The other authors declare that they have no competing interests.
Figures
Comment in
-
What is the value of disease expenditure studies? An argument for an international database of spending estimates.BMC Glob Public Health. 2023 Oct 23;1(1):23. doi: 10.1186/s44263-023-00021-6. BMC Glob Public Health. 2023. PMID: 39681871 Free PMC article.
References
-
- OECD . Income inequality (indicator) 2022.
-
- OECD . Health at a Glance 2021. 2021.
-
- Micah AE, Cogswell IE, Cunningham B, Ezoe S, Harle AC, Maddison ER, et al. Tracking development assistance for health and for COVID-19: a review of development assistance, government, out-of-pocket, and other private spending on health for 204 countries and territories, 1990–2050. Lancet. 2021;398(10308):1317–1343. doi: 10.1016/S0140-6736(21)01258-7. - DOI - PMC - PubMed
Publication types
MeSH terms
LinkOut - more resources
Full Text Sources
Medical
