. 2023 Jul;32(14):3842-3858.
doi: 10.1111/mec.16986. Epub 2023 Jun 5.

Barriers to chimpanzee gene flow at the south-east edge of their distribution

Affiliations

Barriers to chimpanzee gene flow at the south-east edge of their distribution

Noémie Bonnin et al. Mol Ecol. 2023 Jul.

Abstract

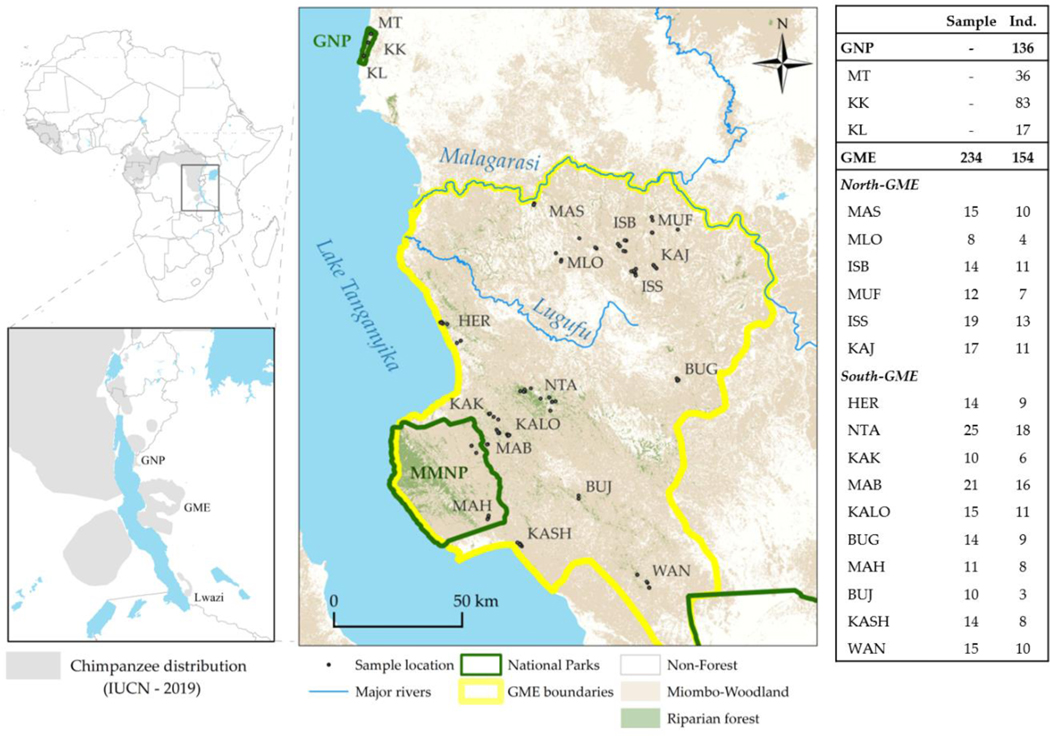
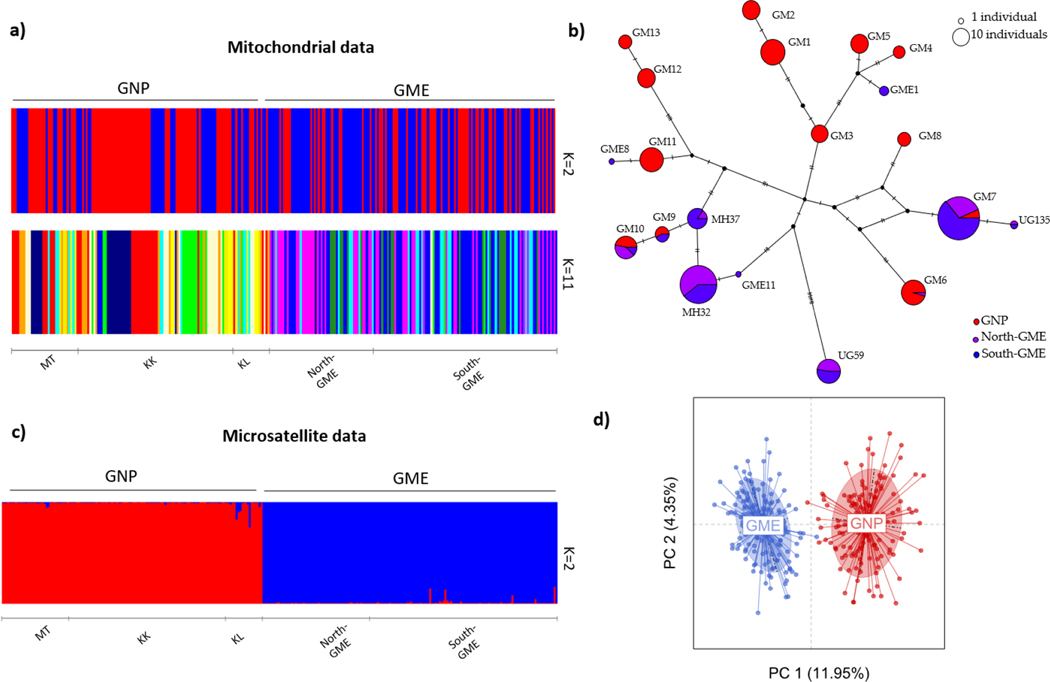
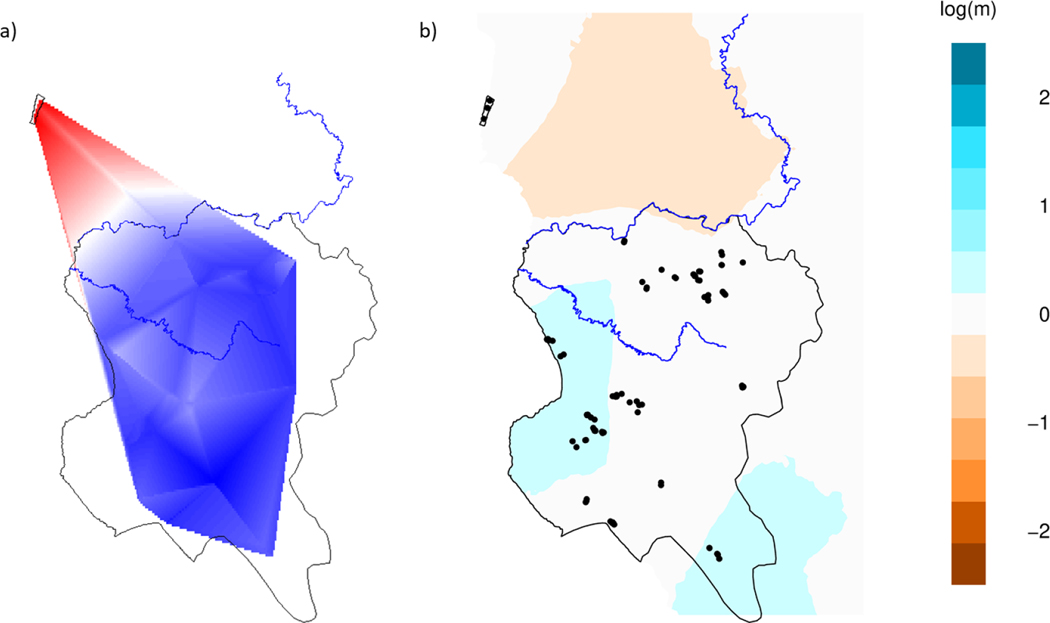
Populations on the edge of a species' distribution may represent an important source of adaptive diversity, yet these populations tend to be more fragmented and are more likely to be geographically isolated. Lack of genetic exchanges between such populations, due to barriers to animal movement, can not only compromise adaptive potential but also lead to the fixation of deleterious alleles. The south-eastern edge of chimpanzee distribution is particularly fragmented, and conflicting hypotheses have been proposed about population connectivity and viability. To address this uncertainty, we generated both mitochondrial and MiSeq-based microsatellite genotypes for 290 individuals ranging across western Tanzania. While shared mitochondrial haplotypes confirmed historical gene flow, our microsatellite analyses revealed two distinct clusters, suggesting two populations currently isolated from one another. However, we found evidence of high levels of gene flow maintained within each of these clusters, one of which covers an 18,000 km2 ecosystem. Landscape genetic analyses confirmed the presence of barriers to gene flow with rivers and bare habitats highly restricting chimpanzee movement. Our study demonstrates how advances in sequencing technologies, combined with the development of landscape genetics approaches, can resolve ambiguities in the genetic history of critical populations and better inform conservation efforts of endangered species.

Keywords: Tanzania; biogeography; genetic diversity; great apes; microsatellites; mitochondrial DNA.


Figures

Figure 1:
Figure 1:
Location of sampling sites. Ind.: corresponding number of individual chimpanzees used for analyses. Due to serious ongoing conservation threats to these populations, acronyms for location name are used throughout the manuscript. See Figure S2 for geographic distance between sampling sites.
Figure 2:
Figure 2:
Analyses of population structure. a) Individual clustering analyses of mtDNA using ‘BAPS’ for both K=2 and K=11 analyses. Vertical bars represent individuals with different colours corresponding to different inferred clusters. MT: Mitumba, KK: Kasekela, KL: Kalande. b) Median-joining haplotype network of mtDNA. Haplotypes colours represent the geographic partition. Hash marks on the haplotype edges indicate individual mutational steps. c) Bar plot created from STRUCTURE runs on microsatellite loci at K = 2. Each vertical bar represents an individual with colors indicating the proportion of each individual assigned to each inferred cluster. d) PCA plot of the 10 microsatellite loci for the entire dataset. Points represent genotypes; Populations are labelled inside their 95% inertia ellipses.
Figure 3:
Figure 3:
Spatial patterns of genetic variability in relation to GNP and GME boundaries (black) and major rivers (in blue). a) Result of Multispati analysis visualised using interpolated vector scores from the first positive axis. b) Result of EEMS analysis representing relative effective migration rates. Areas of lower migration than expected under exact isolation by distance (i.e., indicative of barriers to gene flow) are shown in orange. Areas which follow isolation by distance (white), and areas of higher migration than one would expect under exact isolation by distance (blue; dispersal corridor) are also shown. See Figure S14 for diagnostic plots produced by EEMS.

Similar articles

Cited by

References

    1. Alexander A (2015). genetic_diversity_diffs v1.0.0. Available from https://github.com/laninsky/genetic_diversity_diffs.
    1. Alexander A, Steel D, Hoekzema K, Mesnick SL, Engelhaupt D, Kerr I, … Baker CS (2016). What influences the worldwide genetic structure of sperm whales (Physeter macrocephalus)? Molecular Ecology, 25(12), 2754–2772. doi: 10.1111/mec.13638 - DOI - PubMed
    1. Baden AL, Mancini AN, Federman S, Holmes SM, Johnson SE, Kamilar J, … Bradley BJ (2019). Anthropogenic pressures drive population genetic structuring across a Critically Endangered lemur species range. Scientific Reports, 9(1), 1–11. doi: 10.1038/s41598-019-52689-2 - DOI - PMC - PubMed
    1. Balkenhol N, Cushman S, Storfer A, & Waits L (2016). Landscape genetics: concepts, methods, applications.
    1. Bandelt H-J, Forster P, & Röhl A (1999). Median-joining networks for inferring intraspecific phylogenies. Molecular Biology and Evolution, 16(1), 37−-48. doi: 10.1093/oxfordjournals.molbev.a026036 - DOI - PubMed

Publication types