. 2023 Jul 11;122(13):2773-2781.
doi: 10.1016/j.bpj.2023.05.033. Epub 2023 Jun 5.

Automated simulation-based membrane protein refinement into cryo-EM data

Affiliations

Automated simulation-based membrane protein refinement into cryo-EM data

Linnea Yvonnesdotter et al. Biophys J. .

Abstract

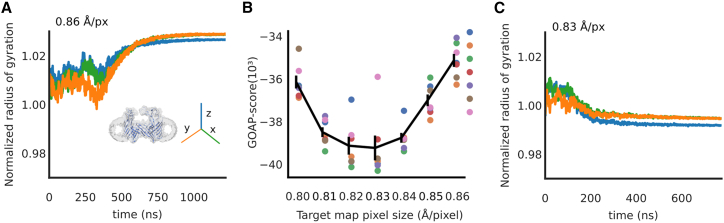
The resolution revolution has increasingly enabled single-particle cryogenic electron microscopy (cryo-EM) reconstructions of previously inaccessible systems, including membrane proteins-a category that constitutes a disproportionate share of drug targets. We present a protocol for using density-guided molecular dynamics simulations to automatically refine atomistic models into membrane protein cryo-EM maps. Using adaptive force density-guided simulations as implemented in the GROMACS molecular dynamics package, we show how automated model refinement of a membrane protein is achieved without the need to manually tune the fitting force ad hoc. We also present selection criteria to choose the best-fit model that balances stereochemistry and goodness of fit. The proposed protocol was used to refine models into a new cryo-EM density of the membrane protein maltoporin, either in a lipid bilayer or detergent micelle, and we found that results do not substantially differ from fitting in solution. Fitted structures satisfied classical model-quality metrics and improved the quality and the model-to-map correlation of the x-ray starting structure. Additionally, the density-guided fitting in combination with generalized orientation-dependent all-atom potential was used to correct the pixel-size estimation of the experimental cryo-EM density map. This work demonstrates the applicability of a straightforward automated approach to fitting membrane protein cryo-EM densities. Such computational approaches promise to facilitate rapid refinement of proteins under different conditions or with various ligands present, including targets in the highly relevant superfamily of membrane proteins.


Conflict of interest statement

Declaration of interests The authors declare no competing interests.

Figures

Figure 1
Figure 1
Effect of membrane mimetic on the quality of model fitting to detergent-solubilized maltoporin cryo-EM density. (A) Cryo-EM density map (gray) before micelle subtraction, superposed with an initial model of maltoporin (PDB: 1MAL) in solution (left), DDM detergent micelle (middle), or POPC lipid bilayer (right). (B) FSC of the best-fit model from density-guided simulations (n = 3) of maltoporin in solution (blue), detergent (green), or lipid (yellow) fit into the same cryo-EM density map. FSC of initial models marked in dashed lines and Chimera fit-in-map rigid body fit model (solid black). Black dashed horizontal line at 0.143 and vertical at the lowest estimated local resolution of the map, 2.88 Å. (C) Overlay of fitted models. To see this figure in color, go online.
Figure 2
Figure 2
FSC-Q quality validation of models fit in solution (left), detergent (middle), or lipid (right). Densities generated from fit models, colored by residue FSC-Q values (>0.5 indicating poor correlation or low resolution of the density map, and <–0.5 indicating potential over-fitting). Mean FSC-Q values and percentage of atoms with values >0.5 and <–0.5 are indicated for three replicates (I–III) for each simulation setup. To see this figure in color, go online.
Figure 3
Figure 3
Pixel-size estimation improved by density-guided simulations. (A) Radius of gyration of a fitted model, normalized to that of the initial model (PDB: 1MAL), guided by the experimental density map processed at the pixel size estimated at time of data collection (0.86 Å/pixel). Dimensions of the protein are plotted separately along x (green), y (orange), and z (blue) axes, the latter perpendicular to the membrane plane. (B) Optimal GOAP scores for density-guided simulations initiated from a range of starting models (n = 7, colored separately) guided by maps scaled at 0.80–0.86 Å/pixel. Solid line represents mean ± standard error of GOAP scores from fitting runs at each pixel size. (C) Radius of gyration as in (A) for one model fitted to a map scaled at the optimized pixel size (0.83 Å/pixel). To see this figure in color, go online.

References

    1. Terwilliger T.C., Adams P.D., et al. Sobolev O.V. A fully automatic method yielding initial models from high-resolution cryo-electron microscopy maps. Nat. Methods. 2018;15:905–908. - PMC - PubMed
    1. Pfab J., Phan N.M., Si D. DeepTracer for fast de novo cryo-EM protein structure modeling and special studies on CoV-related complexes. Proc. Natl. Acad. Sci. USA. 2021;118 - PMC - PubMed
    1. Terashi G., Kihara D. De novo main-chain modeling for EM maps using MAINMAST. Nat. Commun. 2018;9:1618–1711. - PMC - PubMed
    1. Wang Z., Schröder G.F. Real-space refinement with DireX: from global fitting to side-chain improvements. Biopolymers. 2012;97:687–697. - PubMed
    1. Trabuco L.G., Villa E., et al. Schulten K. Flexible fitting of atomic structures into electron microscopy maps using molecular dynamics. Structure. 2008;16:673–683. - PMC - PubMed

Publication types

LinkOut - more resources