

Microbe-induced drought tolerance by ABA-mediated root architecture and epigenetic reprogramming
- PMID: 37278352
- PMCID: PMC10398642
- DOI: 10.15252/embr.202256754
Microbe-induced drought tolerance by ABA-mediated root architecture and epigenetic reprogramming
Abstract
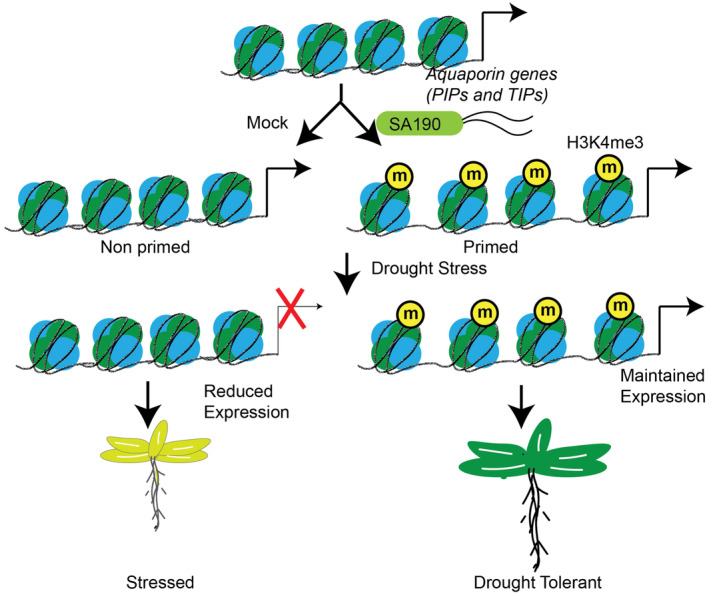
The use of beneficial microbes to mitigate drought stress tolerance of plants is of great potential albeit little understood. We show here that a root endophytic desert bacterium, Pseudomonas argentinensis strain SA190, enhances drought stress tolerance in Arabidopsis. Transcriptome and genetic analysis demonstrate that SA190-induced root morphogenesis and gene expression is mediated via the plant abscisic acid (ABA) pathway. Moreover, we demonstrate that SA190 primes the promoters of target genes in an epigenetic ABA-dependent manner. Application of SA190 priming on crops is demonstrated for alfalfa, showing enhanced performance under drought conditions. In summary, a single beneficial root bacterial strain can help plants to resist drought conditions.
Keywords: ABA; H3K4me3; drought stress; microbiome; water use efficiency (WUE).
© 2023 The Authors. Published under the terms of the CC BY NC ND 4.0 license.
Conflict of interest statement
The authors declare that they have no conflict of interest.
Figures

- A
Graphical representation of workflow for plant screening assay under 25% PEG.
- B
Growth of non‐colonized and SA190‐colonized Arabidopsis plants grown under drought stress proxy for 21 days (½ MS + 25% PEG) or ambient conditions for 14 days (½ MS).
- C–F
(C) Total fresh weight, (D) Total dry weight, (E) Primary root length and (F) Lateral root density of 21‐day‐old, non‐colonized (Mock) and SA190‐colonized plants upon growth for 16 days on ½ MS or ½ MS + 25% PEG. Boxplot shows data from three independent biological replicates (technical replicates n = 18–24) where whiskers represents minimum and maximum values, “+” indicates mean and horizontal line represents median. Asterisks indicate the statistical differences based on the Student's t‐test (***P < 0.001).
- G, H
(G) Growth and (H) Survival percentage of mock‐ and SA190‐colonized plants in jiffy pots grown upon watering for 2 weeks, no watering for 3 weeks and after 1 week of re‐watering. All plots represent the mean of three biological replicates (technical replicates n = 36). Whiskers represents minimum and maximum values, “+” indicates mean and horizontal line represents median. Asterisks indicate the statistical differences based on the Student's t‐test (***P < 0.001).
- I
Alfalfa biomass yield in sandy soil open field agriculture with normal or reduced irrigation (30% reduction). The differences in biomass yield between different treatments are indicated in percent (%) and significance at P < 0.05 is indicated by asterisks (*). Non‐colonized plants are indicated in gray and SA190‐colonized in green. Values in the graph represents mean of six biological replicates with ±SEM.
- J
Confocal microscopy showing the colonization of SA190:GFP on 5‐day‐old seedlings grown on ½ MS and 25% PEG. Green signal corresponds to GFP‐tagged SA190 while in magenta are plant cell walls stained with propidium iodide (PI). Bar indicates 100 nm.
- K
SA190 colonization levels in Arabidopsis under normal (½ MS) and drought proxy (½ MS + 25% PEG) conditions as quantified by colony forming units of bacteria per mg of plant fresh weight. Boxplot shows data from four independent biological replicates where whiskers represents minimum and maximum values, “+” indicates mean and horizontal line represents median. Asterisks indicate the statistical differences based on the Student's t‐test (*P < 0.05, ***P < 0.001).

- A, B
(A) Shoot fresh weight and (B) Root fresh weight (b) of 16‐day‐old mock‐ and SA190‐colonized plants grown on ½ MS medium and ½ MS + PEG medium.
- C, D
(C) Shoot dry weight and (D) Root dry weight of 16‐day‐old mock‐ and SA190‐colonized plants grown on ½ MS medium and ½ MS + PEG medium.


- A
Heatmap showing hierarchical clustering of up‐ and downregulated DEGs profiles in response to PEG (25%), SA190 or both treatments based on root RNA‐Seq analysis. Quantified read counts are normalized for genes. Colors indicate normalized expression levels. q < 0.05 and a fold change cut‐off was set to log2 > 1 for up‐ and log2 > −1 for down regulated genes.
- B, C
GO term analysis of differentially expressed genes of SA190‐colonized (PEG+190) compared with non‐colonized (PEG) plants under drought proxy conditions (½ MS + 25% PEG).
- D, E
Total fresh weight and root fresh weight of 21 days old non‐colonized (Mock) and SA190‐colonized (SA190) Col‐0, aba2‐1 and qpyr/pyl plants grown under drought proxy conditions (½ MS + 25% PEG).
- F, G
Primary root length and Lateral root density of 21‐day‐old, mock‐ and SA190‐colonized Col‐0, aba2‐1 and qpyr/pyl plants upon growth for 16 days on ½ MS + 25% PEG.

- A, B
Total fresh weight and root fresh weight of 21‐day‐old non‐colonized (Mock) and SA190‐colonized (SA190) Col‐0, aba2‐1 and qpyr/pyl plants grown under non‐stress conditions (½ MS).
- C, D
Primary root length and lateral root density of 21‐day‐old, mock‐ and SA190‐colonized Col‐0, aba2‐1 and qpyr/pyl plants upon growth for 16 days on ½ MS plates.


Heat map of expression profile of differentially regulated PIP and TIP genes in root RNA‐Seq analysis.
Relative gene expression of aquaporin PIP and TIP genes by qRT‐PCR analysis normalized to tubulin levels in 21‐day‐old mock‐ and SA190‐colonized roots of Arabidopsis grown for 16 days on ½ MS with or without 25% PEG.
Relative gene expression of aquaporin PIP and TIP genes by qRT‐PCR analysis in Col‐0, aba2‐1 and qpyr/pyl mutants normalized to tubulin levels in 21‐days old mock‐ and SA190‐colonized roots of Arabidopsis grown for 16 days on ½ MS with or without 25% PEG.


- A, B
Total fresh weight of 21‐day‐old non‐colonized‐ (Mock) and SA190‐colonized (SA190) Col‐0, tip2;1 and qpip plants grown for 16 days under normal (½ MS) or drought stress proxy conditions (½ MS + 25% PEG).
- C
Quantification of SA190 colonization efficiency in 21‐day‐old SA190‐colonized (SA190) Col‐0, tip2;1 and qpip plants grown for 16 days under normal (½ MS) or drought conditions (½ MS + 25% PEG).
- D, E
Total fresh weight of mock‐ and SA190‐colonized 21‐day‐old Arabidopsis plants grown for 16 days under normal on (½ MS) or PEG drought stress proxy (½ MS + 25% PEG) conditions supplemented with the aquaporin inhibitors HgCl2 (38.2 μM) or AgNO3 (5 μM).
- F
The percentage of leaf relative water content (RWC) of 21‐day‐old mock‐ or SA190‐colonized plants grown for 16 days under drought stress proxy (½ MS + 25% PEG) conditions. The RWC was calculated as the formula RWC (%) = [(FW‐DW)/(TW‐DW)] × 100, where FW is fresh weight, DW is dry weight, and TW is the weight of fully turgid leaves.
- G
Transpiration rate of mock‐ or SA190‐colonized 21‐day‐ old plants after transfer of 5‐day‐old seedlings from ½ MS to ½ MS ± 25% PEG. Water loss was quantified by calculating the changes in fresh weight for 30 min with reading at every 5 min interval.
- H, I
Comparison of stomatal aperture of SA190‐ and non‐colonized 21‐day‐old plants grown for 16 days under non‐stress (½ MS) or drought stress proxy (½ MS + 25% PEG) conditions. Scale bar = 20 μm.
- J
Water use efficiency (WUE) of 4‐week‐old mock‐ or SA190‐colonized plants under PEG drought stress proxy conditions. WUE was calculated as mg of dry weight produced per ml of water used.

- A, B
Total fresh weight of mock‐ and SA190‐colonized 16‐day‐old ethylene mutants on (A) ½ MS or (B) 25%PEG. Boxplot shows data from three independent biological replicates (technical replicates n = 18–24) where whiskers represents minimum and maximum values, “+” indicates mean and horizontal line represents median. Asterisks indicate a statistical difference based on the Student's t‐test (***P < 0.001).
- C
The percentage of leaf relative water content (RWC) of 21‐day‐old mock‐ or SA190‐colonized plants grown for 16 days under normal (½ MS) conditions. The RWC was calculated as the formula RWC (%) = [(FW−DW)/(TW−DW)] × 100, where FW is fresh weight, DW is dry weight, and TW is the weight of fully turgid leaves.
- D
Comparison of stomatal aperture of SA190‐ and non‐colonized 21‐day‐old plants grown for 16 days under non‐stress (½ MS) conditions. Scale bar = 20 μm.
- E
Water use efficiency (WUE) of 4‐week‐old mock‐ or SA190‐colonized plants grown under non‐stress (½ MS) conditions. WUE was calculated as mg of dry weight produced per ml of water used.
References
-
- Bulgarelli D, Rott M, Schlaeppi K, Loren V, van Themaat E, Ahmadinejad N, Assenza F, Rauf P, Huettel B, Reinhardt R et al (2012) Revealing structure and assembly cues for Arabidopsis root‐inhabiting bacterial microbiota. Nature 488: 91–95 - PubMed
-
- Chen K, Li G‐J, Bressan RA, Song C‐P, Zhu J‐K, Zhao Y (2020) Abscisic acid dynamics, signaling, and functions in plants. J Integr Plant Biol 62: 25–54 - PubMed
Publication types
MeSH terms
Substances
Associated data
- Actions
LinkOut - more resources
Full Text Sources
Other Literature Sources
