. 2023 Jun 6:12:e78187.
doi: 10.7554/eLife.78187.

The generation of HepG2 transmitochondrial cybrids to reveal the role of mitochondrial genotype in idiosyncratic drug-induced liver injury

Affiliations

The generation of HepG2 transmitochondrial cybrids to reveal the role of mitochondrial genotype in idiosyncratic drug-induced liver injury

Amy Louise Ball et al. Elife. .

Abstract

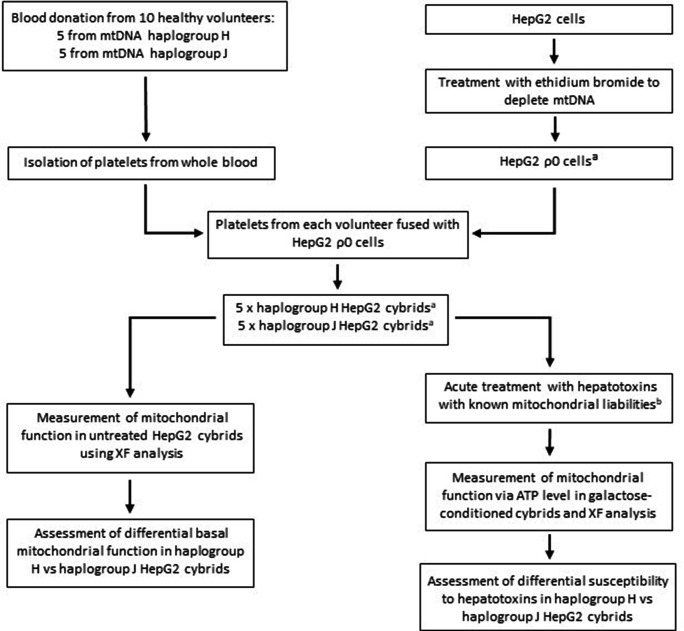
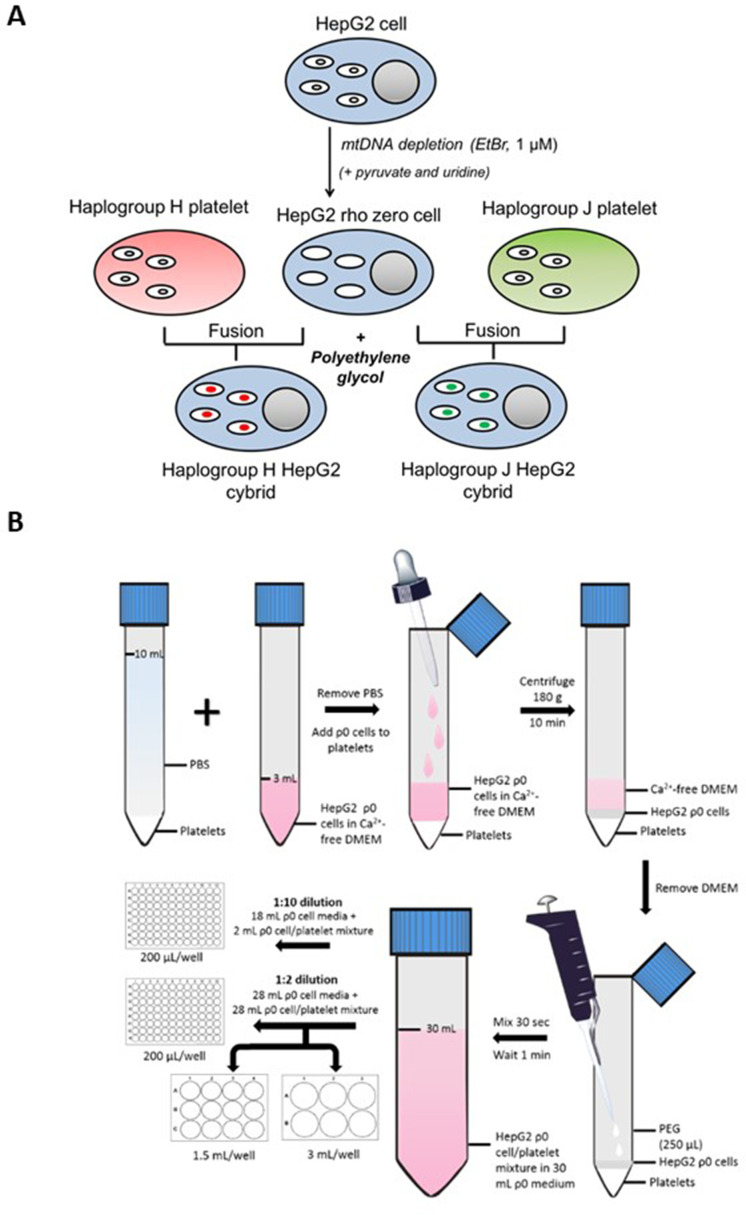
Background: Evidence supports an important link between mitochondrial DNA (mtDNA) variation and adverse drug reactions such as idiosyncratic drug-induced liver injury (iDILI). Here, we describe the generation of HepG2-derived transmitochondrial cybrids, to investigate the impact of mtDNA variation on mitochondrial (dys)function and susceptibility to iDILI. This study created 10 cybrid cell lines, each containing distinct mitochondrial genotypes of haplogroup H or haplogroup J backgrounds.

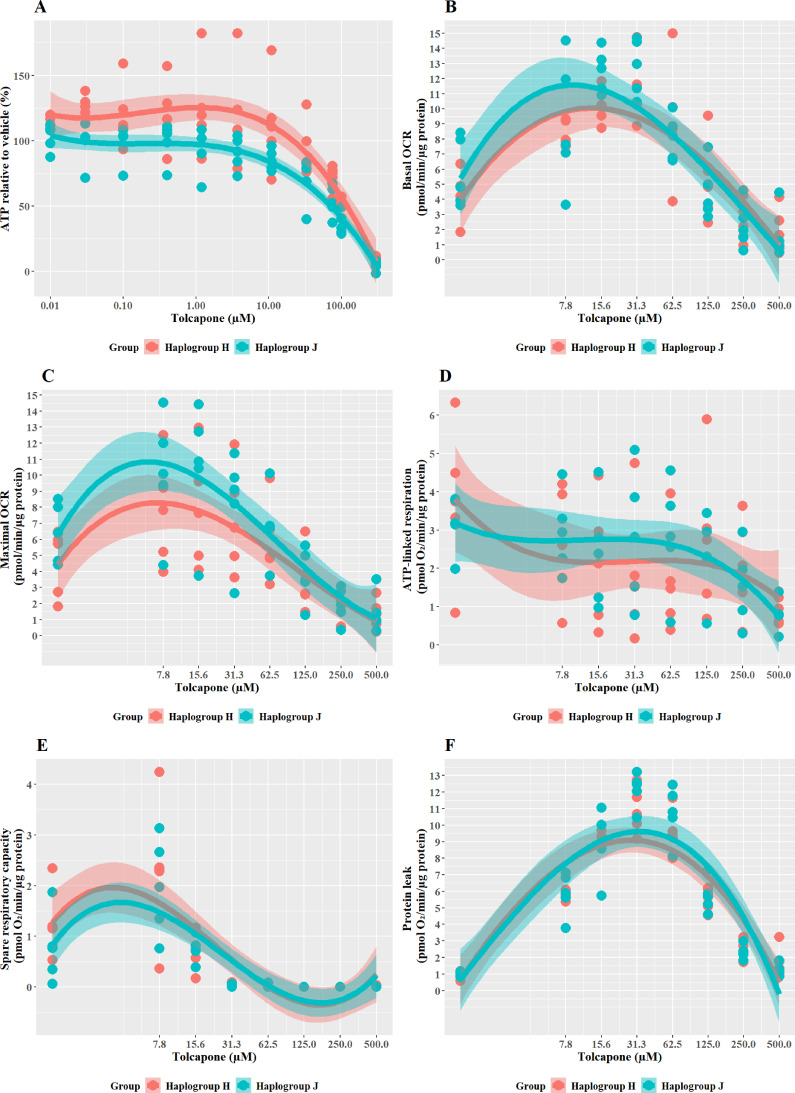
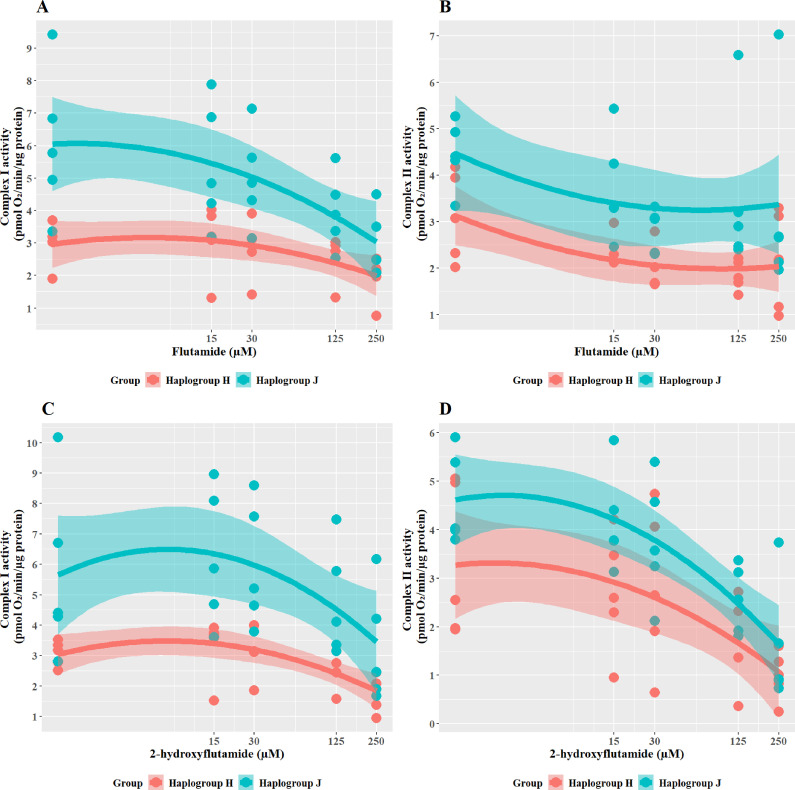
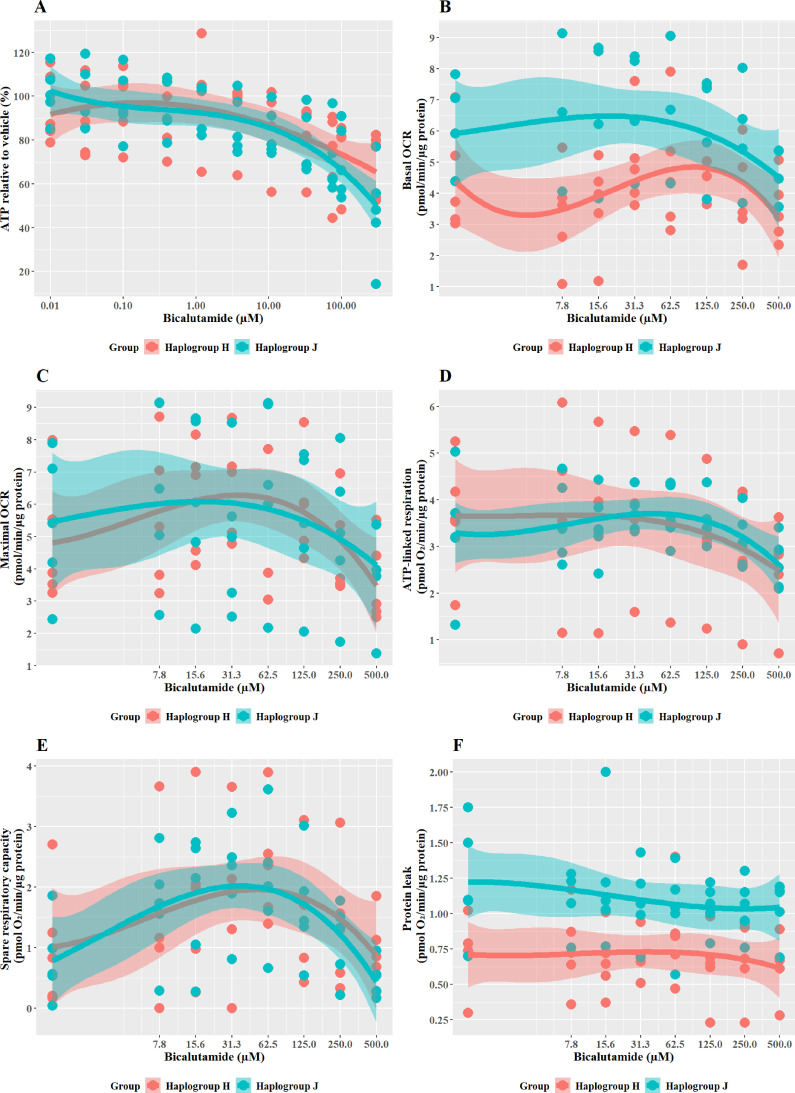
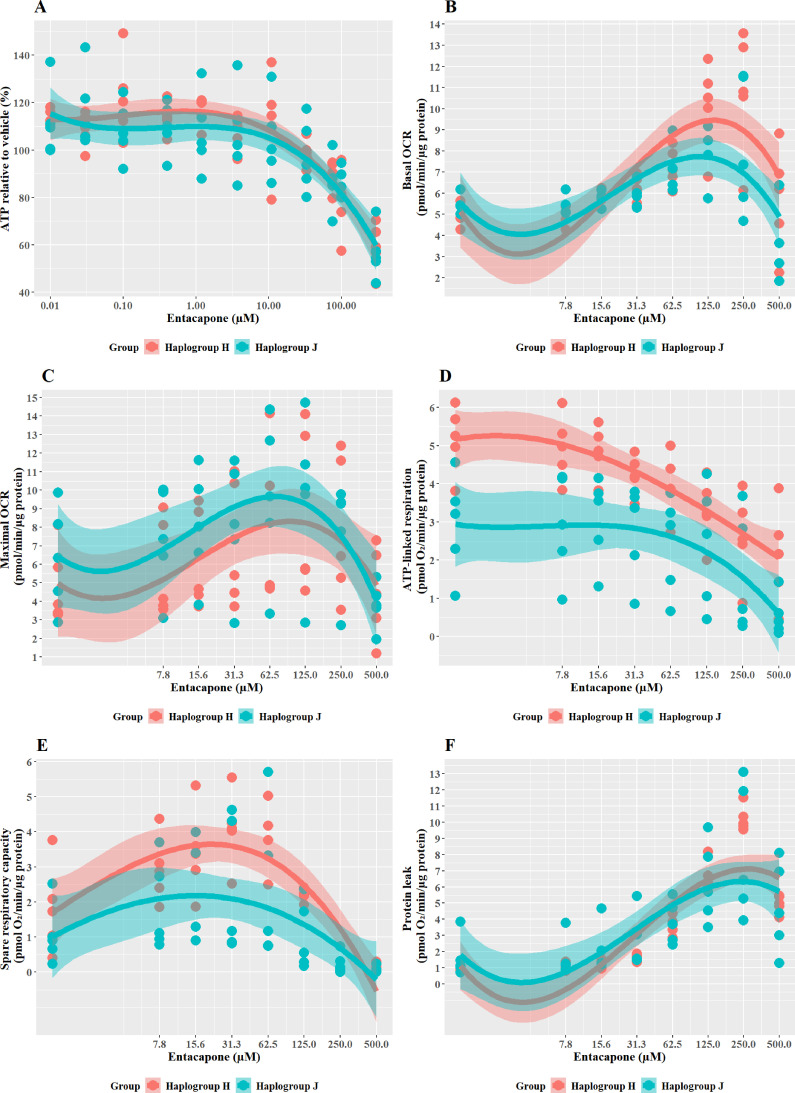
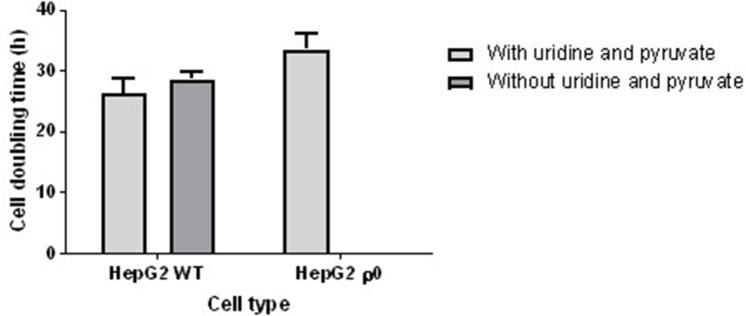
Methods: HepG2 cells were depleted of mtDNA to make rho zero cells, before the introduction of known mitochondrial genotypes using platelets from healthy volunteers (n=10), thus generating 10 transmitochondrial cybrid cell lines. The mitochondrial function of each was assessed at basal state and following treatment with compounds associated with iDILI; flutamide, 2-hydroxyflutamide, and tolcapone, and their less toxic counterparts bicalutamide and entacapone utilizing ATP assays and extracellular flux analysis.

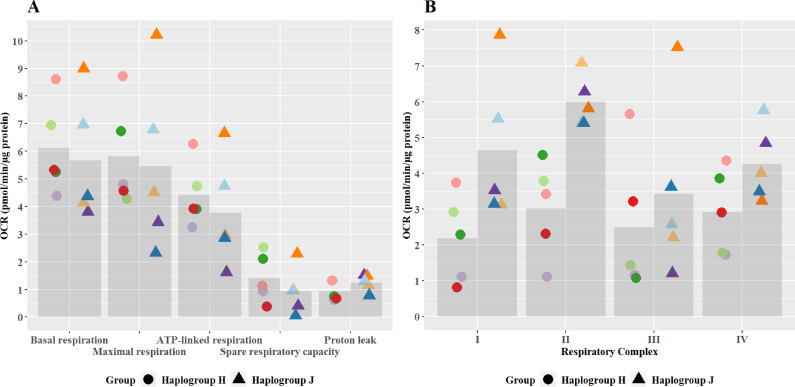
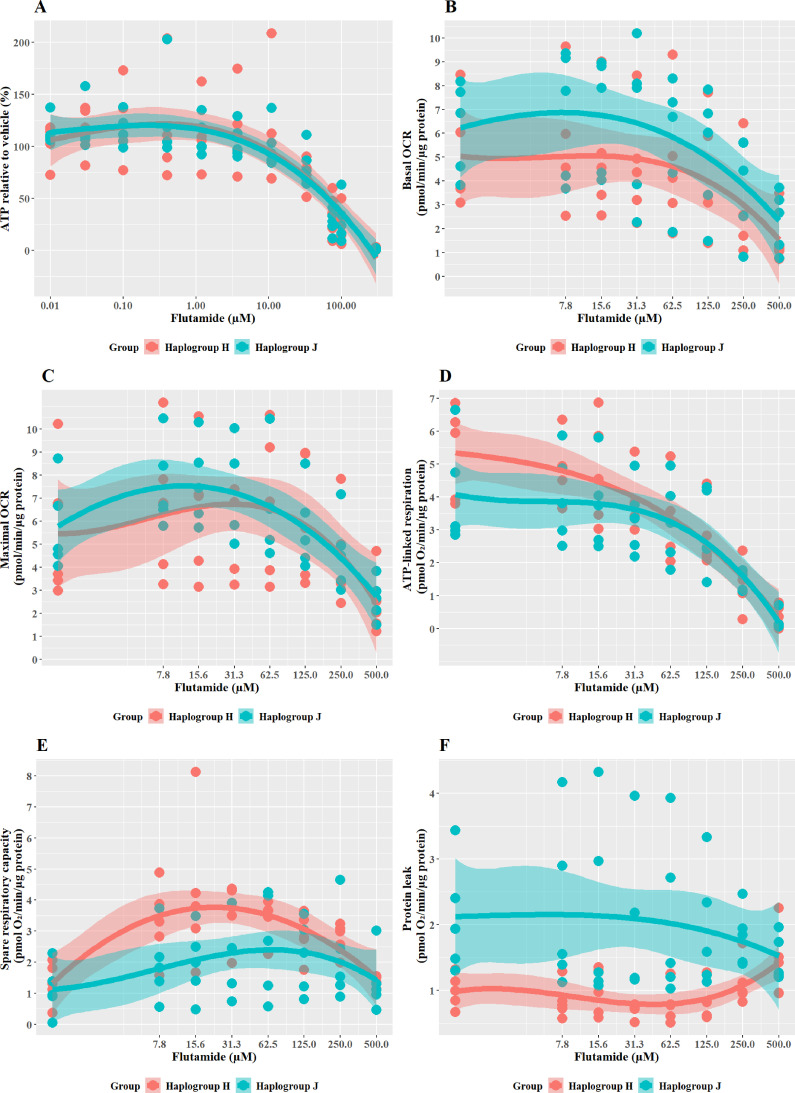
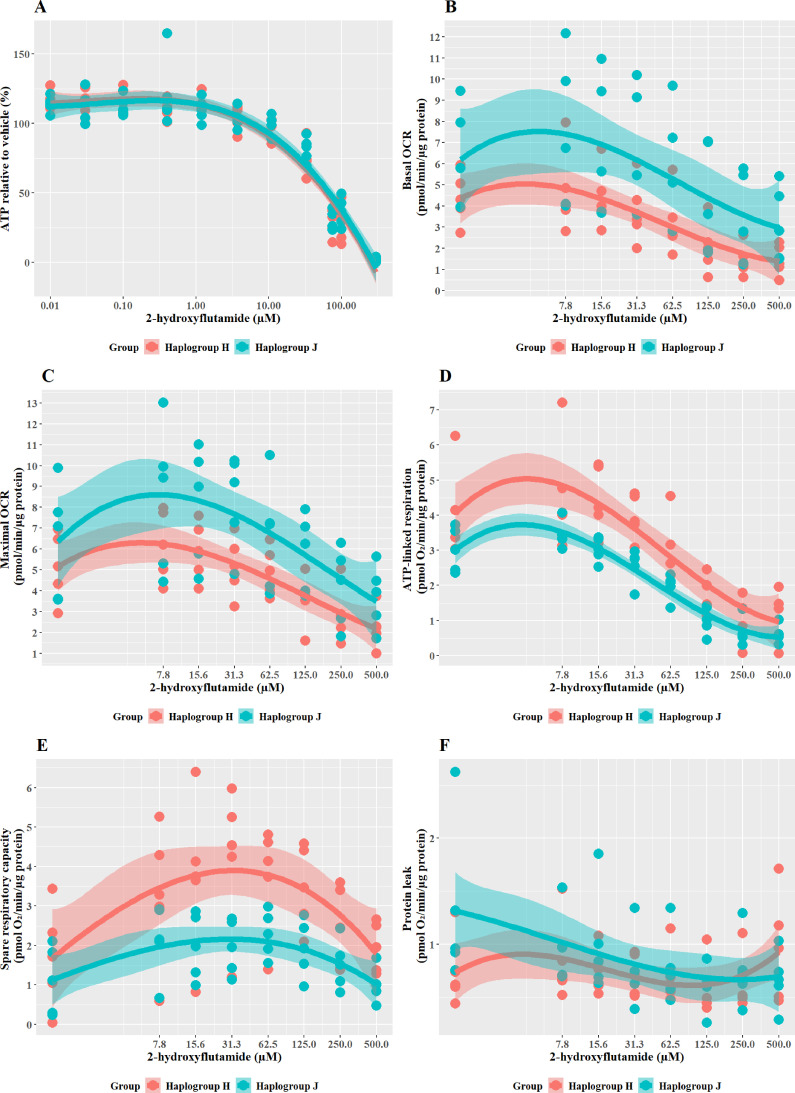
Results: Whilst only slight variations in basal mitochondrial function were observed between haplogroups H and J, haplogroup-specific responses were observed to the mitotoxic drugs. Haplogroup J showed increased susceptibility to inhibition by flutamide, 2-hydroxyflutamide, and tolcapone, via effects on selected mitochondrial complexes (I and II), and an uncoupling of the respiratory chain.

Conclusions: This study demonstrates that HepG2 transmitochondrial cybrids can be created to contain the mitochondrial genotype of any individual of interest. This provides a practical and reproducible system to investigate the cellular consequences of variation in the mitochondrial genome, against a constant nuclear background. Additionally, the results show that inter-individual variation in mitochondrial haplogroup may be a factor in determining sensitivity to mitochondrial toxicants.

Funding: This work was supported by the Centre for Drug Safety Science supported by the Medical Research Council, United Kingdom (Grant Number G0700654); and GlaxoSmithKline as part of an MRC-CASE studentship (grant number MR/L006758/1).

Keywords: HepG2; drug safety; drug-induced liver injury; human; medicine; mitochondria; mtDNA; transmitochondrial cybrid.


Conflict of interest statement

AB, AA holds a grant from GlaxoSmithKline (GSK) for this work. The author has no other competing interests to declare, CJ salary funded by Janssen Pharmaceutical, paid to University of Liverpool. The author has no other competing interests to declare, ML is an employee of GlaxoSmithKline (GSK), JL is an employee of GlaxoSmithKline (GSK). Unpaid role as a member of the Investigative Toxicology Leaders Forum (ITLF) representing GSK on this group. Provides unpaid consultation to Cambridge University in areas of drug development. The author has no other competing interests to declare, AC holds a grant from GlaxoSmithKline (GSK) for this work and received other funding from Janssen in 2017-2020 (paid directly to University of Liverpool). The author has no other competing interests to declare

Figures

Figure 1.
Figure 1.. Study overview.
a HepG2 ρ0 cells were characterized to ensure the complete depletion of mtDNA and the expression of mtDNA-encoded proteins was confirmed in the HepG2 cybrids. Methods of characterization are described in the Supplementary information. b Flutamide, 2-hydroxyflutamide, and tolcapone, alongside non-hepatotoxic structural counterparts; bicalutamide and entacapone. Abbreviations: mtDNA, mitochondrial DNA; ρ0, rho zero; XF, extracellular flux.
Figure 2.
Figure 2.. Basal mitochondrial function and respiratory complex activity in haplogroup H and J HepG2 cybrids.
(A) Untreated haplogroup H and J cybrids were assessed using extracellular flux analysis and a mitochondrial stress test to measure: basal respiration, maximal respiration, ATP-linked respiration, spare respiratory capacity, and proton leak. (B) Untreated haplogroup H and J cybrids were assessed using extracellular flux analysis and respiration was stimulated by the supply of respiratory complex-specific substrates. Complex I-IV activity was defined as complex I-IV-driven maximal respiration. Data are presented from five haplogroup H cybrid cell lines and five haplogroup J cell lines (n=5 experiments were performed on each cybrid cell line). Each color point represents a single cybrid cell line. Abbreviations: OCR, oxygen consumption rate. Source data: Figure 2—source data 1 file.xslx. The results of all statistical tests can be viewed in Supplementary file 2 – tab 2a.
Figure 3.
Figure 3.. The effect of flutamide on ATP levels and mitochondrial respiratory function in haplogroup H and J HepG2 cybrids.
(A) Cybrids were treated (2 hr) with up to 300 µM flutamide in a galactose medium. ATP values are expressed as a percentage of the vehicle control. (B–F) Changes in basal respiration, maximal respiration, ATP-linked respiration, spare respiratory capacity, and proton leak following acute treatment with flutamide (up to 500 µM). Data are presented from five haplogroup H cybrid cell lines and five haplogroup J cell lines (n=5 experiments were performed on each cybrid cell line). Shaded areas represent a 95% confidence interval of the fitted curve. Abbreviations: OCR, oxygen consumption rate. Source data: Figure 3—source data 1 file.xslx. The results of all statistical tests can be viewed in Supplementary file 2 – tab 2b.
Figure 4.
Figure 4.. The effect of 2-hydroxyflutamide upon ATP levels and mitochondrial respiratory function in haplogroup H and J HepG2 cybrids.
(A) Cybrids were treated (2 hr) with up to 300 µM 2-hydroxyflutamide in a galactose medium. ATP values are expressed as a percentage of those of the vehicle control. (B–F) Changes in basal respiration, maximal respiration, ATP-linked respiration, spare respiratory capacity, and proton leak following acute treatment with 2-hydroxyflutamide (up to 500 µM). Data are presented from five haplogroup H cybrid cell lines and five haplogroup J cell lines (n=5 independent experiments were performed on each cybrid cell line). Shaded areas represent a 95% confidence interval of the fitted curve. Abbreviations: OCR, oxygen consumption rate. Source data: Figure 4—source data 1 file.xslx. The results of all statistical tests can be viewed in Supplementary file 2 – tab 2c.
Figure 5.
Figure 5.. The effect of flutamide and 2-hydroxyflutamide upon respiratory complex I and II in haplogroup H and J HepG2 cybrids.
Permeabilized cybrids were acutely treated with flutamide (A, B) or 2-hydroxyflutamide (C, D) (up to 250 µM) before a mitochondrial stress test using extracellular flux analysis. Complex I/II activity was defined as complex I/II-driven maximal respiration. Data are presented from five haplogroup H cybrid cell lines and five haplogroup J cell lines (n=5 experiments were performed on each cybrid cell line). Shaded areas represent a 95% confidence interval of the fitted curve. Source data: Figure 5—source data 1 file.xslx. The results of all statistical tests can be viewed in Supplementary file 2 – tab 2d.
Figure 6.
Figure 6.. The effect of tolcapone on ATP levels and mitochondrial respiratory function in haplogroup H and J HepG2 cybrids.
(A) Cybrids were treated (2 hr) with up to 500 µM tolcapone in a galactose medium. ATP values are expressed as a percentage of those of the vehicle control. (B–F) Changes in basal respiration, maximal respiration, ATP-linked respiration, spare respiratory capacity, and proton leak following acute treatment with tolcapone (up to 500 µM). Data are presented from five haplogroup H cybrid cell lines and five haplogroup J cell lines (n=5 experiments were performed on each cybrid cell line). Shaded areas represent a 95% confidence interval of the fitted curve Abbreviations: OCR, oxygen consumption rate. Source data: Figure 6—source data 1 file.xslx. The results of all statistical tests can be viewed in Supplementary file 2 – Table 2e.
Figure 7.
Figure 7.. The effect of bicalutamide upon ATP levels and mitochondrial respiratory function in haplogroup H and J HepG2 cybrids.
(A) Cybrids were treated (2 hr) with up to 500 µM bicalutamide in a galactose medium. ATP values are expressed as a percentage of those of the vehicle control. (B–F) Changes in basal respiration, maximal respiration, ATP-linked respiration, spare respiratory capacity, and proton leak following acute treatment with bicalutamide (up to 500 µM). Data are presented fromfive haplogroup H cybrid cell lines and five haplogroup J cell lines (n=5 independent experiments were performed on each cybrid cell line). Shaded areas represent a 95% confidence interval of the fitted curve. Abbreviations: OCR, oxygen consumption rate. Source data: Figure 7—source data 1 file.xslx. The results of all statistical tests can be viewed in Supplementary file 2 – Table 2f.
Figure 8.
Figure 8.. The effect of entacapone upon ATP levels and mitochondrial respiratory function in haplogroup H and J HepG2 transmitochondrial cybrids.
(A) Cybrids were treated (2 hr) with up to 500 µM entacapone in a galactose medium. ATP values are expressed as a percentage of those of the vehicle control. (B–F) Changes in basal respiration, maximal respiration, ATP-linked respiration, spare respiratory capacity, and proton leak following acute treatment with entacapone (up to 500 µM). Data are presented from five haplogroup H cybrid cell lines and five haplogroup J cell lines (n=5 independent experiments were performed on each cybrid cell line). Shaded areas represent a 95% confidence interval of the fitted curve. Abbreviations: OCR, oxygen consumption rate. Source data: Figure 8—source data 1 file.xslx. The results of all statistical tests can be viewed in Supplementary file 2 – tab 2g.
Figure 9.
Figure 9.. Generation of HepG2 transmitochondrial cybrids.
(A) Schematic overview of HepG2 transmitochondrial cybrid generation. (B) Experimental procedure for the fusion of HepG2 ρ0 cells and platelets to generate HepG2 transmitochondrial cybrids.
Figure 9—figure supplement 1.
Figure 9—figure supplement 1.. Cell doubling time of HepG2 wild-type (WT) and HepG2 rho zero (ρ0) cells.
The two cell types were cultured in media with or without uridine and pyruvate and the growth rate was calculated. The dependence of HepG2 ρ0 cells on pyruvate and uridine meant that culture media devoid of these constituents was able to select for the successful depletion of mitochondrial DNA (mtDNA) and the resultant non-functional electron transport chain in ethidium bromide (EtBr)-treated cells. Concordantly, HepG2 WT cells had a similar doubling time in media with or without these additives, averaging 26.2 hr. In contrast, HepG2 ρ0 cells exhibited no growth without uridine and pyruvate and an average doubling time of 27.6 hr when in media containing these two constituents. Data are presented as mean SEM of n=3 experiments. Source data: Figure 9—figure supplement 1—source data 1file.xslx.
Figure 9—figure supplement 2.
Figure 9—figure supplement 2.. Representative western blots of HepG2 wild-type (WT), rho zero, and cybrid cell lysates.
10 µg of lysate protein was resolved by SDS-PAGE and probed for subunits of complexes I (NDUFB8), II (Iron-sulphur protein (IP) 30 KDa), III (Core 2), IV (II), V (alpha). All nuclear DNA and mtDNA-encoded subunits of the electron transport chain which were probed for were present in HepG2 WT and cybrid cells. However, ρ0 cells did not express the mtDNA-encoded subunit of complex IV. Notably, despite all the other subunits being encoded in the nuclear DNA, it was only the alpha subunit of ATP synthase that was retained in the ρ0 cells. Abbreviations: mtDNA, mitochondrial DNA; nDNA, nuclear DNA. Source data: Figure 9—figure supplement 2—source data 1 – raw image.pptx.

Update of

  • doi: 10.1101/2022.03.21.485109

Similar articles

Cited by

References

    1. Alfirevic A, Gonzalez-Galarza F, Bell C, Martinsson K, Platt V, Bretland G, Evely J, Lichtenfels M, Cederbrant K, French N, Naisbitt D, Park BK, Jones AR, Pirmohamed M. In Silico analysis of HLA associations with drug-induced liver injury: use of a HLA-genotyped DNA Archive from healthy volunteers. Genome Medicine. 2012;4:51. doi: 10.1186/gm350. - DOI - PMC - PubMed
    1. Amuthan G, Biswas G, Ananadatheerthavarada HK, Vijayasarathy C, Shephard HM, Avadhani NG. Mitochondrial stress-induced calcium signaling, Phenotypic changes and invasive behavior in human lung carcinoma A549 cells. Oncogene. 2002;21:7839–7849. doi: 10.1038/sj.onc.1205983. - DOI - PubMed
    1. Bale SS, Vernetti L, Senutovitch N, Jindal R, Hegde M, Gough A, McCarty WJ, Bakan A, Bhushan A, Shun TY, Golberg I, DeBiasio R, Usta BO, Taylor DL, Yarmush ML. In vitro platforms for evaluating liver toxicity. Experimental Biology and Medicine. 2014;239:1180–1191. doi: 10.1177/1535370214531872. - DOI - PMC - PubMed
    1. Ball AL, Kamalian L, Alfirevic A, Lyon JJ, Chadwick AE. Identification of the additional mitochondrial liabilities of 2-Hydroxyflutamide when compared with its parent compound, Flutamide in Hepg2 cells. Toxicological Sciences. 2016;153:341–351. doi: 10.1093/toxsci/kfw126. - DOI - PMC - PubMed
    1. Ball AL, Bloch KM, Rainbow L, Liu X, Kenny J, Lyon JJ, Gregory R, Alfirevic A, Chadwick AE. Assessment of the impact of mitochondrial genotype upon drug-induced mitochondrial dysfunction in platelets derived from healthy volunteers. Archives of Toxicology. 2021;95:1335–1347. doi: 10.1007/s00204-021-02988-3. - DOI - PMC - PubMed