. 2023 Jun 1;16(6):dmm049531.
doi: 10.1242/dmm.049531. Epub 2023 Jun 6.

Ultrasound-stimulated microbubbles enhanced vascular disruption in fractionated radiotherapy-treated tumours via ASMase activation

Affiliations

Ultrasound-stimulated microbubbles enhanced vascular disruption in fractionated radiotherapy-treated tumours via ASMase activation

Kai Xuan Leong et al. Dis Model Mech. .

Abstract

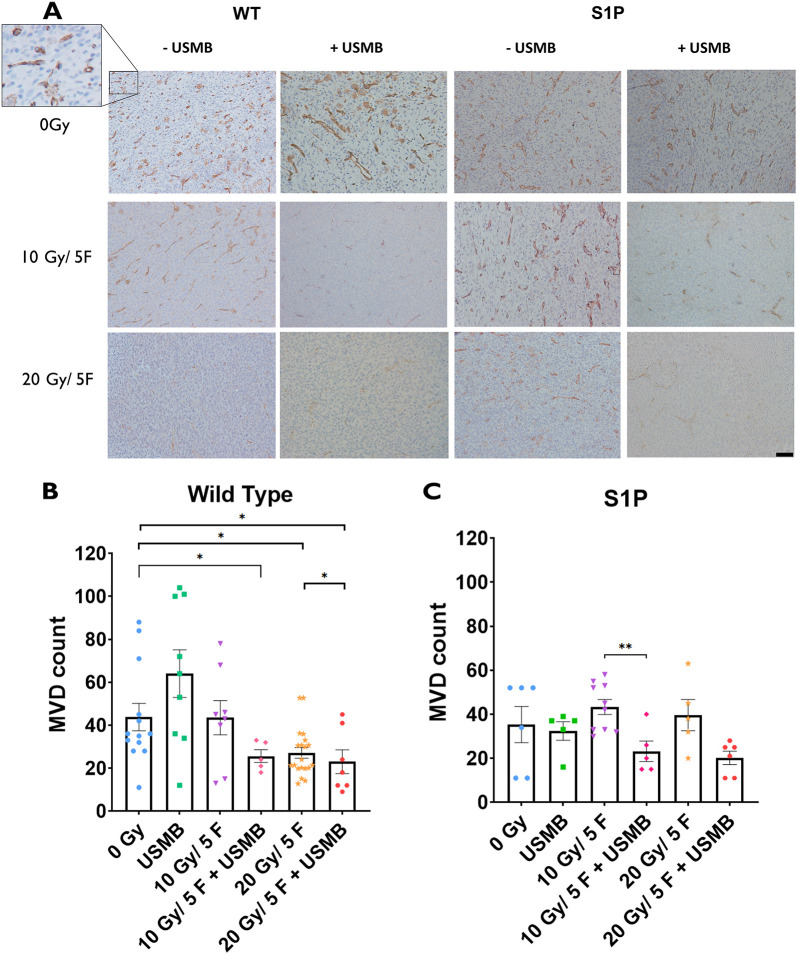
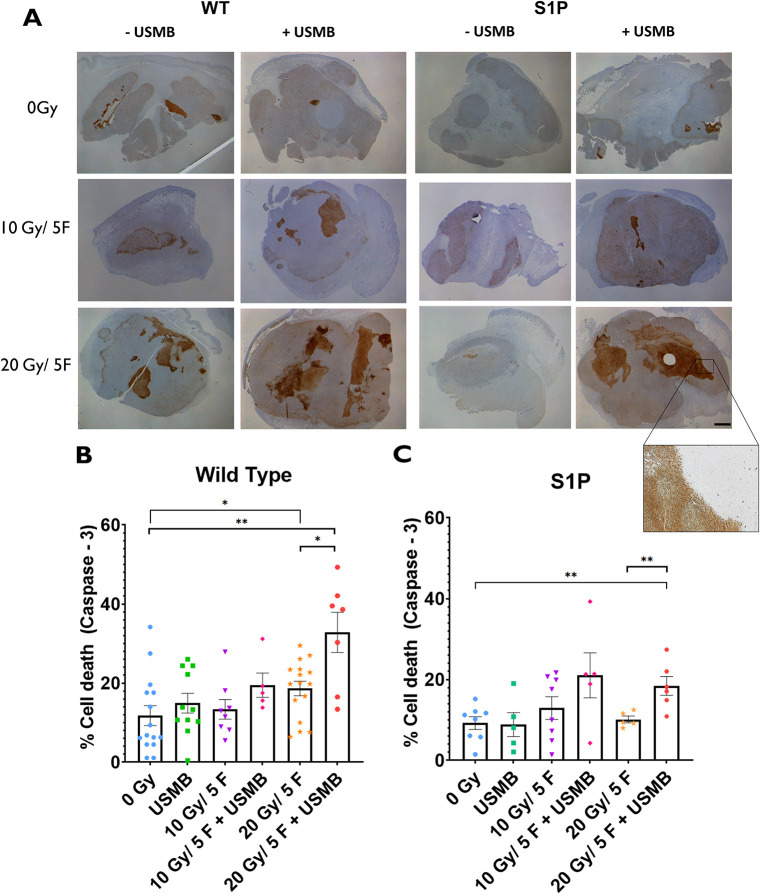
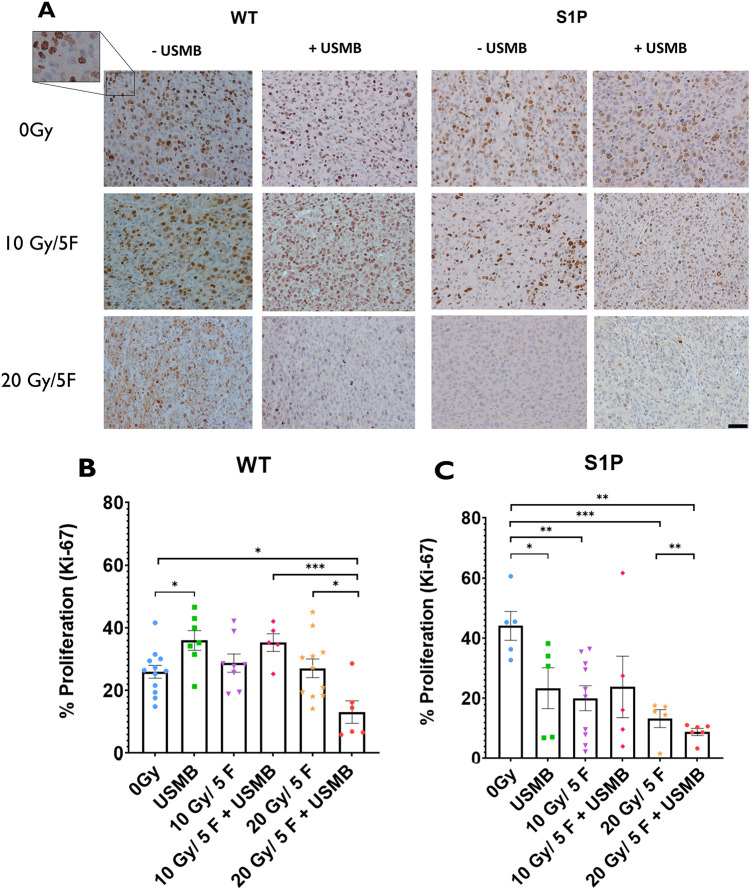
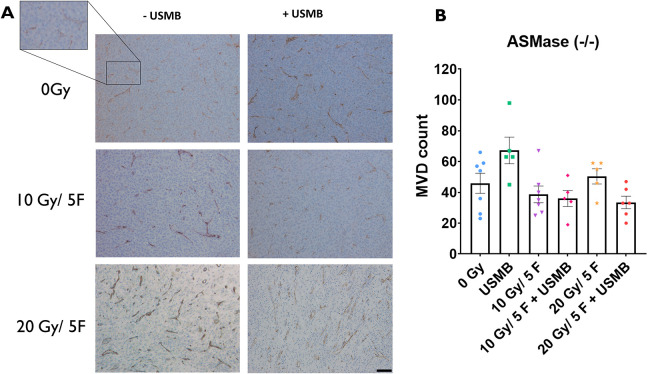
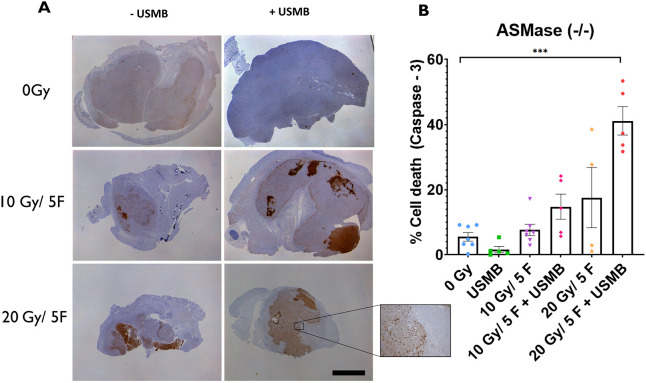
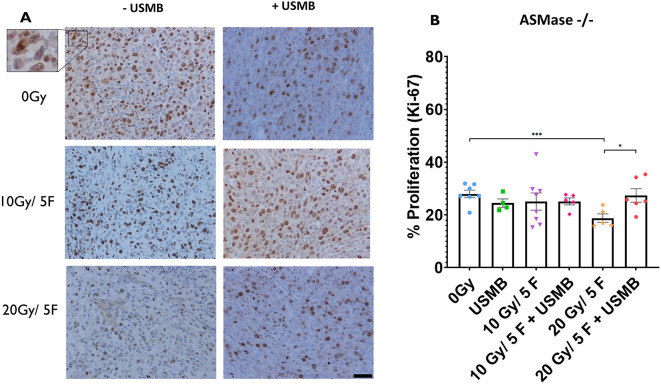
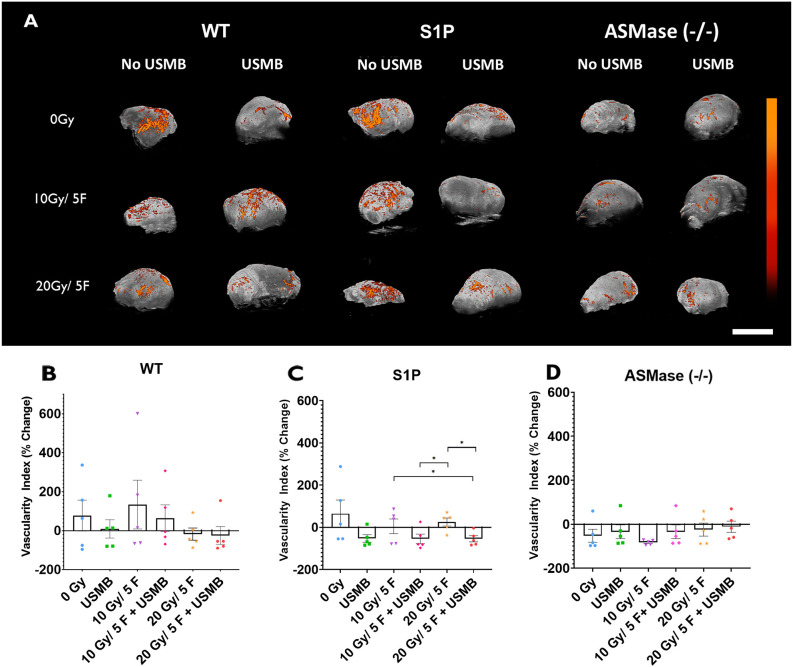
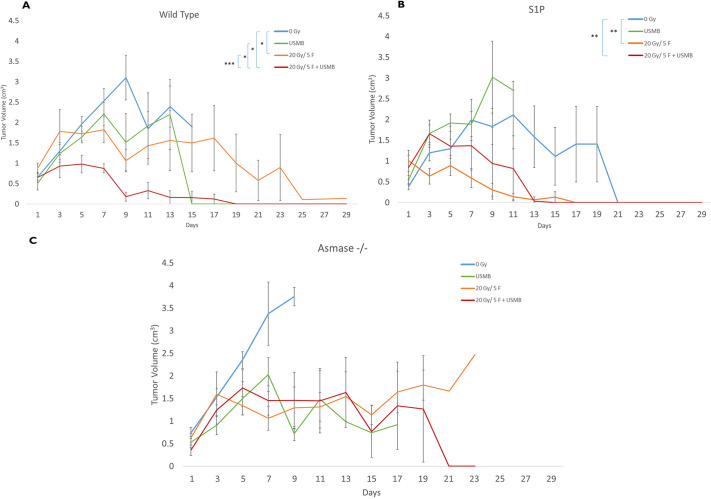
Recent studies have indicated that radiotherapy affects tumour vasculature as well as tumour cells. The use of ultrasound-stimulated microbubbles (USMB) can potentially enhance the effects of radiotherapy through the activation of the acid sphingomyelinase [ASMase or sphingomyelin phosphodiesterase 1 (SMPD1)]-ceramide pathway. ASMase knockout (ASMase-/-) and wild-type (WT) mice bearing fibrosarcoma (MCA/129 tumour line) were treated with 10 Gy or 20 Gy in five fractions alongside or independently of USMB treatments. The results indicated that tumour responses to fractionated radiotherapy (fXRT) were enhanced when fXRT was coupled with USMB as part of the treatment regimen. Sphingosine-1-phosphate (S1P)-treated mice and ASMase-/- mice demonstrated radioresistance against fXRT alone, whereas only ASMase-/- mice showed radioresistance against fXRT treatment alone and when combined with USMB. Results indicated that in WT and S1P-treated cohorts, the use of USMB with fXRT enhanced the tumour response compared to use of USMB or fXRT alone. Although in WT and S1P-treated cohorts, there was enhanced vascular disruption, ASMase-/- cohorts demonstrated no significant vascular disruption, indicating the importance of ASMase in facilitating vascular changes in response to fXRT and USMB treatment.

Keywords: Focused ultrasound; Fractionated radiation therapy; PC3 xenograft; Ultrasound stimulated microbubble therapy.


Conflict of interest statement

Competing interests The authors declare no competing or financial interests.

Figures

Fig. 1.
Fig. 1.
Microvascular changes within MCA/129 fibrosarcoma tumours post radiation treatment in WT and S1P-treated mice. (A) Anti-CD31 antibody staining of endothelial cells lining blood vessels allowed for visualization of MCA/129 mouse fibrosarcoma tumours in WT or S1P-treated mice. Scale bar: 40 µm. (B,C) Individual vessels were quantified to measure microvascular density (MVD) under a 10× objective lens for WT (B) and S1P-treated (C) groups. For WT mice: 0 Gy (n=13), 10 Gy/5F (n=8), 20 Gy/5F (n=20), USMB only (n=9), 10 Gy/5F+USMB (n=5), 20 Gy/5F+USMB (n=7). For S1P-treated mice: 0 Gy (n=6), 10 Gy/5F (n=10), 20 Gy/5F (n=5), USMB only (n=5), 10 Gy/5F+USMB (n=5), 20 Gy/5F+USMB (n=6). Error bars represent mean±s.e.m. Statistical analysis was using Welch's two-tailed unpaired t-test. *P<0.05; **P<0.005.
Fig. 2.
Fig. 2.
Tumour cell death within MCA/129 fibrosarcoma tumours post radiation treatment in WT and S1P-treated mice. (A) Immunohistochemistry staining for caspase-3 visualized whole areas of cell death within MCA/129 mouse fibrosarcoma tumours in WT or S1P treated mice. A dissection microscope at a 0.8× magnification was used to capture whole-tumour slices. Scale bar: 2 mm. (B,C) Whole-area staining was measured as total percentage of cell death detected in WT (B) and S1P-treated (C) groups. For WT mice: 0 Gy (n=15), 10 Gy/5F (n=8), 20 Gy/5F (n=16), USMB only (n=11), 10 Gy/5F+USMB (n=5), 20 Gy/5F+USMB (n=7). For S1P-treated mice: 0 Gy (n=8), 10 Gy/5F (n=8), 20 Gy/5F (n=5), USMB only (n=5), 10 Gy/5F+USMB (n=5), 20 Gy/5F+USMB (n=6). Error bars represent mean±s.e.m. Statistical analysis by Welch's two-tailed unpaired t-test. *P<0.05; **P<0.005.
Fig. 3.
Fig. 3.
Cell proliferation index within MCA/129 fibrosarcoma tumours post radiation treatment in WT and S1P-treated mice. (A) Anti-Ki-67 antibody staining of proliferating primary tumour cells allowed for visualization of MCA/129 mouse fibrosarcoma tumours in WT or S1P-treated mice. Scale bar: 20 μm. (B,C) The numbers of individual cells of stained areas were calculated as a percentage of actively proliferating cells against the total cell count under a 20× objective lens of WT (B) and S1P-treated (C) groups. For WT mice: 0 Gy (n=12), 10 Gy/5F (n=8), 20 Gy/5F (n=11), USMB only (n=17), 10 Gy/5F+USMB (n=5), 20 Gy/5F+USMB (n=6). For S1P-treated mice: 0 Gy (n=5), 10 Gy/5F (n=10), 20 Gy/5F (n=5), USMB only (n=5), 10 Gy/5F+USMB (n=5), 20 Gy/5F+USMB (n=6). Error bars represent mean±s.e.m. Statistical analysis by Welch's two-tailed unpaired t-test. *P<0.05; **P<0.005; ***P<0.0005.
Fig. 4.
Fig. 4.
Microvascular changes within MCA/129 fibrosarcoma tumours post radiation treatment in ASMase−/− mice. (A) Anti-CD31 antibody staining of endothelial cells lining blood vessels allowed for visualization of MCA/129 mouse fibrosarcoma tumours in WT or S1P-treated mice. Scale bar: 40 μm. (B) Individual vessels were quantified to measure MVD under a 10× objective lens. 0 Gy (n=7), 10 Gy/5F (n=7), 20 Gy/5F (n=5), USMB only (n=5), 10 Gy/5F+USMB (n=5), 20 Gy/5F+USMB (n=6). Error bars represent mean±s.e.m. Statistical analysis by Welch's two-tailed unpaired t-test.
Fig. 5.
Fig. 5.
Tumour cell death within MCA/129 fibrosarcoma tumours post radiation treatment in ASMase−/− mice. (A) Antibody staining for caspase-3 visualized whole areas of cell death within MCA/129 mouse fibrosarcoma tumours. Scale bar: 10 μm. (B) Whole-area staining was measured as total percentage of cell death detected. 0 Gy (n=8), 10 Gy/5F (n=8), 20 Gy/5F (n=5), USMB only (n=5), 10 Gy/5F+USMB (n=5), 20 Gy/5F+USMB (n=6). Error bars represent mean±s.e.m. Statistical analysis by Welch's two-tailed unpaired t-test. ***P<0.0005.
Fig. 6.
Fig. 6.
Cell proliferation index within MCA/129 fibrosarcoma tumours post radiation treatment in ASMase−/− mice. (A) Anti-Ki-67 antibody staining of proliferating primary tumour cells. Scale bar: 20 µm. (B) Individual cell counting for stained cells as a percentage of actively proliferating cells against total cell count in one field of view under a 20× objective lens. 0 Gy (n=7), 10 Gy/5F (n=8), 20 Gy/5F (n=5), USMB only (n=4), 10 Gy/5F+USMB (n=8), 20 Gy/5F+USMB (n=5). Error bars represent mean±s.e.m. Statistical analysis by Welch's two-tailed unpaired t-test. *P<0.05; ***P<0.0005.
Fig. 7.
Fig. 7.
Power Doppler analysis of tumours treated with fXRT and/or USMB. (A) Maximum-intensity projections of power Doppler (PD) signals within a 3D volumetric tumour scan of whole tumours undergoing the indicated treatments. The colour bar represents a range from 11 dB (black) to 30 dB (orange). Scale bar: 1 cm. (B-D) Percentage change of the vascular index signal in each treatment condition for the WT, S1P-treated and ASMase−/− groups. Each cohort had five mice. Results are represented as signal intensity change from baseline pre-treatment scan. Error bars represent mean±s.e.m. Statistical analysis by Welch's two-tailed unpaired t-test. *P<0.05.
Fig. 8.
Fig. 8.
Tumour growth curves over the course of 29 days. Mice were treated on days 1-5 and were observed over the course of 29 days to observe tumour growth. (A) WT cohorts. (B) WT mice treated with S1P prior to fXRT or USMB treatments. (C) Mice with ASMase−/− genotype. For WT mice: 0 Gy (n=11), 20 Gy/5F (n=5), USMB only (n=5), 20 Gy/5F+USMB (n=5). For S1P-treated mice: 0 Gy (n=9), 20 Gy/5F (n=5), USMB only (n=3), 20 Gy/5F+USMB (n=5). For ASMase−/− mice: 0 Gy (n=5), 20 Gy/5F (n=5), USMB only (n=6), 20 Gy/5F+USMB (n=5). Error bars represent mean±s.e.m. Time points for which no error bars are present are points for which there was only one animal remaining for observation. Statistical analysis by Wilcoxon's two-tailed unpaired t-test. *P<0.05; **P<0.005; ***P<0.0005.

Similar articles

Cited by

References

    1. Al-Jawadi, S. and Thakur, S. S. (2020). Ultrasound-responsive lipid microbubbles for drug delivery: A review of preparation techniques to optimise formulation size, stability and drug loading. Int. J. Pharm. 585, 119559. 10.1016/j.ijpharm.2020.119559 - DOI - PubMed
    1. Alexandrov, A. V. (2006). Ultrasound enhanced thrombolysis for stroke. Int. J. Stroke 1, 26-29. 10.1111/j.1747-4949.2005.00012.x - DOI - PubMed
    1. Baselet, B., Sonveaux, P., Baatout, S. and Aerts, A. (2019). Pathological effects of ionizing radiation: endothelial activation and dysfunction. Cell Mol. Life Sci. 76, 699-728. 10.1007/s00018-018-2956-z - DOI - PMC - PubMed
    1. Baskar, R., Lee, K. A., Yeo, R. and Yeoh, K. W. (2012). Cancer and radiation therapy: current advances and future directions. Int. J. Med. Sci. 9, 193-199. 10.7150/ijms.3635 - DOI - PMC - PubMed
    1. Bezu, L., Sauvat, A., Humeau, J., Gomes-da-Silva, L. C., Iribarren, K., Forveille, S., Garcia, P., Zhao, L., Liu, P., Zitvogel, L.et al. (2018). eIF2α phosphorylation is pathognomonic for immunogenic cell death. Cell Death Diff. 25, 1375-1393. 10.1038/s41418-017-0044-9 - DOI - PMC - PubMed

Publication types

Substances