

Associations of four biological age markers with child development: A multi-omic analysis in the European HELIX cohort
- PMID: 37278618
- PMCID: PMC10338035
- DOI: 10.7554/eLife.85104
Associations of four biological age markers with child development: A multi-omic analysis in the European HELIX cohort
Abstract
Background: While biological age in adults is often understood as representing general health and resilience, the conceptual interpretation of accelerated biological age in children and its relationship to development remains unclear. We aimed to clarify the relationship of accelerated biological age, assessed through two established biological age indicators, telomere length and DNA methylation age, and two novel candidate biological age indicators, to child developmental outcomes, including growth and adiposity, cognition, behavior, lung function and the onset of puberty, among European school-age children participating in the HELIX exposome cohort.
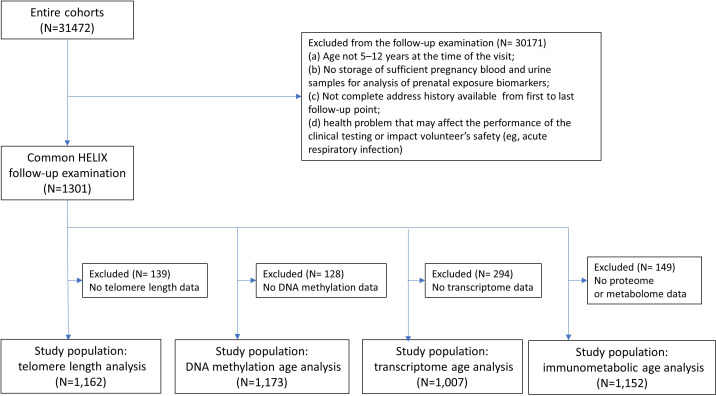
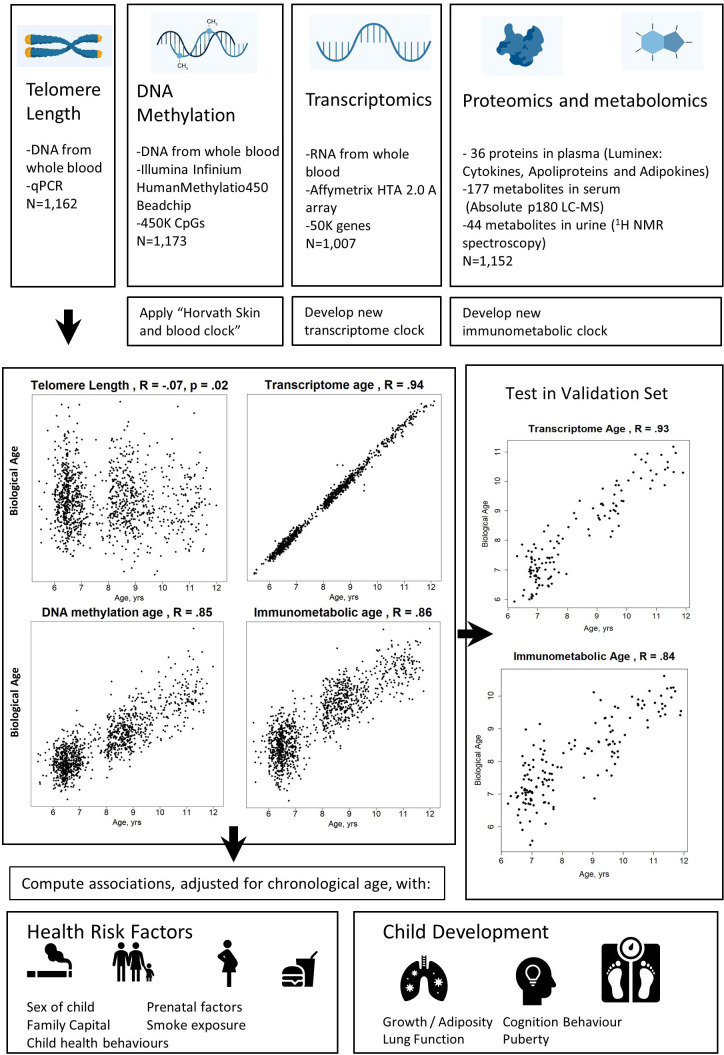
Methods: The study population included up to 1173 children, aged between 5 and 12 years, from study centres in the UK, France, Spain, Norway, Lithuania, and Greece. Telomere length was measured through qPCR, blood DNA methylation, and gene expression was measured using microarray, and proteins and metabolites were measured by a range of targeted assays. DNA methylation age was assessed using Horvath's skin and blood clock, while novel blood transcriptome and 'immunometabolic' (based on plasma proteins and urinary and serum metabolites) clocks were derived and tested in a subset of children assessed six months after the main follow-up visit. Associations between biological age indicators with child developmental measures as well as health risk factors were estimated using linear regression, adjusted for chronological age, sex, ethnicity, and study centre. The clock derived markers were expressed as Δ age (i.e. predicted minus chronological age).
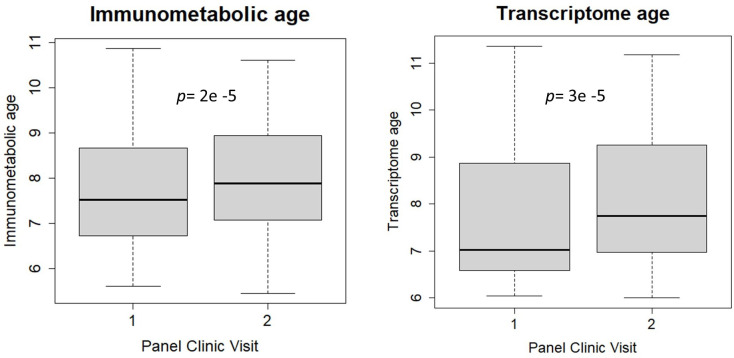
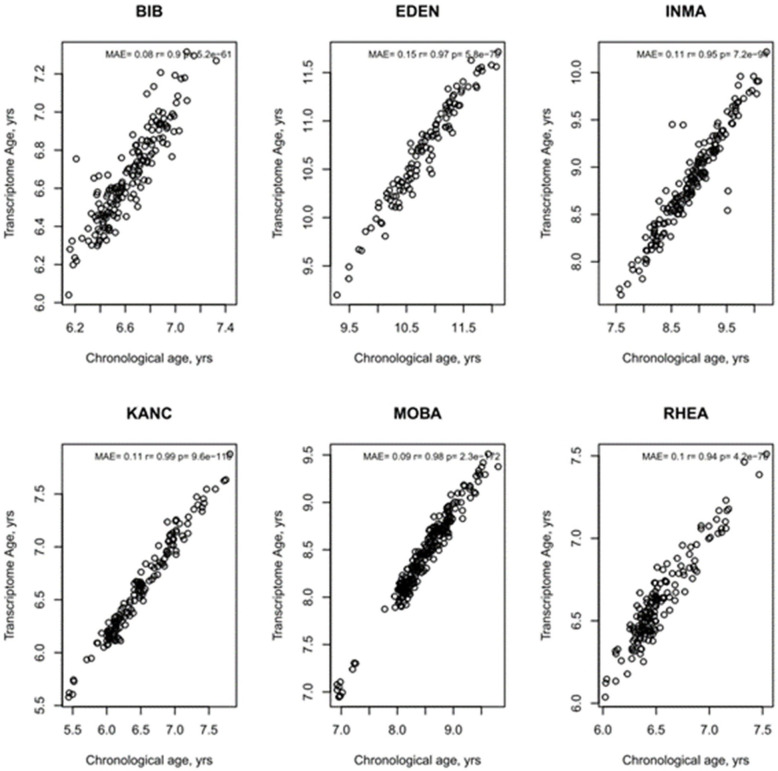
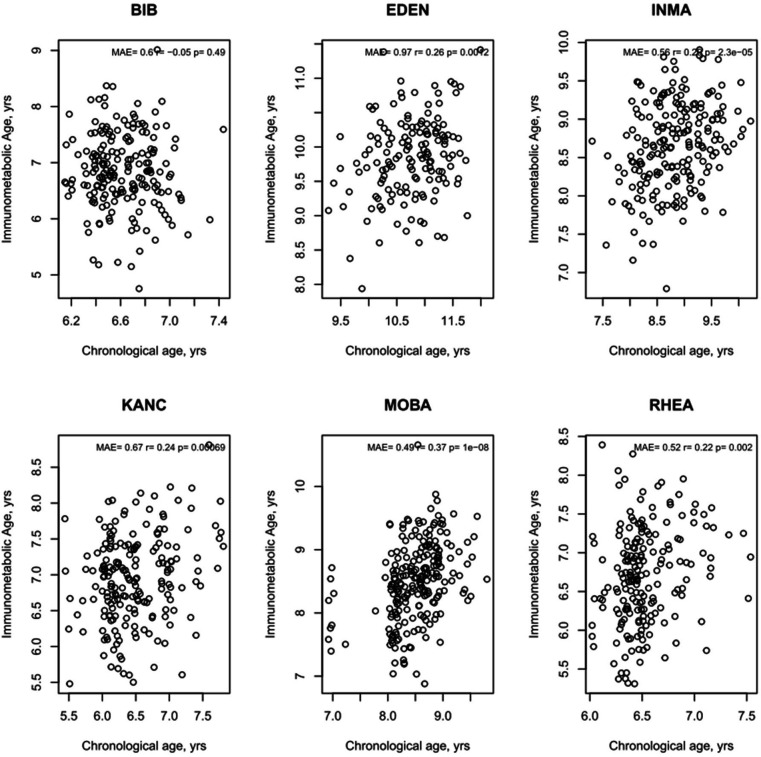
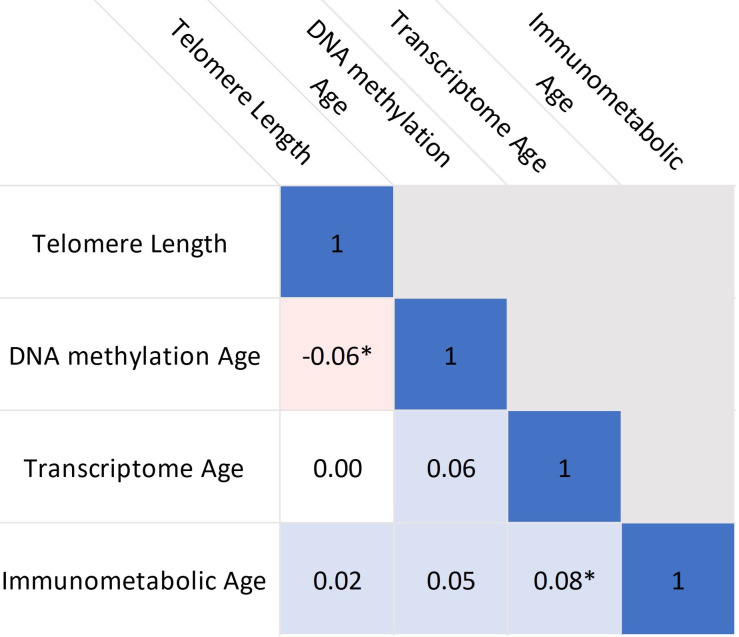
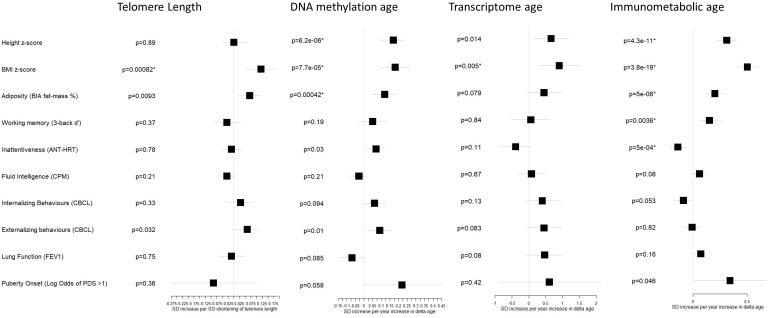
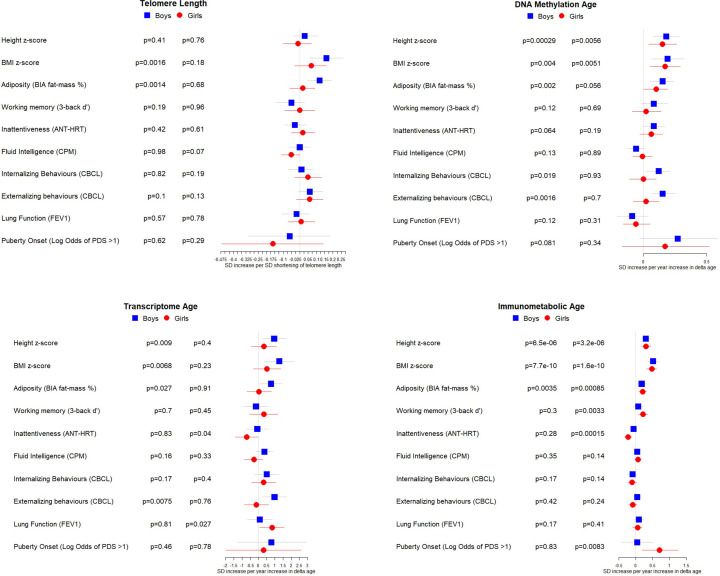
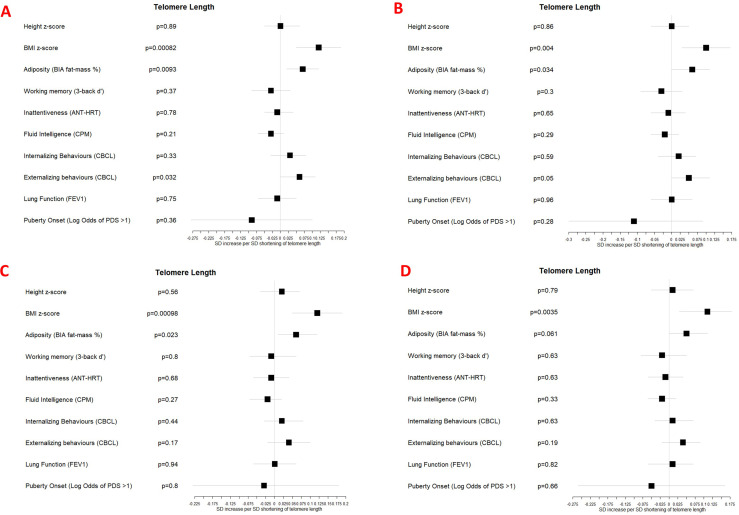
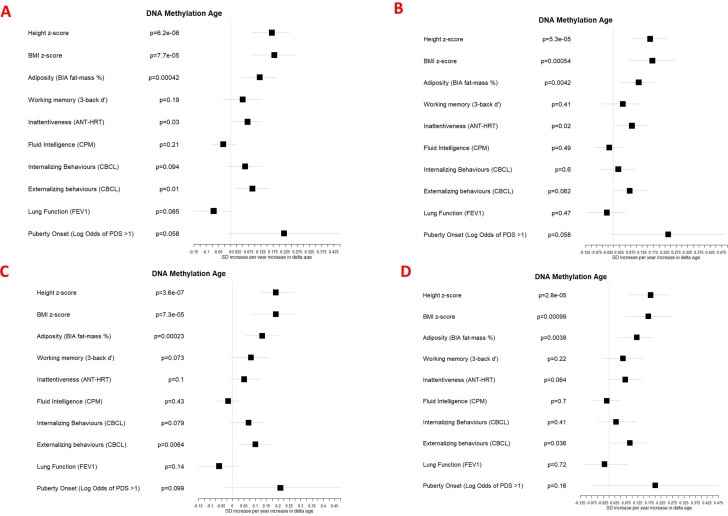
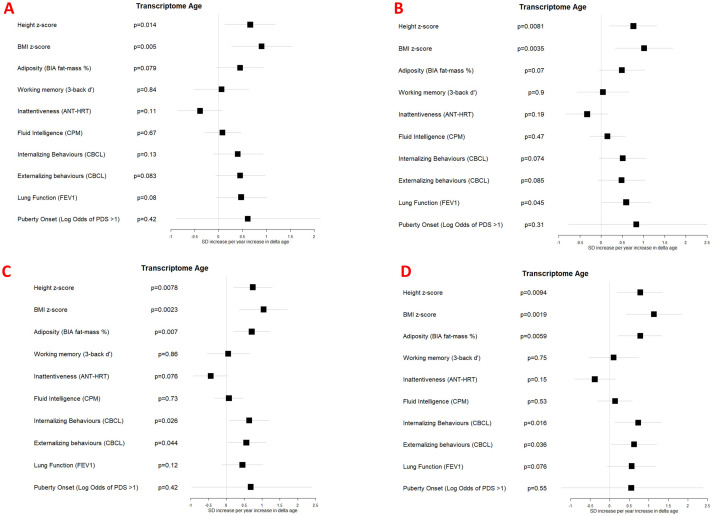
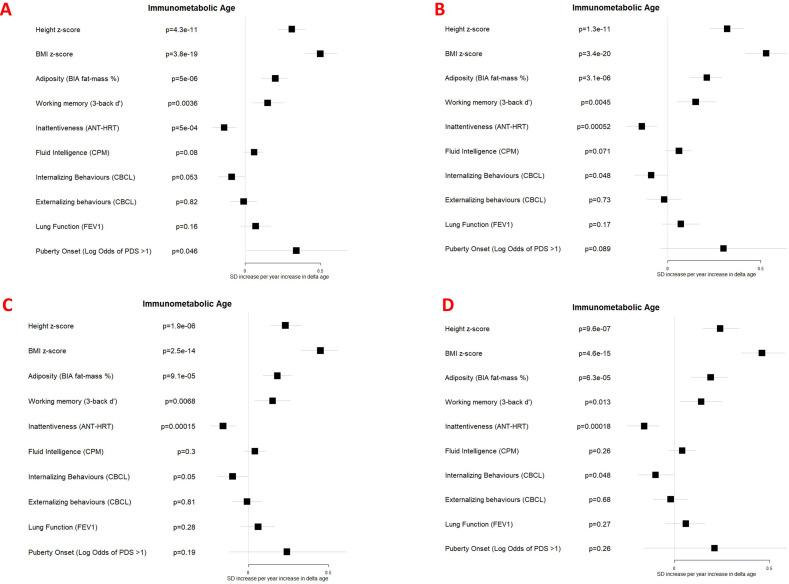
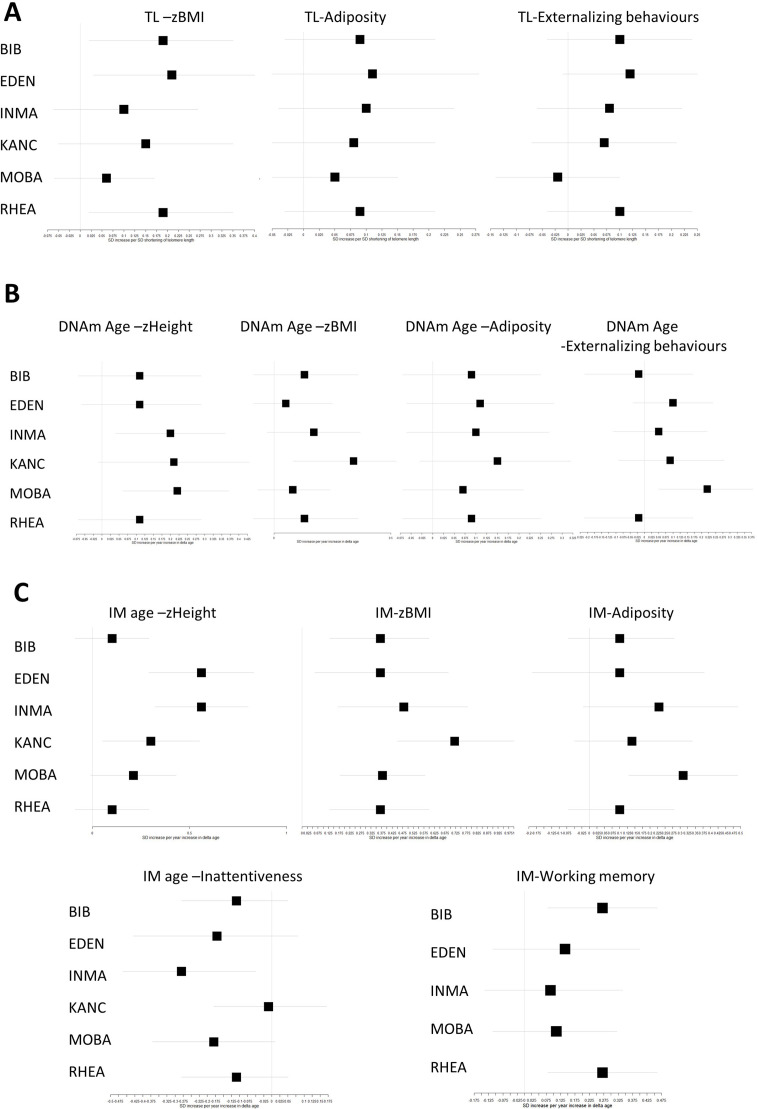
Results: Transcriptome and immunometabolic clocks predicted chronological age well in the test set (r=0.93 and r=0.84 respectively). Generally, weak correlations were observed, after adjustment for chronological age, between the biological age indicators.Among associations with health risk factors, higher birthweight was associated with greater immunometabolic Δ age, smoke exposure with greater DNA methylation Δ age, and high family affluence with longer telomere length.Among associations with child developmental measures, all biological age markers were associated with greater BMI and fat mass, and all markers except telomere length were associated with greater height, at least at nominal significance (p<0.05). Immunometabolic Δ age was associated with better working memory (p=4 e-3) and reduced inattentiveness (p=4 e-4), while DNA methylation Δ age was associated with greater inattentiveness (p=0.03) and poorer externalizing behaviors (p=0.01). Shorter telomere length was also associated with poorer externalizing behaviors (p=0.03).
Conclusions: In children, as in adults, biological aging appears to be a multi-faceted process and adiposity is an important correlate of accelerated biological aging. Patterns of associations suggested that accelerated immunometabolic age may be beneficial for some aspects of child development while accelerated DNA methylation age and telomere attrition may reflect early detrimental aspects of biological aging, apparent even in children.
Funding: UK Research and Innovation (MR/S03532X/1); European Commission (grant agreement numbers: 308333; 874583).
Keywords: biological age; child development; computational biology; epidemiology; global health; human; omics; systems biology.
Plain language summary
Although age is generally measured by the number of years since birth, many factors contribute to the rate at which a person physically ages. In adults, linking these measurements to age gives a measure of overall health and resilience. This ‘biological age’ offers a better prediction of remaining life and disease risk than the number of years lived. Multiple factors can be used to calculate biological age, such as measuring the length of telomeres – protective caps on the end of chromosomes – which shorten as people age. The rate at which they shorten can give an indication of how quickly someone is ageing. Researchers can also study epigenetic factors: these mechanisms lead to certain genes being switched on or off, and they can be combined into a ‘epigenetic clock’ to assess biological age. However, compared with adults, the relationship between biological age and child health and developmental maturity is less well understood. Robinson et al. studied 1,173 school-aged children from six European countries, measuring telomere length, epigenetic factors and other biological indicators related to metabolism and the immune system. The relationships between these factors and an array of child developmental measures such as height, weight, behaviour and the age of onset of puberty were established. The findings showed that biological age indicators are only weakly linked to each other in children. Despite this, biological age was related to greater amount of body fat across all tested indicators – which is also associated with biological age in adults and is an important determinant of lifespan. Among several observed effects on development, analysis found that shorter telomere length and older epigenetic age were associated with greater behavioural problems, suggesting they may be detrimental to child development. On the other hand, a greater age due to metabolic and immune related changes was associated with greater cognitive and behavioural maturity. Environmental factors were also linked to biological ageing, with children exposed to smoking in their homes or while their mother was pregnant displaying an older epigenetic age. Robinson et al. showed that biological ageing in children is multifaceted and can have both beneficial and harmful impacts on development. This knowledge is important for identifying early life risk factors that might influence healthy ageing in later life. Future work will help researchers to understand these complex interactions and the long-term consequences for health and well-being.
© 2023, Robinson et al.
Conflict of interest statement
OR, CL, SJ, SA, EB, Pd, LC, HK, RG, KG, LM, DM, ES, VS, JU, MV, JW, TN, MB, MV No competing interests declared
Figures
Update of
- doi: 10.1101/2023.01.23.23284901
Similar articles
-
The role of adolescent lifestyle habits in biological aging: A prospective twin study.Elife. 2022 Nov 8;11:e80729. doi: 10.7554/eLife.80729. Elife. 2022. PMID: 36345722 Free PMC article.
-
Assessing the causal role of epigenetic clocks in the development of multiple cancers: a Mendelian randomization study.Elife. 2022 Mar 29;11:e75374. doi: 10.7554/eLife.75374. Elife. 2022. PMID: 35346416 Free PMC article.
-
Identification of autosomal cis expression quantitative trait methylation (cis eQTMs) in children's blood.Elife. 2022 Mar 18;11:e65310. doi: 10.7554/eLife.65310. Elife. 2022. PMID: 35302492 Free PMC article.
-
Biological clocks as age estimation markers in animals: a systematic review and meta-analysis.Biol Rev Camb Philos Soc. 2023 Dec;98(6):1972-2011. doi: 10.1111/brv.12992. Epub 2023 Jun 25. Biol Rev Camb Philos Soc. 2023. PMID: 37356823
-
Epigenetic clocks provide clues to the mystery of uterine ageing.Hum Reprod Update. 2023 May 2;29(3):259-271. doi: 10.1093/humupd/dmac042. Hum Reprod Update. 2023. PMID: 36515535 Review.
Cited by
-
Manganese-induced Precocious Puberty Alters Mammary Epithelial Cell Proliferation in Female Rats.Endocrinology. 2025 Mar 24;166(5):bqaf052. doi: 10.1210/endocr/bqaf052. Endocrinology. 2025. PMID: 40105700 Free PMC article.
-
Multi-omics architecture of childhood obesity and metabolic dysfunction uncovers biological pathways and prenatal determinants.Nat Commun. 2025 Jan 14;16(1):654. doi: 10.1038/s41467-025-56013-7. Nat Commun. 2025. PMID: 39809770 Free PMC article.
-
Robust evidence supports a causal link between higher birthweight and longer telomere length: a mendelian randomization study.Front Genet. 2024 Jun 21;15:1264028. doi: 10.3389/fgene.2024.1264028. eCollection 2024. Front Genet. 2024. PMID: 38974386 Free PMC article.
-
Telomere Length and Emotional and Behavioral Problems in Children from the Prospective Birth Cohort INfancia y Medio Ambiente (INMA) Study.Children (Basel). 2025 Jul 2;12(7):875. doi: 10.3390/children12070875. Children (Basel). 2025. PMID: 40723068 Free PMC article.
-
Epigenetic age across development in children and adolescents with ADHD.Psychiatry Res. 2025 Mar;345:116373. doi: 10.1016/j.psychres.2025.116373. Epub 2025 Jan 20. Psychiatry Res. 2025. PMID: 39855016
References
-
- Achenbach TM. Manual for ASEBA School-Age Forms & Profiles. University of Vermont, Research Center for Children, Youth & Families; 2001.
-
- Agier L, Basagaña X, Maitre L, Granum B, Bird PK, Casas M, Oftedal B, Wright J, Andrusaityte S, de Castro M, Cequier E, Chatzi L, Donaire-Gonzalez D, Grazuleviciene R, Haug LS, Sakhi AK, Leventakou V, McEachan R, Nieuwenhuijsen M, Petraviciene I, Robinson O, Roumeliotaki T, Sunyer J, Tamayo-Uria I, Thomsen C, Urquiza J, Valentin A, Slama R, Vrijheid M, Siroux V. Early-life exposome and lung function in children in Europe: an analysis of data from the longitudinal, population-based HELIX cohort. The Lancet. Planetary Health. 2019;3:e81–e92. doi: 10.1016/S2542-5196(19)30010-5. - DOI - PubMed
-
- Belsky DW, Moffitt TE, Cohen AA, Corcoran DL, Levine ME, Prinz JA, Schaefer J, Sugden K, Williams B, Poulton R, Caspi A. Eleven telomere, epigenetic clock, and biomarker-composite quantifications of biological aging: Do they measure the same thing. American Journal of Epidemiology. 2018;187:1220–1230. doi: 10.1093/aje/kwx346. - DOI - PMC - PubMed
-
- Belsky DW, Caspi A, Arseneault L, Baccarelli A, Corcoran DL, Gao X, Hannon E, Harrington HL, Rasmussen LJ, Houts R, Huffman K, Kraus WE, Kwon D, Mill J, Pieper CF, Prinz JA, Poulton R, Schwartz J, Sugden K, Vokonas P, Williams BS, Moffitt TE. Quantification of the pace of biological aging in humans through a blood test, the DunedinPoAm DNA methylation algorithm. eLife. 2020;9:e54870. doi: 10.7554/eLife.54870. - DOI - PMC - PubMed
-
- Benjamini Y, Hochberg Y. Controlling the false discovery rate: a practical and powerful approach to multiple testing. Journal of the Royal Statistical Society. 1995;57:289–300. doi: 10.1111/j.2517-6161.1995.tb02031.x. - DOI
Publication types
MeSH terms
Substances
Grants and funding
LinkOut - more resources
Full Text Sources
Medical
Miscellaneous
