Review
. 2023 Jun;307(5):e221512.
doi: 10.1148/radiol.221512.

Emerging Perspectives on MRI Application in Multiple Sclerosis: Moving from Pathophysiology to Clinical Practice

Affiliations
Review

Emerging Perspectives on MRI Application in Multiple Sclerosis: Moving from Pathophysiology to Clinical Practice

Maria Assunta Rocca et al. Radiology. 2023 Jun.

Abstract

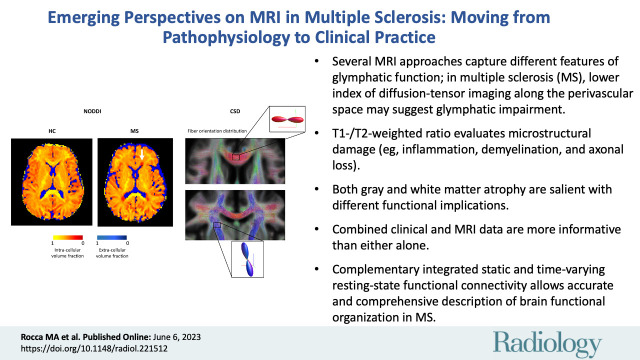
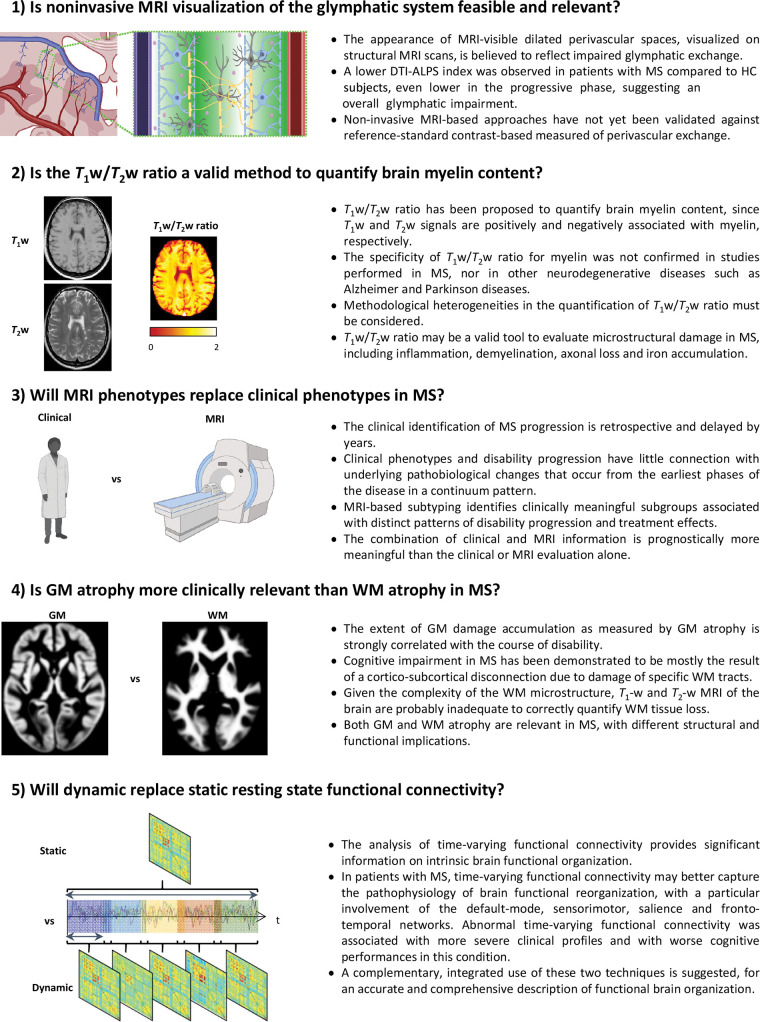
MRI plays a central role in the diagnosis of multiple sclerosis (MS) and in the monitoring of disease course and treatment response. Advanced MRI techniques have shed light on MS biology and facilitated the search for neuroimaging markers that may be applicable in clinical practice. MRI has led to improvements in the accuracy of MS diagnosis and a deeper understanding of disease progression. This has also resulted in a plethora of potential MRI markers, the importance and validity of which remain to be proven. Here, five recent emerging perspectives arising from the use of MRI in MS, from pathophysiology to clinical application, will be discussed. These are the feasibility of noninvasive MRI-based approaches to measure glymphatic function and its impairment; T1-weighted to T2-weighted intensity ratio to quantify myelin content; classification of MS phenotypes based on their MRI features rather than on their clinical features; clinical relevance of gray matter atrophy versus white matter atrophy; and time-varying versus static resting-state functional connectivity in evaluating brain functional organization. These topics are critically discussed, which may guide future applications in the field.


Conflict of interest statement

Disclosures of conflicts of interest: M.A.R. Grants from the MS Society of Canada and Fondazione Italiana Sclerosi Multipla; consulting fees from Biogen, Bristol Myers Squibb, Eli Lilly, Janssen, Roche; speaker honoraria from AstraZeneca, Biogen, Bristol Myers Squibb, Bromatech, Celgene, Genzyme, Horizon Therapeutics Italy, Merck Serono, Novartis, Roche, Sanofi, and Teva. M.M. Grants and personal fees from Almiral; MAGNIMS-ECTRIMS fellowship in 2020; speaker honoraria from Sanofi Genzyme, Merck-Serono, and Novartis; travel grants from Novartis and Sanofi Genzyme. M.B. Teacher at the International MRIlab—A Journey From The Basics To Advanced Methodologies of MRI; co-founder and CEO of SIENA Imaging SRL. A.E. research grants from the UK Medical Research Council (MRC), Innovate UK, Biogen, Merck, and Roche; consulting fees from Biogen, Merck, and Roche; honoraria from Roche and Biogen; support for attending meetings and travel from the National MS Society; on the board of the Journal of the American Academy of Neurology; founder and stake holder in Queen Square Analytics. J.I. grants from National Institutes of Health, National Institute on Aging, U.S. Department of Veteran's Affairs and U.S. Department of Defense; Chair for the Scientific Advisory Board of Applied Cognition; holds equity stake in and receives consulting fees from Applied Cognition. E.P. honorarium from Biogen. P.P. Research support from Italian Ministry of Health and Fondazione Italiana Sclerosi Multipla; honoraria from Roche, Biogen, Novartis, Merck Serono, Bristol Myers Squibb, and Genzyme. L.S. No relevant relationships. T.T. Grant from Canon Medical Systems. P.V. Honoraria from Biogen. M.F. Grants from Biogen, Merck-Serono, Novartis, Roche, Italian Ministry of Health, and Fondazione Italiana Sclerosi Multipla; consulting fees from Alexion, Almirall, Biogen, Merck, Novartis, Roche, and Sanofi; honoraria from Bayer, Biogen, Celgene, Chiesi Italia, Eli Lilly, Genzyme, Janssen, Merck Serono, Neopharmed Gentili, Novartis, Novo Nordisk, Roche, Sanofi, Takeda, and Teva; participation on a DataSafety monitoring board or advisory board for Alexion, Biogen, Bristol-Myers Squibb, Merck, Novartis, Roche, Sanofi, Sanofi-Aventis, Sanofi-Genzyme, and Takeda; associate editor of Radiology.

Figures

None
Graphical abstract
Key topics of the discussion and summary of the agreed statements.
DTI-ALPS = diffusion-tensor imaging along perivascular spaces, HC = healthy
control, GM = gray matter, MS = multiple sclerosis, T1w/T2w = T1-weighted to
T2-weighted, WM = white matter.
Figure 1:
Key topics of the discussion and summary of the agreed statements. DTI-ALPS = diffusion-tensor imaging along perivascular spaces, HC = healthy control, GM = gray matter, MS = multiple sclerosis, T1w/T2w = T1-weighted to T2-weighted, WM = white matter.
Steps involved in diffusion-tensor imaging (DTI) along the perivascular
space (ALPS). (A) Radiograph of a coronal brain section after contrast material
injection shows parenchymal vessels that run horizontally in the section (white
box) at the level of the lateral ventricle body. (B) Axial
susceptibility-weighted image at the level of the lateral ventricle body
indicates parenchymal vessels run laterally (arrows). (C)
Susceptibility-weighted image with superimposed color DTI direction map
indicates the distribution of projection fibers (z-axis, blue), association
fibers (y-axis, green), and subcortical fibers (x-axis, red). Three regions of
interest were placed in the area with projection fibers (projection area),
association fibers (association area), and subcortical fibers (subcortical area)
to measure the diffusivities of the three directions (x, y, and z). Reprinted,
with permission, from reference 12. (D) Schematic shows the relationship between
the direction of the perivascular space (gray cylinders) and the direction of
fibers. The direction of the perivascular space is perpendicular to both the
projection and the association fibers. (E) Violin plot reports all data points:
median (solid lines), first and third quartiles (dashed lines), and density plot
(outer lines) for DTI-ALPS index in healthy control (HC) subjects and patients
with multiple sclerosis (MS), relapsing-remitting MS (RRMS), and progressive MS
(PMS) (ie, primary and secondary progressive MS). Estimated mean difference
(EMD) and false discovery rate–adjusted P values obtained via
between-groups comparison are also reported. Reprinted, with permission, from
reference 6. (F) Scatterplot and piece-wise correlation between DTI-ALPS index
and disease duration in patients with MS. Up to 4.26 years from MS onset,
DTI-ALPS index negatively correlated with disease duration (r = -0.38, P = .04),
with no further correlation after this time. Reprinted, with permission, from
reference 6. (G) Axial T2-weighted fluid-attenuated inversion recovery MRI scan
shows strong gadolinium-based contrast enhancement of the perivascular spaces of
perforating arteries (arrow) in right-sided white matter 3 hours after
injection. Perivascular spaces represent the anatomic correlate of cerebral
fluid microcirculation. Adapted, with permission, from reference 15.
Figure 2:
Steps involved in diffusion-tensor imaging (DTI) along the perivascular space (ALPS). (A) Radiograph of a coronal brain section after contrast material injection shows parenchymal vessels that run horizontally in the section (white box) at the level of the lateral ventricle body. (B) Axial susceptibility-weighted image at the level of the lateral ventricle body indicates parenchymal vessels run laterally (arrows). (C) Susceptibility-weighted image with superimposed color DTI direction map indicates the distribution of projection fibers (z-axis, blue), association fibers (y-axis, green), and subcortical fibers (x-axis, red). Three regions of interest were placed in the area with projection fibers (projection area), association fibers (association area), and subcortical fibers (subcortical area) to measure the diffusivities of the three directions (x, y, and z). Reprinted, with permission, from reference . (D) Schematic shows the relationship between the direction of the perivascular space (gray cylinders) and the direction of fibers. The direction of the perivascular space is perpendicular to both the projection and the association fibers. (E) Violin plot reports all data points: median (solid lines), first and third quartiles (dashed lines), and density plot (outer lines) for DTI-ALPS index in healthy control (HC) subjects and patients with multiple sclerosis (MS), relapsing-remitting MS (RRMS), and progressive MS (PMS) (ie, primary and secondary progressive MS). Estimated mean difference (EMD) and false discovery rate–adjusted P values obtained via between-groups comparison are also reported. Reprinted, with permission, from reference . (F) Scatterplot and piece-wise correlation between DTI-ALPS index and disease duration in patients with MS. Up to 4.26 years from MS onset, DTI-ALPS index negatively correlated with disease duration (r = -0.38, P = .04), with no further correlation after this time. Reprinted, with permission, from reference . (G) Axial T2-weighted fluid-attenuated inversion recovery MRI scan shows strong gadolinium-based contrast enhancement of the perivascular spaces of perforating arteries (arrow) in right-sided white matter 3 hours after injection. Perivascular spaces represent the anatomic correlate of cerebral fluid microcirculation. Adapted, with permission, from reference .
T1-weighted to T2-weighted (T1w/T2w) ratio to assess microstructural
damage in patients with multiple sclerosis (MS). (A) T1w/T2w ratio map in a
patient with MS. Color bar indicates T1w/T2w ratio scale values. (B) Different
pathologic substrates of MS and their possible effects on T1w/T2w ratio.
Demyelination or inflammation and axonal damage are likely to reduce T1w/T2w
ratio; conversely, iron accumulation, microglia activation, and astrogliosis
likely lead to a higher T1w/T2w ratio.
Figure 3:
T1-weighted to T2-weighted (T1w/T2w) ratio to assess microstructural damage in patients with multiple sclerosis (MS). (A) T1w/T2w ratio map in a patient with MS. Color bar indicates T1w/T2w ratio scale values. (B) Different pathologic substrates of MS and their possible effects on T1w/T2w ratio. Demyelination or inflammation and axonal damage are likely to reduce T1w/T2w ratio; conversely, iron accumulation, microglia activation, and astrogliosis likely lead to a higher T1w/T2w ratio.
Clinical and MRI phenotypes in the setting of multiple sclerosis (MS). (A)
Clinical phenotypes. In the 2013 revision of the clinical course of MS (37),
clinically isolated syndrome (CIS) was included in the spectrum of MS phenotypes
to denote those patients with a first clinical presentation of the disease with
characteristics of inflammatory demyelination that could be MS but that has yet
to fulfill the diagnostic criteria for MS. Relapsing-remitting MS (RRMS) is the
most common type (approximately 85% of patients with MS), characterized by the
occurrence of relapses, followed by spontaneous remission with variable degrees
of recovery. A substantial proportion of patients with RRMS, increasing with age
and disease duration, converts to secondary progressive MS (SPMS), characterized
by a progression of irreversible disability occurring independently from
relapses. About 10%–15% of patients have a primary progressive clinical
phenotype, characterized by an insidious disease progression from onset,
resulting in gradual, progressive, and unremitting accumulation of neurologic
deficits for more than 1 year, without preceding relapses and remissions. For
each MS phenotype, a classification of the disease as active or not active,
defined by clinical assessment of relapse occurrence or lesion activity detected
with MRI, was added. For progressive forms of the disease, evaluation of whether
the disability has progressed over a given time was included, thus categorizing
patients with progressive disease as those with or without disability
progression (B) MRI-derived subtypes. Data-driven MS subtypes show (I)
differential patterns of abnormality in three groups: cortex-led,
normal-appearing white matter (WM)-led, and lesion-led abnormality; (II)
differential rate of disability worsening; and (III) differential treatment
effect across the data-derived subtypes. The horizontal axis shows the
percentage change in Expanded Disability Status Scale (EDSS) worsening. Adapted
from reference 54, an open-access article, published under Creative Commons
Attribution 4.0 International License.
Figure 4:
Clinical and MRI phenotypes in the setting of multiple sclerosis (MS). (A) Clinical phenotypes. In the 2013 revision of the clinical course of MS (37), clinically isolated syndrome (CIS) was included in the spectrum of MS phenotypes to denote those patients with a first clinical presentation of the disease with characteristics of inflammatory demyelination that could be MS but that has yet to fulfill the diagnostic criteria for MS. Relapsing-remitting MS (RRMS) is the most common type (approximately 85% of patients with MS), characterized by the occurrence of relapses, followed by spontaneous remission with variable degrees of recovery. A substantial proportion of patients with RRMS, increasing with age and disease duration, converts to secondary progressive MS (SPMS), characterized by a progression of irreversible disability occurring independently from relapses. About 10%–15% of patients have a primary progressive clinical phenotype, characterized by an insidious disease progression from onset, resulting in gradual, progressive, and unremitting accumulation of neurologic deficits for more than 1 year, without preceding relapses and remissions. For each MS phenotype, a classification of the disease as active or not active, defined by clinical assessment of relapse occurrence or lesion activity detected with MRI, was added. For progressive forms of the disease, evaluation of whether the disability has progressed over a given time was included, thus categorizing patients with progressive disease as those with or without disability progression. (B) MRI-derived subtypes. Data-driven MS subtypes show (I) differential patterns of abnormality in three groups: cortex-led, normal-appearing white matter (WM)-led, and lesion-led abnormality; (II) differential rate of disability worsening; and (III) differential treatment effect across the data-derived subtypes. The horizontal axis shows the percentage change in Expanded Disability Status Scale (EDSS) worsening. Adapted from reference , an open-access article, published under Creative Commons Attribution 4.0 International License.
Advanced diffusion-weighted imaging models to evaluate white matter (WM)
microstructure. (A) Two color-coded maps of intra- and extracellular volume
fractions from the Neurite Orientation Dispersion and Density Imaging (NODDI)
model in a healthy control (HC) volunteer and a patient with multiple sclerosis
(MS). Arrow indicates a WM lesion. Compared with the HC volunteer, the patient
with MS showed lower intracellular volume in normal-appearing WM and WM lesions.
(B) Axial (top) and coronal (bottom) representations of the WM fiber orientation
distributions (FODs) estimated with the constrained spherical deconvolution
(CSD) model in a patient with MS. In the zoomed rectangles, the FOD in one voxel
is shown and color coded according to the direction.
Figure 5:
Advanced diffusion-weighted imaging models to evaluate white matter (WM) microstructure. (A) Two color-coded maps of intra- and extracellular volume fractions from the Neurite Orientation Dispersion and Density Imaging (NODDI) model in a healthy control (HC) volunteer and a patient with multiple sclerosis (MS). Arrow indicates a WM lesion. Compared with the HC volunteer, the patient with MS showed lower intracellular volume in normal-appearing WM and WM lesions. (B) Axial (top) and coronal (bottom) representations of the WM fiber orientation distributions (FODs) estimated with the constrained spherical deconvolution (CSD) model in a patient with MS. In the zoomed rectangles, the FOD in one voxel is shown and color coded according to the direction.
Typical scheme of the main workflow of time-varying functional
connectivity analysis performed using data-driven approaches. (A) Selection of
regions (or networks) of interest to be included in the analysis, which can be
done using a priori or data-driven parcellations. (B) Estimation of time-varying
functional correlations of the extracted resting-state functional MRI time
series. This can be done using different methods (sliding windows analysis,
hidden Markov model analysis, or covarying activity pattern analysis). (C)
Description of connectivity dynamism from functional connectivity patterns.
Again, this can be done using different approaches, such as calculating summary
metrics of dynamism (standard deviation, brain entropy, etc) or characterizing
recurring functional connectivity states in terms of dwell time and number of
transitions between states. DMN = default mode network, FC = functional
connectivity, fMRI = functional MRI, RS = resting state.
Figure 6:
Typical scheme of the main workflow of time-varying functional connectivity analysis performed using data-driven approaches. (A) Selection of regions (or networks) of interest to be included in the analysis, which can be done using a priori or data-driven parcellations. (B) Estimation of time-varying functional correlations of the extracted resting-state functional MRI time series. This can be done using different methods (sliding windows analysis, hidden Markov model analysis, or covarying activity pattern analysis). (C) Description of connectivity dynamism from functional connectivity patterns. Again, this can be done using different approaches, such as calculating summary metrics of dynamism (standard deviation, brain entropy, etc) or characterizing recurring functional connectivity states in terms of dwell time and number of transitions between states. DMN = default mode network, FC = functional connectivity, fMRI = functional MRI, RS = resting state.

References

    1. Filippi M , Bar-Or A , Piehl F , et al. . Multiple sclerosis . Nat Rev Dis Primers 2018. ; 4 ( 1 ): 43 . [Published correction appears in Nat Rev Dis Primers 2018;4(1):49.] - PubMed
    1. Filippi M , Preziosa P , Rocca MA . MRI in multiple sclerosis: what is changing? Curr Opin Neurol 2018. ; 31 ( 4 ): 386 – 395 . - PubMed
    1. Iliff J , Simon M . CrossTalk proposal: The glymphatic system supports convective exchange of cerebrospinal fluid and brain interstitial fluid that is mediated by perivascular aquaporin-4 . J Physiol 2019. ; 597 ( 17 ): 4417 – 4419 . - PMC - PubMed
    1. Zhou Y , Cai J , Zhang W , et al. . Impairment of the Glymphatic Pathway and Putative Meningeal Lymphatic Vessels in the Aging Human . Ann Neurol 2020. ; 87 ( 3 ): 357 – 369 . - PubMed
    1. Kress BT , Iliff JJ , Xia M , et al. . Impairment of paravascular clearance pathways in the aging brain . Ann Neurol 2014. ; 76 ( 6 ): 845 – 861 . - PMC - PubMed

Publication types