. 2023 Aug 3;11(8):1114-1124.
doi: 10.1158/2326-6066.CIR-22-0996.

Circulating and Intratumoral Immune Determinants of Response to Atezolizumab plus Bevacizumab in Patients with Variant Histology or Sarcomatoid Renal Cell Carcinoma

Affiliations

Circulating and Intratumoral Immune Determinants of Response to Atezolizumab plus Bevacizumab in Patients with Variant Histology or Sarcomatoid Renal Cell Carcinoma

Renee Maria Saliby et al. Cancer Immunol Res. .

Abstract

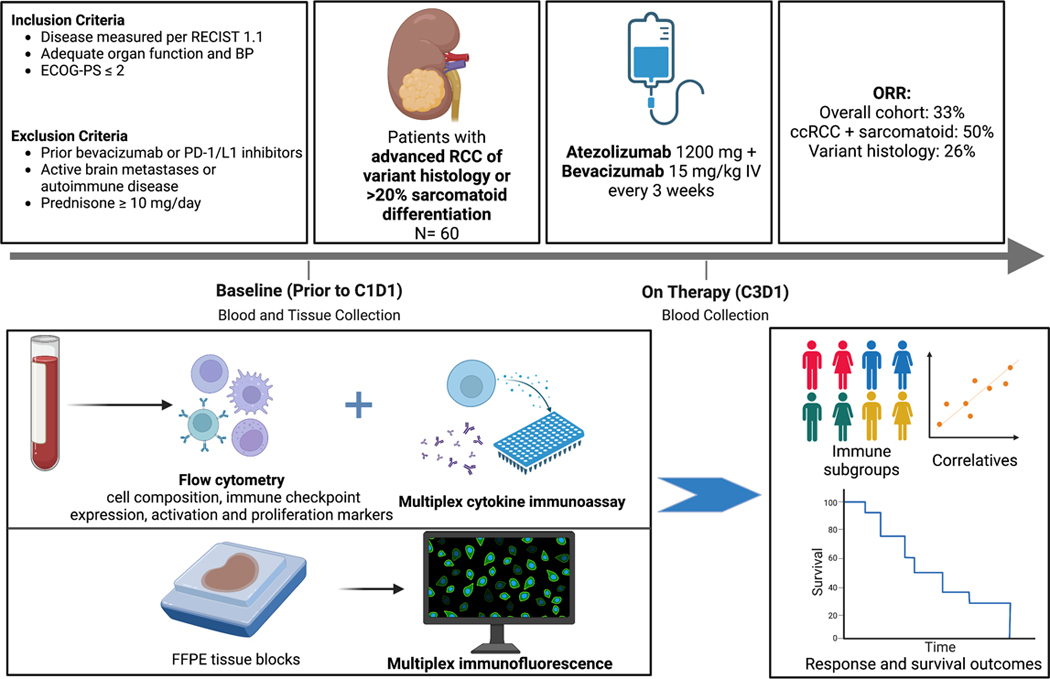
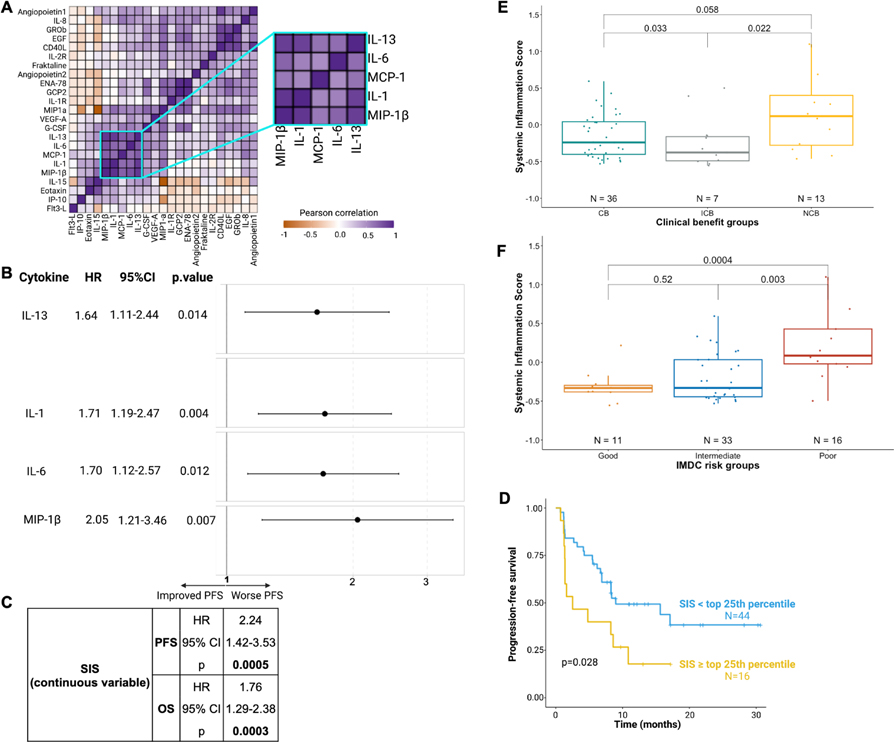
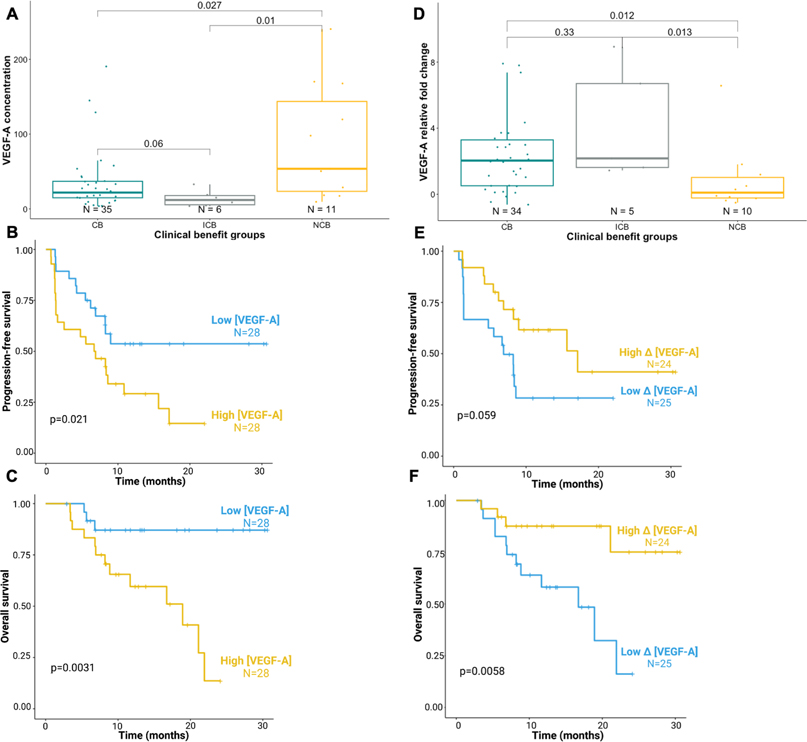
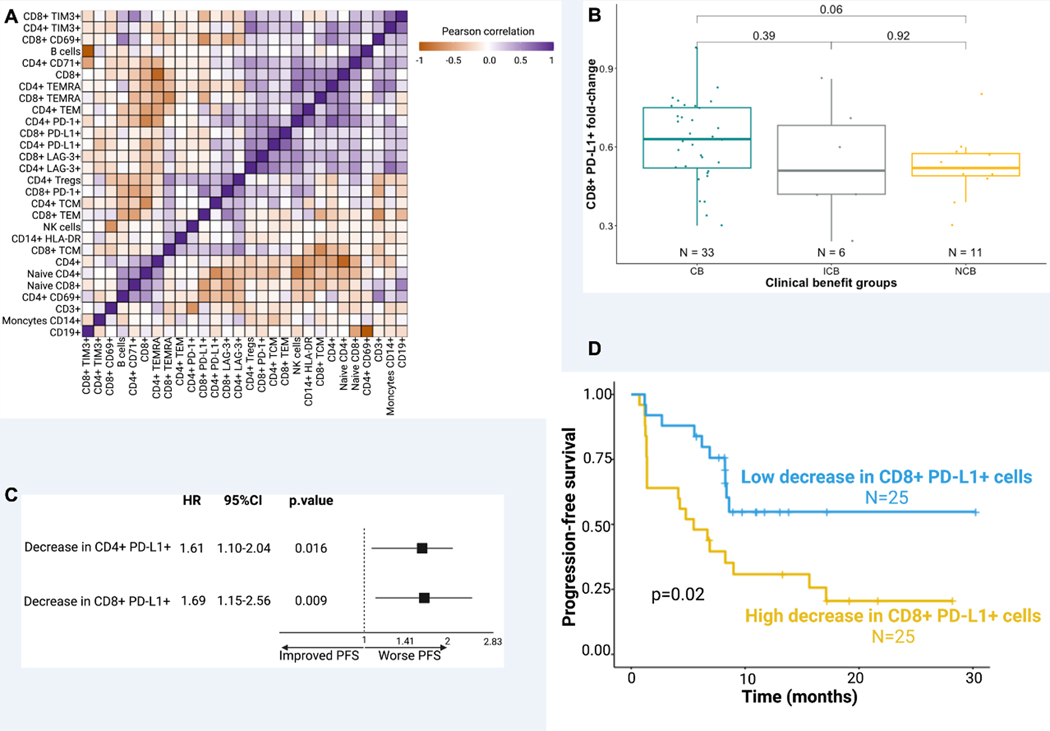
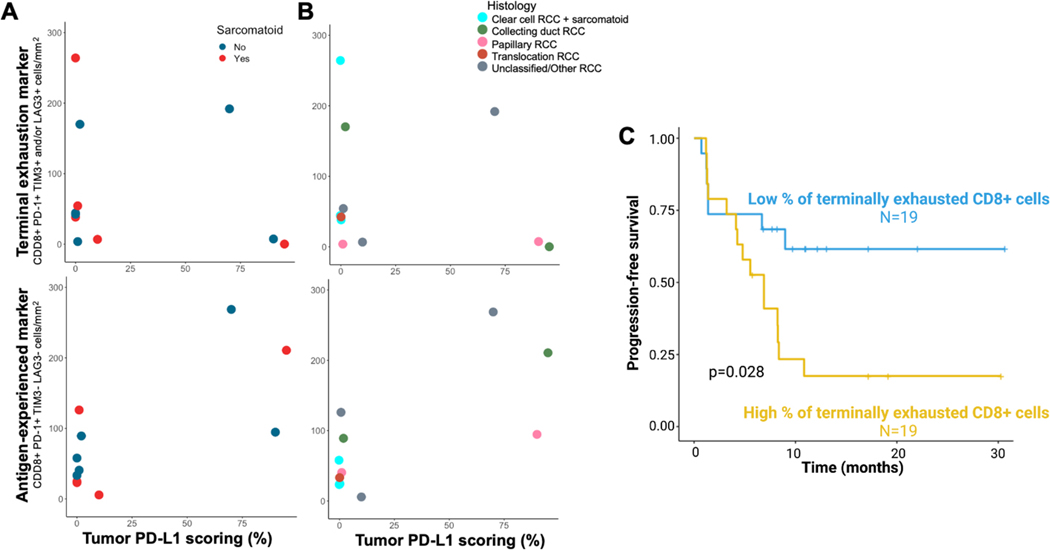
Renal cell carcinoma (RCC) of variant histology comprises approximately 20% of kidney cancer diagnoses, yet the optimal therapy for these patients and the factors that impact immunotherapy response remain largely unknown. To better understand the determinants of immunotherapy response in this population, we characterized blood- and tissue-based immune markers for patients with variant histology RCC, or any RCC histology with sarcomatoid differentiation, enrolled in a phase II clinical trial of atezolizumab and bevacizumab. Baseline circulating (plasma) inflammatory cytokines were highly correlated with one another, forming an "inflammatory module" that was increased in International Metastatic RCC Database Consortium poor-risk patients and was associated with worse progression-free survival (PFS; P = 0.028). At baseline, an elevated circulating vascular endothelial growth factor A (VEGF-A) level was associated with a lack of response (P = 0.03) and worse PFS (P = 0.021). However, a larger increase in on-treatment levels of circulating VEGF-A was associated with clinical benefit (P = 0.01) and improved overall survival (P = 0.0058). Among peripheral immune cell populations, an on-treatment decrease in circulating PD-L1+ T cells was associated with improved outcomes, with a reduction in CD4+PD-L1+ [HR, 0.62; 95% confidence interval (CI), 0.49-0.91; P = 0.016] and CD8+PD-L1+ T cells (HR, 0.59; 95% CI, 0.39-0.87; P = 0.009) correlated with improved PFS. Within the tumor itself, a higher percentage of terminally exhausted (PD-1+ and either TIM-3+ or LAG-3+) CD8+ T cells was associated with worse PFS (P = 0.028). Overall, these findings support the value of tumor and blood-based immune assessments in determining therapeutic benefit for patients with RCC receiving atezolizumab plus bevacizumab and provide a foundation for future biomarker studies for patients with variant histology RCC receiving immunotherapy-based combinations.

Trial registration: ClinicalTrials.gov NCT02724878.


Figures

Figure 1.
Figure 1.. Study design of the clinical trial and correlative analysis evaluating the combination of atezolizumab and bevacizumab in variant histology RCC and any RCC with sarcomatoid features.
Abbreviations: BP: Blood pressure, C1D1: Day 1 of Cycle 1 of treatment, C3D1: Day 1 of Cycle 3 of treatment, ccRCC: clear-cell renal cell carcinoma, ECOG-PS: Eastern Cooperative Oncology Group Performance Status, FFPE: Formalin-Fixed Paraffin-Embedded, ORR: overall response rate, RCC: renal cell carcinoma, RECIST: Response Evaluation Criteria in Solid Tumors.
Figure 2.
Figure 2.. A plasma-derived systemic “inflammation module” is associated with worse clinical outcomes.
Blood samples from 60 patients were analyzed using a custom multiplex immunoassay to quantify circulating cytokine levels at baseline. A) Unsupervised hierarchical clustering of Pearson correlations between cytokine levels at baseline demonstrating that specific circulating inflammatory cytokines are highly correlated. B) Forest plots for PFS hazard ratios by level of circulating inflammatory cytokines from univariate Cox regression model (N=60). C) Hazard ratios for PFS and OS by level of SIS as a continuous variable, from univariate Cox regression model (N=60). D) Kaplan-Meier curves showing that a higher SIS is associated with worse progression-free survival (log-rank-test; N=60). E) Boxplots demonstrating that the SIS is highest in non-responding patients (NCB) (pairwise Wilcoxon tests; N=56). F) Boxplots showing that the SIS is higher among patients in the poor IMDC risk group (pairwise Wilcoxon tests; N=60). The threshold for statistical significance in all the analyses was set at a p-value of 0.05. Boxplots: Median (solid line within the box): the line inside the box represents the median, which is the central value in the dataset. Box (rectangle): the box represents the interquartile range (IQR), which spans from the 25th percentile (lower edge of the box) to the 75th percentile (upper edge of the box). Whiskers (vertical lines extending from the box): the whiskers depict the range of the data excluding outliers, they extend to 1.5 times the IQR. Abbreviations: CB: clinical benefit, CI: confidence interval, HR: hazard ratio, ICB: intermediate clinical benefit, IMDC: International Metastatic RCC Database Consortium, NCB: no clinical benefit, OS: overall survival, PFS: progression-free survival, SIS: systemic inflammation score. In panel D, time is since initiation of therapy.
Figure 3.
Figure 3.. Association of baseline and early changes in VEGF-A concentrations with clinical outcomes.
Paired blood samples from 60 patients (at baseline and on-treatment) were analyzed using a multiplex immunoassay to quantify circulating VEGF-A levels at baseline and on treatment. (A-C) Patients with higher baseline VEGF-A expression have worse clinical outcomes with atezolizumab plus bevacizumab, with (A) higher rate of therapy resistance (NCB; pairwise Wilcoxon test; N=52), and shorter (B) PFS and (C) OS (log-rank-tests; N=56). (D- F) Relative increase in VEGF-A concentration on-treatment is associated with improved (D) response (pairwise Wilcoxon test; N=49), (E) PFS, and (F) OS (log-rank-test; N=49). In panels B, C, E, F time is since initiation of therapy. High Δ[VEGF-A] corresponds to a higher relative increase in VEGF concentration, low Δ [VEGF-A] is a lower relative increase or a decrease in VEGF concentration. The threshold for statistical significance in all the analyses was set at a p-value of 0.05. Boxplots: Median (solid line within the box): the line inside the box represents the median, which is the central value in the dataset. Box (rectangle): the box represents the interquartile range (IQR), which spans from the 25th percentile (lower edge of the box) to the 75th percentile (upper edge of the box). Whiskers (vertical lines extending from the box): the whiskers depict the range of the data excluding outliers, they extend to 1.5 times the IQR. Abbreviations: Δ [VEGF-A]: ([VEGF-A (C3D1) – [VEGF-A (C1D1)])/ – [VEGF-A (C1D1), C1D1: Day 1 of Cycle 1 of treatment, C3D1: Day 1 of Cycle 3 of treatment, VEGF-A: vascular endothelial growth factor A.
Figure 4.
Figure 4.. Dynamic changes in PD-L1 expressing circulating T cells are associated with treatment-related outcomes.
Paired blood samples from 60 patients (at baseline and on-treatment) were analyzed using a flow cytometry to quantify circulating immune cells at baseline and on treatment. A) Unsupervised hierarchical clustering of Pearson correlations between baseline immune cell levels. B) Boxplots demonstrating the association of the change of CD8+ PD-L1+ cell levels (from C1D1 to C3D1) with CB (pairwise Wilcoxon tests; N=50). C) Forest plots for PFS hazard ratios in patients treated with atezolizumab+bevacizumab by ratio of on-treatment to baseline circulating CD4+ and CD8+ cells expressing PD-L1 (Cox univariate regression; N=50). D) Kaplan-Meier curves showing that lower decrease (C3D1/C1D1 ratio ≤ median ratio) in CD8+ PD-L1+ cells on treatment is associated to improved PFS (log-rank-test; N=50). In panel D, time is since initiation of therapy. The threshold for statistical significance in all the analyses was set at a p-value of 0.05. Boxplots: Median (solid line within the box): the line inside the box represents the median, which is the central value in the dataset. Box (rectangle): the box represents the interquartile range (IQR), which spans from the 25th percentile (lower edge of the box) to the 75th percentile (upper edge of the box). Whiskers (vertical lines extending from the box): the whiskers depict the range of the data excluding outliers, they extend to 1.5 times the IQR.
Figure 5.
Figure 5.. Evaluation of antigen-experienced and terminal exhaustion T-cell markers in nccRCC.
Tissue samples from 38 patients were collected before initiation of therapy and stained (immunohistochemistry and multiplex immunofluorescence) to characterize PD-L1 status of the tumor and the intratumoral immune microenvironment. A-B) Distribution of tumor samples according to T cell markers by (A) sarcomatoid status and (B) histology (N=11). C) Kaplan-Meier curves showing that patients with a lower percentage of terminally exhausted CD8 T cells had improved PFS (log-rank-test; N=38). In panel C, time is since initiation of therapy. The percentage of terminally exhausted CD8+ cells is calculated relatively to all CD8+ cells. Low corresponds to percentages that are inferior to the median while high corresponds to percentages that are higher than the median. The threshold for statistical significance in all the analyses was set at a p-value of 0.05.

References

    1. “Kidney and Renal Pelvis Cancer — Cancer Stat Facts.” [Online]. Available: https://seer.cancer.gov/statfacts/html/kidrp.html. [Accessed: 13-Oct-2022].
    1. Lopez-Beltran A, Scarpelli M, Montironi R, and Kirkali Z, “2004 WHO Classification of the Renal Tumors of the Adults,” Eur. Urol, vol. 49, no. 5, pp. 798–805, May 2006. - PubMed
    1. Blum KA et al., “Sarcomatoid renal cell carcinoma: biology, natural history and management,” Nat. Rev. Urol. 2020 1712, vol. 17, no. 12, pp. 659–678, Oct. 2020. - PMC - PubMed
    1. Motzer RJ et al., “Nivolumab plus Ipilimumab versus Sunitinib in Advanced Renal-Cell Carcinoma,” N. Engl. J. Med, vol. 378, no. 14, pp. 1277–1290, Apr. 2018. - PMC - PubMed
    1. Rini BI et al., “Pembrolizumab plus Axitinib versus Sunitinib for Advanced Renal-Cell Carcinoma,” N. Engl. J. Med, vol. 380, no. 12, pp. 1116–1127, Mar. 2019. - PubMed

Publication types

MeSH terms

Associated data