. 2023 Aug 1;133(15):e163841.
doi: 10.1172/JCI163841.

SCCA1/SERPINB3 suppresses antitumor immunity and blunts therapy-induced T cell responses via STAT-dependent chemokine production

Affiliations

SCCA1/SERPINB3 suppresses antitumor immunity and blunts therapy-induced T cell responses via STAT-dependent chemokine production

Liyun Chen et al. J Clin Invest. .

Abstract

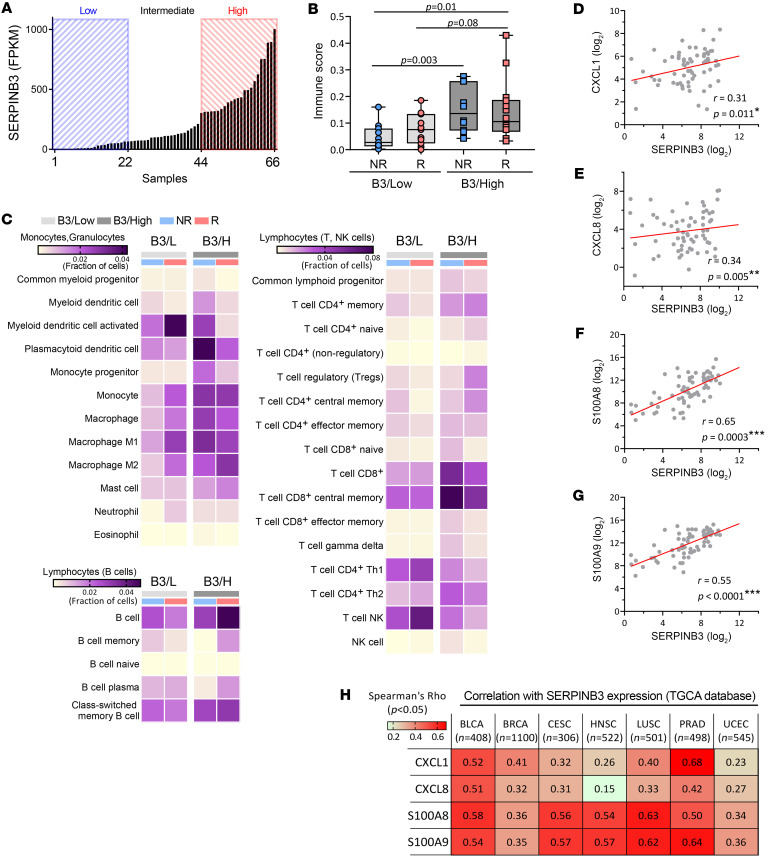
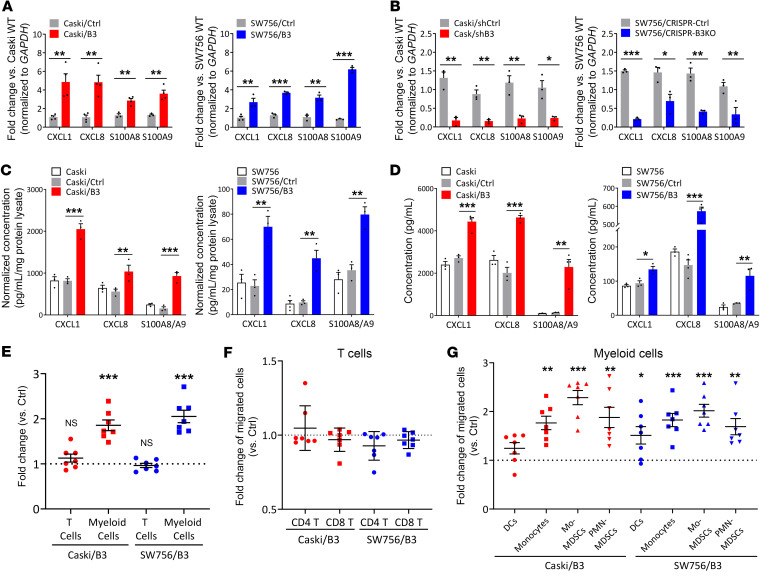
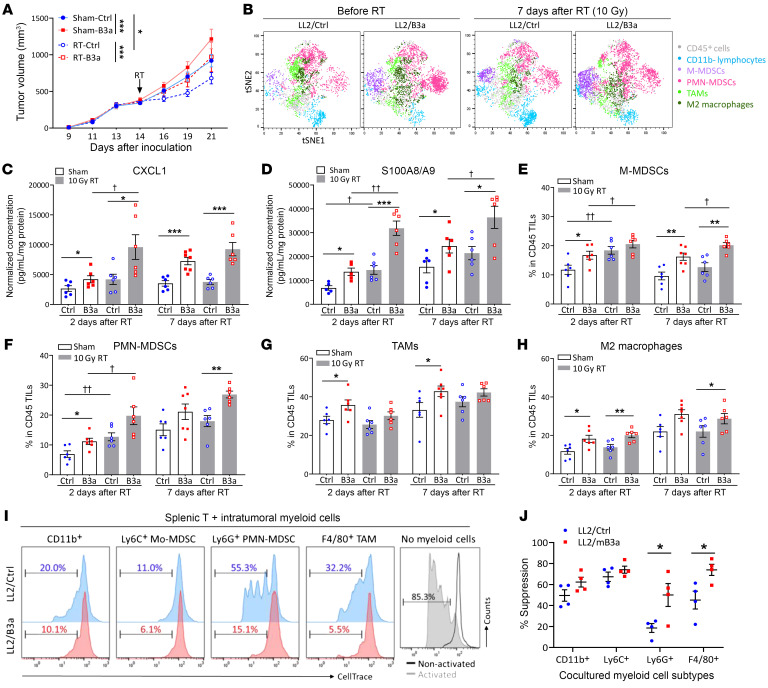
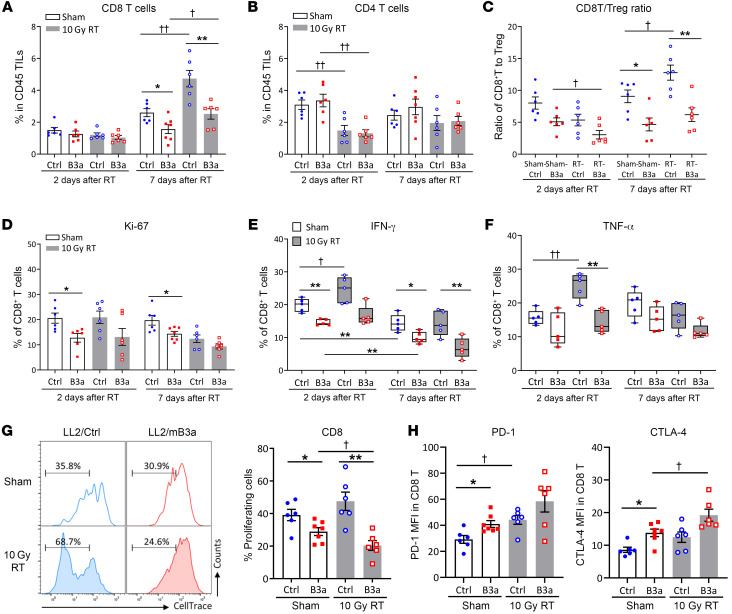
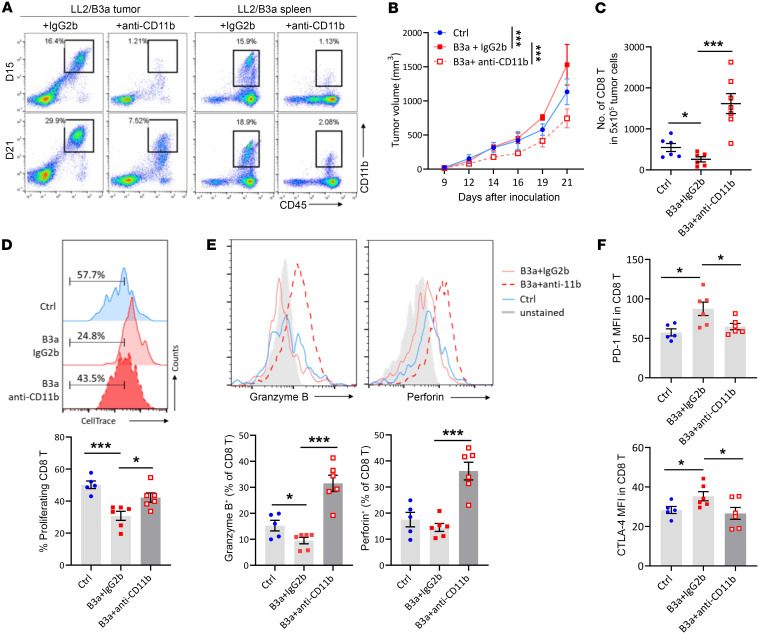
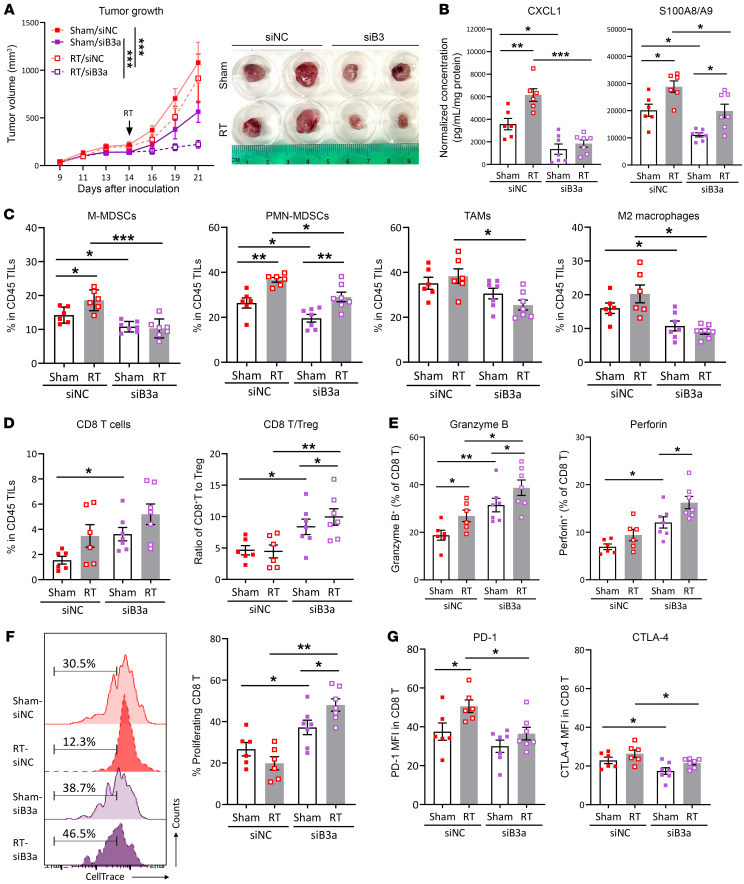
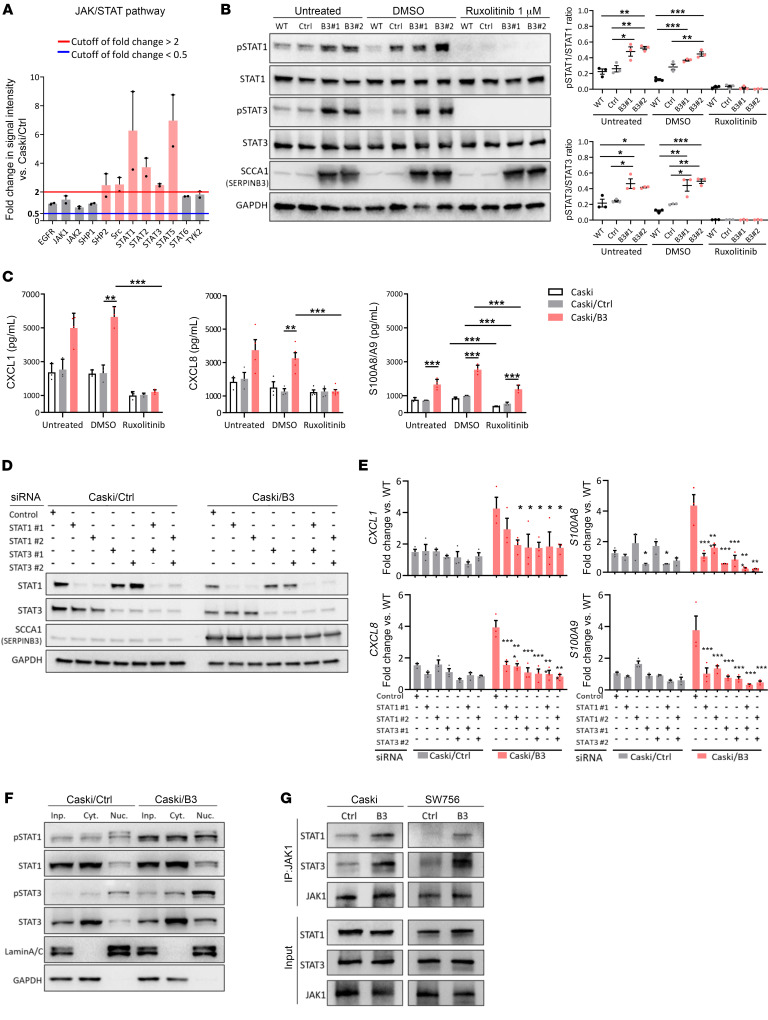
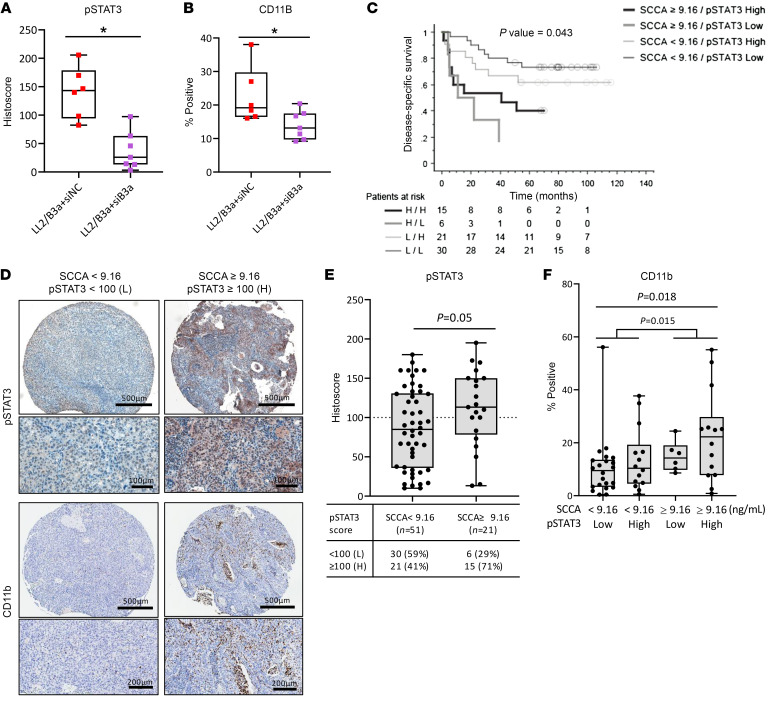
Patients with cancer who have high serum levels of squamous cell carcinoma antigen 1 (SCCA1, now referred to as SERPINB3) commonly experience treatment resistance and have a poor prognosis. Despite being a clinical biomarker, the modulation of SERPINB3 in tumor immunity is poorly understood. We found positive correlations of SERPINB3 with CXCL1, CXCL8 (CXCL8/9), S100A8, and S100A9 (S100A8/A9) myeloid cell infiltration through RNA-Seq analysis of human primary cervical tumors. Induction of SERPINB3 resulted in increased CXCL1/8 and S100A8/A9 expression, which promoted monocyte and myeloid-derived suppressor cell (MDSC) migration in vitro. In mouse models, Serpinb3a tumors showed increased MDSC and tumor-associated macrophage (TAM) infiltration, contributing to T cell inhibition, and this was further augmented upon radiation. Intratumoral knockdown (KD) of Serpinb3a resulted in tumor growth inhibition and reduced CXCL1 and S100A8/A expression and MDSC and M2 macrophage infiltration. These changes led to enhanced cytotoxic T cell function and sensitized tumors to radiotherapy (RT). We further revealed that SERPINB3 promoted STAT-dependent expression of chemokines, whereby inhibition of STAT activation by ruxolitinib or siRNA abrogated CXCL1/8 and S100A8/ A9 expression in SERPINB3 cells. Patients with elevated pretreatment SCCA levels and high phosphorylated STAT3 (p-STAT3) had increased intratumoral CD11b+ myeloid cells compared with patients with low SCCA levels and p-STAT3, who had improved overall survival after RT. These findings provide a preclinical rationale for targeting SERPINB3 in tumors to counteract immunosuppression and improve the response to RT.

Keywords: Cervical cancer; Oncology; Radiation therapy.


Conflict of interest statement

Conflict of interest: The authors have declared that no conflict of interest exists

Figures

Figure 1
Figure 1. SERPINB3 tumors are marked by a myeloid cell–rich and immune-suppressive profile.
(A) Normalized SERPINB3 transcripts in cervical tumor biopsies from RNA-Seq were distributed by reads per kilobase of transcript per million mapped reads (RPKM). (B) Box plots along with individual data points show xCell immune scores in recurrent (R)/nonrecurrent (NR) B3/L and B3/H tumors. *P < 0.05, by 1-way ANOVA. (C) A heatmap of enriched immune cell subpopulations was generated through xCell immune infiltrate prediction. The color intensity is proportional to the average xCell score for each cell population across samples. (DG) Spearman’s correlation of SERPINB3 with the expression of (D) CXCL1, (E) CXCL8, (F) S100A8, and (G) S100A9 from RNA-Seq of 66 cervical tumor biopsies collected prior to (chemo)-RT. (H) SERPINB3 expression correlated with CXCL1, CXCL8, S100A8, and S100A9 expression in multiple cancer types. Analysis was performed using TCGA PanCancer Atlas, and numeric values indicate Spearman’s correlation coefficient. BLCA, bladder urothelial carcinoma; BRCA, breast invasive carcinoma; HNSC, head and neck squamous cell carcinoma; LUSC, lung squamous cell carcinoma; PRAD, prostate adenocarcinoma; UCEC, uterine corpus endometrial carcinoma.
Figure 2
Figure 2. SERPINB3 results in upregulation of CXCL1/8 and S100A8/A9 chemoattractants, promoting myeloid cell migration from patient-derived peripheral blood.
(A) Cells were transduced with pUltra vector (Caski/Ctrl, SW756/Ctrl) or pUltra-SERPINB3 (Caski/B3, SW756/B3), and CXCL1/8 and S100A8/A9 expression was examined by qPCR. (B) Caski cells were transfected with scrambled negative control shRNA (Caski/shCtrl) or shRNAs specifically against SERPINB3 (Caski/shB3); SW756 cells were transduced with a CRISPR control vector (SW756/CRISPR-Ctrl) or CRISPR/Cas9 for SERPINB3 KD (SW756/CRISPR-B3KO). CXCL1/8 and S100A8/A9 expression was examined by qPCR. Gene expression was normalized to GAPDH, and fold changes were calculated by comparing with expression levels in parental cells (Caski WT or SW756 WT). (C) Intracellular chemokine protein expression was measured by ELISA, and expression levels were normalized to the total protein concentration. (D) Supernatant was collected from adherent cells in the monolayer, and chemokine secretion was measured by ELISA. Data are presented as the mean ± SEM of 3 independent experiments. *P < 0.05, **P < 0.01, and ***P < 0.001, by Mann-Whitney U test (A and B) and 1-way ANOVA with Tukey’s post hoc test (C and D). (EG) PBMC migration toward supernatant collected from cancer cells was examined by Transwell assays, and the migrated PBMC populations were analyzed by flow cytometry (Supplemental Figure 3A). Fold changes were calculated as the percentage of migrated (E) T cells and myeloid cells, (F) T cell subsets, and (G) myeloid cell subsets in Caski/B3 or SW756/B3 supernatant relative to Caski/Ctrl or SW756/Ctrl supernatant. Data are shown as the mean ± SEM. *P < 0.05, **P < 0.01, and ***P < 0.001, by 2-tailed, 1-sample t test against 1. Each dot represents the mean of duplicate values for a single donor sample (n = 7).
Figure 3
Figure 3. SERPINB3 tumors are enriched for suppressive myeloid cells, and this suppression is further augmented by RT.
(A) Tumor growth of C57/BL6 mice with LL2/Ctrl tumors (blue lines) and LL2/B3a tumors (red lines) randomized to receive sham treatment (solid lines) or 10 Gy RT on day 14 (dotted lines). *P < 0.05 and ***P < 0.001, by 2-way ANOVA. (B) viSNE plots show flow cytometric analysis of total viable CD45+ immune cells from tumors with separate clustering by predefined cell-surface markers, including M-MDSCs (CD11b+Ly6GLy6Chi), PMN-MDSCs (CD11b+Ly6G+), TAMs (CD11b+Ly6GF4/80+), M2 macrophages (CD11b+Ly6GF4/80+CD163+), and lymphocytes (CD45+CD11b). (C and D) The chemokines CXCL1 and S100A8/A9 in tumor homogenates were examined by ELISA. Data were normalized to the protein concentration for each tumor homogenate. (EH) Cumulative data from FACS analysis show alteration of immune cell infiltration by SERPINB3 expression and radiation in LL2 tumors. The graphs represent the frequencies of (E) CD11b+Ly6GLy6Chi M-MDSCs, (F) CD11b+Ly6G+ PMN-MDSCs, (G) CD11b+Ly6G-F4/80+ TAMs, (H) CD11b+Ly6G-F4/80+CD163+ M2 macrophages in total TILs. Data in CH are shown as the mean ± SEM, and each dot represents a biologically independent animal; asterisks indicate comparisons between LL2/Ctrl and LL2/B3a; cross symbols indicate comparisons between sham-treated and RT. *,P < 0.05, **,††P < 0.01, and ***P < 0.001, by 1-way ANOVA with Tukey’s post hoc test. (I and J) Myeloid cell subtypes were isolated from tumors and cocultured with CellTrace-labeled splenic T cells at a ratio of 1:1 for 4 days. Anti-CD3/anti-CD28 antibodies were added to stimulate T cell proliferation. Histograms show the percentage of divided cells. The percentages of suppression were calculated by comparing with the dilution of CellTrace in splenic T cells without myeloid cell coculturing. Data in I and J are shown as the mean ± SEM. *P < 0.05, by Mann-Whitney U test.
Figure 4
Figure 4. Cytotoxic T cells from SERPINB3 tumors display impaired proliferation and exhausted phenotypes.
Cumulative data from FACS analysis of (A) CD3+CD8+ T cells and (B) CD3+CD4+ T cells in tumors. (C) The ratio of CD8+ T cells/Tregs represented the infiltrating percentage of CD8+ T cells relative to CD4+CD25+FoxP3+ Tregs. (D) Frequencies of Ki-67+CD8+ T cells in the total infiltrating CD8+ T cell population were analyzed by flow cytometry. (E and F) Intratumoral T cells were stimulated with phorbol 12-myristate 13-acetate (PMA)/ionomycin for 5 hours, and the expression of IFN-γ and TNF-α was assessed by intracellular staining via flow cytometry. The protein transport inhibitor brefeldin A was used to block the protein transport processes and cytokine release. Positive expression was normalized to cells without PMA/ionomycin stimulation (basal levels). Box plot whiskers span the minimum and maximum values, and lines represent the median. (G) CellTrace-labeled intratumoral T cells were stimulated with anti-CD3/anti-CD28 antibody for 4 days, and cell proliferation was determined by the dilution of CellTrace. (H) PD-1 and CTLA-4 expression was examined by flow cytometry and is shown as MFI. Data are shown as the mean ± SEM, and each dot represents a biologically independent sample. Asterisks indicate comparisons between LL2/Ctrl and LL2/B3a; cross symbols indicate comparisons between sham- and RT-treated animals. *,P < 0.05, **,††P < 0.01, and ***P < 0.001, by 1-way ANOVA with Tukey’s post hoc test.
Figure 5
Figure 5. Depleting CD11b+ myeloid cells in SERPINB3 tumors improves T cell activity.
(A) Representative plots show the depletion of CD11b+ cells, gated on CD45+CD11b+ cells, in tumors and spleens on day 15 and day 21 after tumor inoculation. (B) Tumor growth of LL2/Ctrl tumors (blue line) and LL2/B3a tumors treated with anti-CD11b antibody (red dotted line) or anti-IgG2b antibody (red solid line). ***P < 0.001, by 2-way ANOVA. (C) The numbers of infiltrating CD8+ T cells in 5 × 10⁵ total tumor cells were determined by flow cytometry. (D) CellTrace-labeled intratumoral T cells were stimulated with anti-CD3/anti-CD28 antibody for 4 days, and cell proliferation was determined by the dilution of CellTrace. (E) Representative histograms of intracellular cytokine staining of granzyme B and perforin in CD8+ T cells. (F) PD-1 and CTLA-4 expression was examined by flow cytometry and is shown as MFI. Data in CF are shown as the mean ± SEM, and each dot represents a biologically independent sample. *P < 0.05 and ***P < 0.001, by 1-way ANOVA with Tukey’s post hoc test.
Figure 6
Figure 6. Targeting SERPINB3 sensitizes tumors to RT and enhances T cell response.
(A) Growth curves of LL2/B3 tumors treated with siNC (red lines) and siB3 (purple lines) with or without RT (sham: solid lines; RT: dotted lines). ***P < 0.001, by 2-way ANOVA. (B) The chemokines CXCL1 and S100A8/A9 in tumor homogenates were assessed by ELISA. Data were normalized to the protein concentration for each tumor homogenate. (C and D) Cumulative data from FACS analysis show the (C) frequencies of immune cell populations including CD11b+Ly6G-Ly6Chi M-MDSCs, CD11b+Ly6G+ PMN-MDSCs, CD11b+Ly6G-F4/80+ TAMs, and CD11b+Ly6G-F4/80+CD163+ M2 macrophages, as well as (D) CD3+CD8+ T cells in total TILs and the ratio of CD3+CD8+ T cells to CD4+CD25+Foxp3+ Tregs. (E) Intracellular cytokine staining for granzyme B and perforin in CD8+ T cells was analyzed by flow cytometry. (F) CellTrace-labeled intratumoral T cells were stimulated with anti-CD3/anti-CD28 antibody for 4 days, and cell proliferation was determined by the dilution of CellTrace. (G) The expression of PD-1 and CTLA-4 was examined by flow cytometry and is shown as MFI. Data in BG are shown as the mean ± SEM, and each dot represents a biologically independent sample. *P < 0.05, **P < 0.01, and ***P < 0.001, by 1-way ANOVA with Tukey’s post hoc test.
Figure 7
Figure 7. SERPINB3 mediates suppressive chemokine production by promoting STAT activation.
(A) Activation of JAK/STAT pathway-associated proteins was evaluated by phosphorylation antibody array. Fold changes in phosphorylation were calculated by normalizing the intensity to the expression levels in Caski parental cells and comparing the phosphorylation intensity in Caski/B3 cells with the levels in Caski/Ctrl cells. The red line indicates a fold change of 2 or greater, and the blue line indicates a fold change of 0.5 or less. (B) Immunoblotting (left) and quantification (right) show the inhibition of STAT1/3 phosphorylation after treating Caski parental cells (WT), Caski/Ctrl cells (C), and Caski/B3 (B3#1, B3#2) cells with 1 μM ruxolitinib for 48 hours. (C) Caski/WT, Caski/Ctrl, and Caski/B3 cells were treated with 1 μM ruxolitinib, and the secretion of CXCL1, CXCL8, and S100A8/A9 was assessed by ELISA. (D) Immunoblotting shows the KD of STAT1/3 by siRNA in Caski cells. (E) The expression of CXCL1/8 and S100A8/A9 mRNA was examined by qPCR. Gene expression was normalized to GAPDH. Fold changes and significance were calculated by comparing to the expression levels in Caski/Ctrl cells transfected with the negative control siRNA. (F) p-STAT1/3 expression in the nucleus (Nuc.), cytoplasm (Cyt.), and total cell lysates (input, Inp.) was measured by immunoblotting. (G) Immunoprecipitation using anti-JAK1 antibody shows increased interaction with STAT1 and STAT3 in Caski/B3 and SW756/B3 cells compared with Caski/Ctrl and SW756/Ctrl cells, respectively. Data are shown as the mean ± SEM of 3 experiments. *P < 0.05, **P < 0.01, and ***P < 0.001, by 1-way ANOVA with Tukey’s post hoc test.
Figure 8
Figure 8. Elevated serum SCCA levels and high tumor p-STAT3 are associated with CD11b expression and poor cancer-specific survival after CRT.
(A and B) Quantification of immunostaining for p-STAT3 and CD11b expression in mouse tumors treated with siNC or siB3. Box plots show p-STAT3 staining scores and the percentage of CD11b+ staining from 8–12 representative fields each for 6–7 mice per group. Box plot whiskers span the minimum and maximum values; lines represent the median. (C) Kaplan-Meier plot shows overall survival for patients with serum SCCA levels below 9.16 ng/mL and a p-STAT3 histoscore below 100 (n = 30) or of 100 or higher (n = 21), compared with patients with serum SCCA levels of 9.16 ng/mL or higher with a p-STAT3 histoscore below 100 (n = 6) or of 100 or higher (n = 15). The average pretreatment serum SCCA value of 9.16 ng/mL from 72 patients with cancer was used as a cutoff. L, low; H, high. (D) Representative images of p-STAT3 and CD11b staining for patients with SCCA levels below 9.16 ng/mL or of 9.16 ng/mL or higher. Scale bars: 100 μm, 200 μm, and 500 μm. (E) p-STAT3 staining score (histoscore) for patients with serum SCCA levels below 9.16 ng/mL versus those with SCCA levels of 9.16 ng/mL or higher. (F) Percentage of the myeloid cell marker CD11b staining in patients with serum SCCA levels below 9.16 ng/mL or of 9.16 ng/mL or higher and a p-STAT3 histoscore below 100 (low) or of 100 or higher (high). Each dot represents an individual patient. Data are shown as the mean ± SEM. A Mann-Whitney U test was used to determine statistical significance.

References

    1. Bernier J, et al. Radiation oncology: a century of achievements. Nat Rev Cancer. 2004;4(9):737–747. doi: 10.1038/nrc1451. - DOI - PubMed
    1. Spina CS, Drake CG. Mechanisms of immune modulation by radiation. Semin Radiat Oncol. 2021;31(3):205–216. doi: 10.1016/j.semradonc.2021.02.001. - DOI - PubMed
    1. Colton M, et al. Reprogramming the tumour microenvironment by radiotherapy: implications for radiotherapy and immunotherapy combinations. Radiat Oncol. 2020;15(1):254. doi: 10.1186/s13014-020-01678-1. - DOI - PMC - PubMed
    1. Kohli K, et al. Key chemokines direct migration of immune cells in solid tumors. Cancer Gene Ther. 2021;29(1):10–21. doi: 10.1038/s41417-021-00303-x. - DOI - PMC - PubMed
    1. Matsumura S, et al. Radiation-induced CXCL16 release by breast cancer cells attracts effector T cells. J Immunol. 2008;181(5):3099–3107. doi: 10.4049/jimmunol.181.5.3099. - DOI - PMC - PubMed

Publication types