. 2023 Jun 26;63(12):3827-3838.
doi: 10.1021/acs.jcim.3c00530. Epub 2023 Jun 6.

Automatic Optimization of Lipid Models in the Martini Force Field Using SwarmCG

Affiliations

Automatic Optimization of Lipid Models in the Martini Force Field Using SwarmCG

Charly Empereur-Mot et al. J Chem Inf Model. .

Abstract

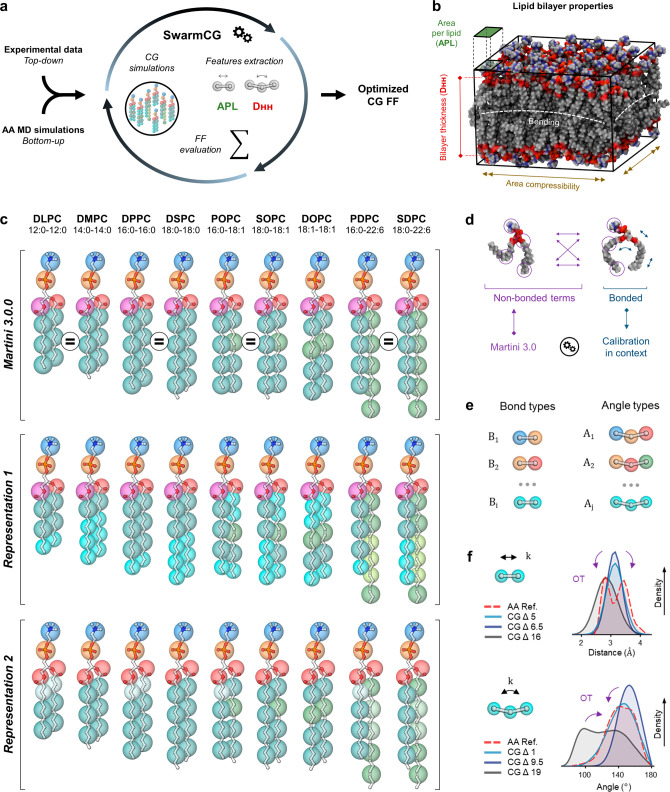
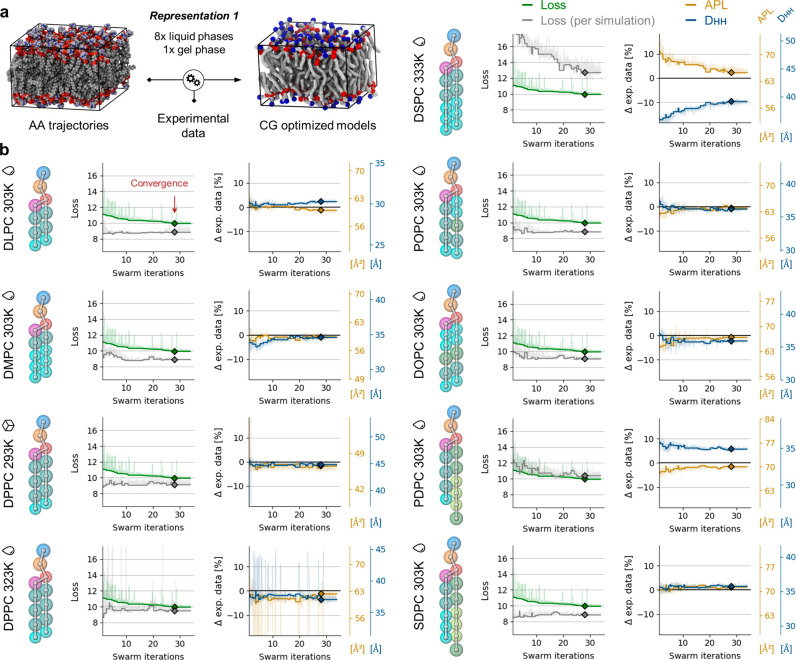
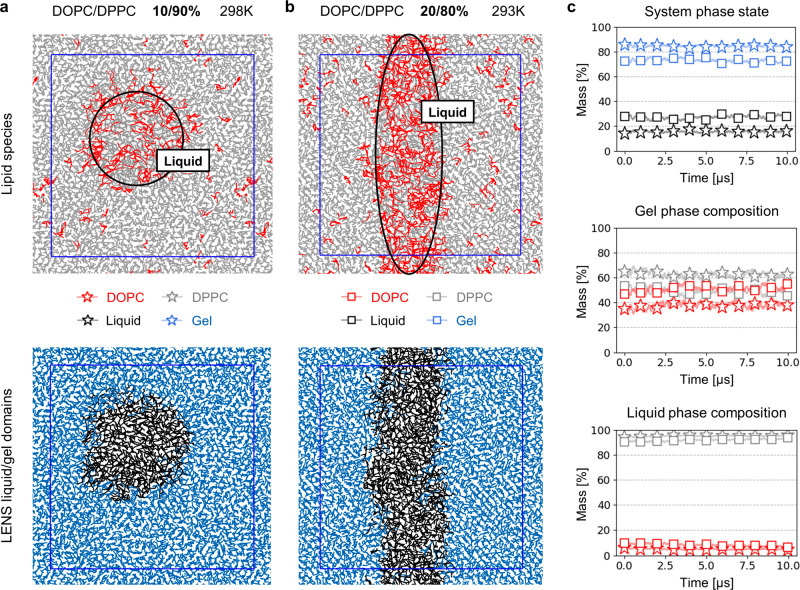
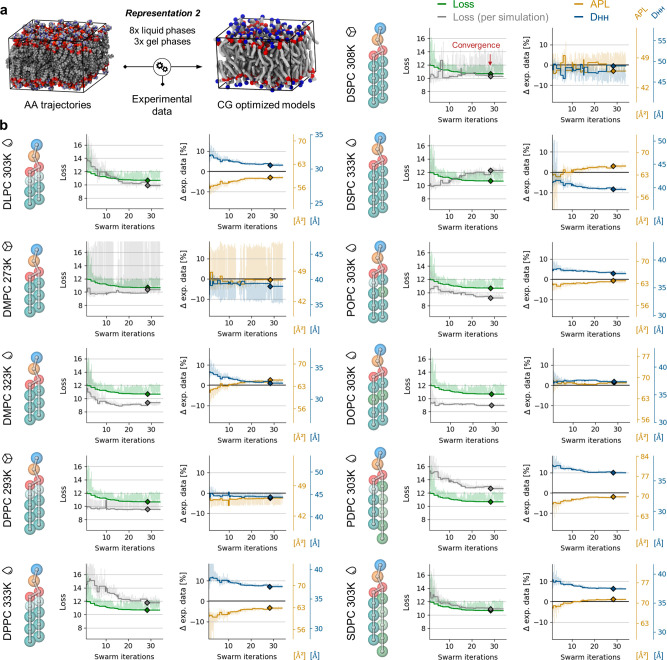
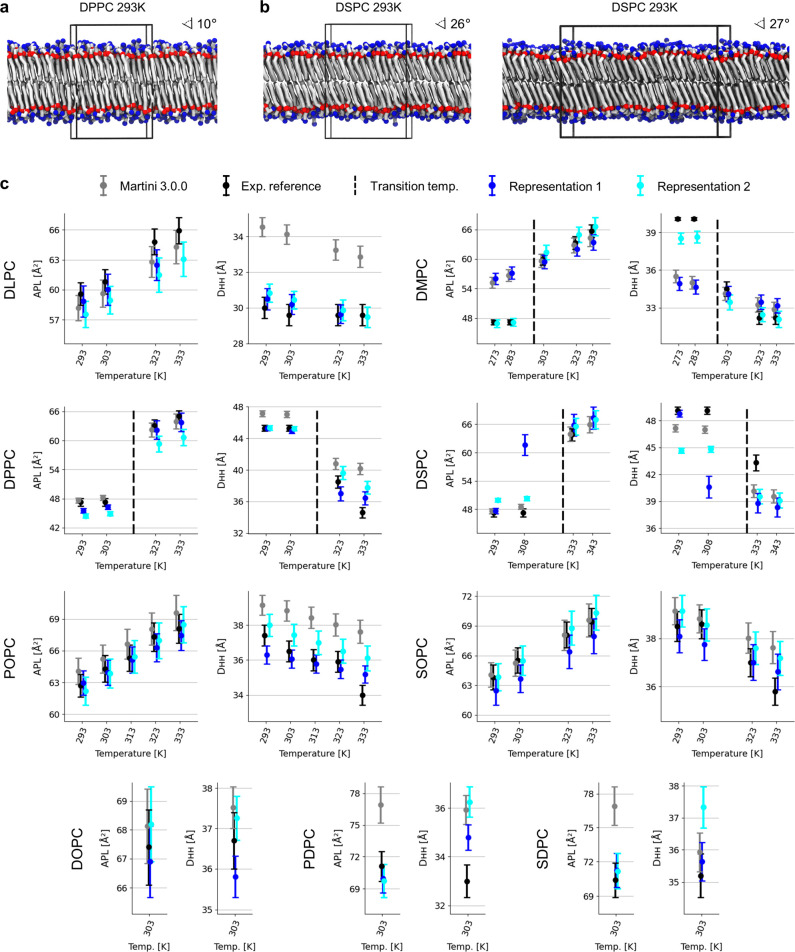
After two decades of continued development of the Martini coarse-grained force field (CG FF), further refinment of the already rather accurate Martini lipid models has become a demanding task that could benefit from integrative data-driven methods. Automatic approaches are increasingly used in the development of accurate molecular models, but they typically make use of specifically designed interaction potentials that transfer poorly to molecular systems or conditions different than those used for model calibration. As a proof of concept, here, we employ SwarmCG, an automatic multiobjective optimization approach facilitating the development of lipid force fields, to refine specifically the bonded interaction parameters in building blocks of lipid models within the framework of the general Martini CG FF. As targets of the optimization procedure, we employ both experimental observables (top-down references: area per lipid and bilayer thickness) and all-atom molecular dynamics simulations (bottom-up reference), which respectively inform on the supra-molecular structure of the lipid bilayer systems and on their submolecular dynamics. In our training sets, we simulate at different temperatures in the liquid and gel phases up to 11 homogeneous lamellar bilayers composed of phosphatidylcholine lipids spanning various tail lengths and degrees of (un)saturation. We explore different CG representations of the molecules and evaluate improvements a posteriori using additional simulation temperatures and a portion of the phase diagram of a DOPC/DPPC mixture. Successfully optimizing up to ∼80 model parameters within still limited computational budgets, we show that this protocol allows the obtainment of improved transferable Martini lipid models. In particular, the results of this study demonstrate how a fine-tuning of the representation and parameters of the models may improve their accuracy and how automatic approaches, such as SwarmCG, may be very useful to this end.


Conflict of interest statement

The authors declare no competing financial interest.

Figures

Figure 1
Figure 1
Overview of the protocol followed for obtaining bonded parameters via SwarmCG for different CG models of lipids within the framework of Martini 3.0.0. (a) SwarmCG simultaneously relies on bottom-up and top-down references to iteratively optimize model parameters using higher-resolution AA MD simulations and experimental data. (b) Illustration of lipid bilayer properties showing notably the APL and DHH used for calculating the top-down component of the loss function. (c) Overview of the CG representations of interest in this study with CG beads mapping shown over AA structures using beads Q1 (dark blue), Q5 (orange), SN4a (red), N4a (purple), C1 (blue), SC2 (cyan), SC1 (white), C4h (olive), C5h (light green), and SC4h (bright yellow/green). SOPC is left out of the optimization procedures and used as part of the posterior evaluations. (d) Principle of the parameters calibration in this study: bonded parameters of the models are calibrated in the context of nonbonded interaction terms set to Martini 3.0.0, thereby iterating CG MD simulations of bilayers composed of different types of lipids. (e) CG bonds and angles are defined as building blocks and classified according to the CG beads they involve, which defines the type of a specific bond/angle, as well as the parameters employed. (f) Principle of the OT-B metrics used for exploiting structure-based information from AA reference simulations.
Figure 2
Figure 2
Multiobjective optimization of the bonded parameters of the FF for PC lipid models built in the framework of Martini 3.0.0 using Representation 1 and in the training set bilayers of 8 different lipid types simulated at nine temperatures (DLPC, 303 K; DMPC, 303 K; DPPC, 293 and 323 K; DSPC, 333 K; POPC, 303 K; DOPC, 303 K; PDPC, 303 K; and SDPC, 303 K). (a) Illustration summarizing the workflow. (b) Left panels: loss global (green) and loss per bilayer simulation (gray) in the training set. Right panels: APL (yellow) and DHH (blue) for each bilayer simulation in the training set. The horizontal black lines set at 0 identify the target experimental APL and DHH values. Solid curves are values corresponding to the best global loss at any point during optimization. Shaded lines show raw data. Diamonds represent values at convergence obtained with the optimized bonded parameters. The drop and box icons, respectively, represent the liquid and gel states of pure lipid bilayers at the corresponding temperatures.
Figure 3
Figure 3
Characterization of the phase separation in DOPC/DPPC mixtures with lipid models using Representation 1. (a) Orthogonal view of a bilayer composed of 1152 lipids at 10/90% mass of DOPC/DPPC. Top: colored according to lipid type (red, DOPC; gray, DPPC). Bottom: colored according to phase state using LENS (blue, gel phase; black, liquid phase). (b) Orthogonal view of a bilayer composed of 1152 lipids at 20/80% mass of DOPC/DPPC. Top: colored according to lipid type (red, DOPC; gray, DPPC). Bottom: colored according to phase state using LENS (blue, gel phase; black, liquid phase). (c) Top: mass percentage of the system in the gel (blue) and liquid (black) phase across simulations at 10% (stars) and 20% (squares) mass DOPC. Middle: mass percentage of DOPC (red) and DPPC (gray) found in the gel phase across simulations at 10% (stars) and 20% (squares) mass DOPC. Bottom: mass percentage of DOPC (red) and DPPC (gray) found in the liquid phase across simulations at 10% (stars) and 20% (squares) mass of DOPC.
Figure 4
Figure 4
Multiobjective optimization of the bonded parameters of the FF for PC lipid models built in the framework of Martini 3.0.0 using Representation 2 and in the training set bilayers of 8 different lipid types simulated at 11 temperatures (DLPC, 303 K; DMPC, 273 and 303 K; DPPC, 293 and 323 K; DSPC, 308 and 333 K; POPC, 303 K; DOPC, 303 K; PDPC 303 K; and SDPC 303 K). (a) Illustration summarizing the workflow. (b) Left panels: loss global (green) and loss per bilayer simulation (gray) in the training set. Right panels: APL (yellow) and DHH (blue) for each bilayer simulation in the training set. The horizontal black lines set at 0 identify the target experimental APL and DHH values. Solid curves are values corresponding to the best global loss at any point during optimization. Shaded lines show raw data. Diamonds represent values at convergence obtained with the optimized bonded parameters. The drop and box icons, respectively, represent the liquid and gel states of pure lipid bilayers at the corresponding temperatures.
Figure 5
Figure 5
Overview of the structural properties observed for patches of lipid bilayers across multiples temperatures in the liquid and gel phases. (a) Snapshot of a DPPC bilayer simulated using Representation 2 and 128 lipids at 293 K, which exhibits moderate tails tilting. (b) Snapshots of a DSPC bilayer simulated using Representation 2 at 293 K, which exhibit significant tails tilting using either 128 lipids (left) or 512 lipids (right). (c) Summary of the APL and DHH thickness values for the eight PC lipid models in the training sets and for SOPC observed experimentally (black) or in simulations using Martini 3.0.0 (gray), Representation 1 (dark blue), and Representation 2 (cyan). Dashed horizontal lines indicate the gel/liquid transition temperatures. Error bars represent ± one standard deviation (simulations) or the measurement error (experimental). Dots represent average values (simulations) and the indicated measure (experimental).

References

    1. Jin J.; Pak A. J.; Durumeric A. E. P.; Loose T. D.; Voth G. A. Bottom-up Coarse-Graining: Principles and Perspectives. J. Chem. Theory Comput. 2022, 18 (10), 5759–5791. 10.1021/acs.jctc.2c00643. - DOI - PMC - PubMed
    1. Marrink S. J.; Monticelli L.; Melo M. N.; Alessandri R.; Tieleman D. P.; Souza P. C. T. Two Decades of Martini: Better Beads, Broader Scope. WIREs Comput. Mol. Sci. 2023, 13 (1), e162010.1002/wcms.1620. - DOI
    1. Marrink S. J.; de Vries A. H.; Mark A. E. Coarse Grained Model for Semiquantitative Lipid Simulations. J. Phys. Chem. B 2004, 108 (2), 750–760. 10.1021/jp036508g. - DOI
    1. Souza P. C. T.; Alessandri R.; Barnoud J.; Thallmair S.; Faustino I.; Grünewald F.; Patmanidis I.; Abdizadeh H.; Bruininks B. M. H.; Wassenaar T. A.; Kroon P. C.; Melcr J.; Nieto V.; Corradi V.; Khan H. M.; Domański J.; Javanainen M.; Martinez-Seara H.; Reuter N.; Best R. B.; Vattulainen I.; Monticelli L.; Periole X.; Tieleman D. P.; de Vries A. H.; Marrink S. J. Martini 3: A General Purpose Force Field for Coarse-Grained Molecular Dynamics. Nat. Methods 2021, 18 (4), 382–388. 10.1038/s41592-021-01098-3. - DOI - PubMed
    1. Marrink S. J.; Risselada H. J.; Yefimov S.; Tieleman D. P.; de Vries A. H. The MARTINI Force Field: Coarse Grained Model for Biomolecular Simulations. J. Phys. Chem. B 2007, 111 (27), 7812–7824. 10.1021/jp071097f. - DOI - PubMed

Publication types

MeSH terms