. 2023 Jun 13;120(24):e2301876120.
doi: 10.1073/pnas.2301876120. Epub 2023 Jun 6.

Gene expression detection in developing mouse tissue using in situ hybridization and µCT imaging

Affiliations

Gene expression detection in developing mouse tissue using in situ hybridization and µCT imaging

Vilma Väänänen et al. Proc Natl Acad Sci U S A. .

Abstract

High resolution and noninvasiveness have made soft-tissue X-ray microtomography (µCT) a widely applicable three-dimensional (3D) imaging method in studies of morphology and development. However, scarcity of molecular probes to visualize gene activity with µCT has remained a challenge. Here, we apply horseradish peroxidase-assisted reduction of silver and catalytic gold enhancement of the silver deposit to in situ hybridization in order to detect gene expression in developing tissues with µCT (here called GECT, gene expression CT). We show that GECT detects expression patterns of collagen type II alpha 1 and sonic hedgehog in developing mouse tissues comparably with an alkaline phosphatase-based detection method. After detection, expression patterns are visualized with laboratory µCT, demonstrating that GECT is compatible with varying levels of gene expression and varying sizes of expression regions. Additionally, we show that the method is compatible with prior phosphotungstic acid staining, a conventional contrast staining approach in µCT imaging of soft tissues. Overall, GECT is a method that can be integrated with existing laboratory routines to obtain spatially accurate 3D detection of gene expression.

Keywords: development; gene expression; in situ hybridization; µCT imaging.


Conflict of interest statement

The authors declare no competing interest.

Figures
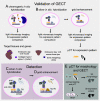
Fig 1.
Fig 1.
Validation of gene expression CT (GECT) and the pipeline for µCT imaging of morphology and gene expression. Validation was conducted by performing chromogenic (A) and silver (B) in situ hybridizations in parallel followed by gold enhancement on silver in situ samples. (C) Silver detection was conducted with horseradish peroxidase (HRP)–conjugated anti-DIG antibody and standard commercial detection kit (EnzMet, enzymatic metallography, Nanoprobes). During detection, HRP facilitates reduction of silver ions on sites of antibody (and probe) binding. (D) Gold enhancement (Gold Enhancement for LM, Nanoprobes) utilizes the silver condensates in the tissue as seeding particles and covers them with elemental gold by reducing gold ions in solution. The resulting signal was imaged with light microscopy and µCT. Some samples underwent µCT after silver in situ hybridization (C) and all samples underwent µCT after gold enhancement (D). (E) To further validate the detection scheme for routine use, we stained additional samples with PTA and imaged them with µCT to obtain representation of 3D morphology and conducted gene expression detection after µCT imaging for morphology.
Fig 2.
Fig 2.
Detection of Collagen type 2 alpha 1 (Col2a1) expression with µCT. (A) Chromogenic in situ hybridization of Col2a1 in e12.5 mouse embryo. (B) Silver in situ hybridization of Col2a1. (C) Gold enhancement of silver in situ hybridization shown in B. (D) Volume rendering of Col2a1 expression shown in C. (E) Close-up of the Left Upper limb shown in A. (F) Close-up of the Left Upper limb shown in B. (G) Close-up of the Left Upper limb shown in C. (H) Close-up of the Left Upper limb shown in D. (Scale 1,000 µm in AD, 500 µm in EH.)
Fig 3.
Fig 3.
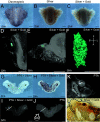
Tissue contrast staining before gene expression detection. (A) Silver in situ hybridization of Col2a1 without prior PTA stain. (B) Gold enhancement of Col2a1 detection shown in A. (C) Silver in situ hybridization of Col2a1 in the mouse embryo stained with PTA. (D) Gold enhancement of Col2a1 detection shown in C. (E) Volume rendering of the contrast-stained mouse embryo, prior to in situ hybridization. (F) Cross-section of the mouse embryo shown in E. (G) Volume rendering of Col2a1 expression shown in D. (H) Close-up of the Left hindlimb shown in G. Segmented Col2a1 expression inside the limb shown in magenta, sagittal view. (I) Segmented Col2a1 expression (magenta) inside the Left hindlimb, transverse view. (Scale 1,000 µm in A–G, 500 µm in H–I.)
Fig 4.
Fig 4.
µCT visualization of Sonic hedgehog (Shh) expression from unstained and contrast-stained tissues. (A) Chromogenic in situ hybridization of Shh expression in mouse e14.5 jaw. (B) Silver in situ hybridization of Shh. (C) Gold enhancement of Shh detection shown in B. (D) Volume rendering of Shh expression from µCT data, occlusal view. Expression in the embryonic molar shown in teal. (E) Volume rendering of Shh expression, expression in the embryonic molar shown in teal, frontal view. (F) Segmented expression region of Shh in the mouse molar, occlusal view. B = buccal, L = lingual, A = anterior, P = posterior. (G) Silver in situ hybridization for Shh applied to contrast-stained jaw. (H) Gold enhancement of Shh detection shown in G. (I) Volume rendering of µCT data from the jaw shown in H. (J) Volume rendering of contrast-stained jaw shown in GI, prior to Shh detection. White line shows approximate section plane shown in K. Structures of a developing molar in shown plane are visualized in schematic in the lower left corner. (K) Frontal virtual section of a developing molar stained with PTA. (L) Frontal vibratome section of the jaw underwent silver in situ hybridization and gold enhancement for Shh (dark brown). Epithelial tearing shown with arrow. (Scale 500 µm in A–E, 100 µm in F, 500 µm in G–J, 100 µm in K–L.)

References

    1. Mizutani R., Suzuki Y., X-ray microtomography in biology. Micron 43, 104–115 (2012). - PubMed
    1. Rawson S. D., Maksimcuka J., Withers P. J., Cartmell S. H., X-ray computed tomography in life sciences. BMC Biol. 18, 21 (2020). - PMC - PubMed
    1. Zysk A. M., et al. , Nondestructive volumetric imaging of tissue microstructure with benchtop x-ray phase-contrast tomography and critical point drying. Biomed. Opt. Express 3, 1924–1932 (2012). - PMC - PubMed
    1. Pauwels E., Van Loo D., Cornillie P., Brabant L., Van Hoorebeke L., An exploratory study of contrast agents for soft tissue visualization by means of high resolution X-ray computed tomography imaging. J. Microsc. 250, 21–31 (2013). - PubMed
    1. de Bournonville S., Vangrunderbeeck S., Kerckhofs G., Contrast-enhanced microCT for virtual 3D anatomical pathology of biological tissues: A literature review. Contrast Media Mol. Imaging 2019, 8617406 (2019). - PMC - PubMed

Publication types

LinkOut - more resources