. 2023 Aug 16;228(4):371-382.
doi: 10.1093/infdis/jiad203.

Ebola Virus Disease Features Hemophagocytic Lymphohistiocytosis/Macrophage Activation Syndrome in the Rhesus Macaque Model

Affiliations

Ebola Virus Disease Features Hemophagocytic Lymphohistiocytosis/Macrophage Activation Syndrome in the Rhesus Macaque Model

David X Liu et al. J Infect Dis. .

Abstract

Background: Ebola virus (EBOV) disease (EVD) is one of the most severe and fatal viral hemorrhagic fevers and appears to mimic many clinical and laboratory manifestations of hemophagocytic lymphohistiocytosis syndrome (HLS), also known as macrophage activation syndrome. However, a clear association is yet to be firmly established for effective host-targeted, immunomodulatory therapeutic approaches to improve outcomes in patients with severe EVD.

Methods: Twenty-four rhesus monkeys were exposed intramuscularly to the EBOV Kikwit isolate and euthanized at prescheduled time points or when they reached the end-stage disease criteria. Three additional monkeys were mock-exposed and used as uninfected controls.

Results: EBOV-exposed monkeys presented with clinicopathologic features of HLS, including fever, multiple organomegaly, pancytopenia, hemophagocytosis, hyperfibrinogenemia with disseminated intravascular coagulation, hypertriglyceridemia, hypercytokinemia, increased concentrations of soluble CD163 and CD25 in serum, and the loss of activated natural killer cells.

Conclusions: Our data suggest that EVD in the rhesus macaque model mimics pathophysiologic features of HLS/macrophage activation syndrome. Hence, regulating inflammation and immune function might provide an effective treatment for controlling the pathogenesis of acute EVD.

Keywords: Ebola virus disease; hemophagocytic lymphohistiocytosis syndrome; macrophage activation syndrome; sCD163; sCD25.


Conflict of interest statement

Potential conflicts of interest . All authors: No reported conflicts. All authors have submitted the ICMJE Form for Disclosure of Potential Conflicts of Interest. Conflicts that the editors consider relevant to the content of the manuscript have been disclosed.

Figures

Figure 1.
Figure 1.
Hemophagocytosis in Ebola virus (EBOV)–exposed nonhuman primates (NHPs) (hematoxylin-eosin staining). Hemophagocytosis was observed in the spleen (A), lymph node (B), and bone marrow (C), as well as Kupffer cells in the liver (D) from the terminal-group control monkeys. Representative images show that macrophages phagocytize neutrophils (arrows), lymphocytes (arrowhead), and erythrocytes (empty arrows). D, A Kupffer cell contains an intracytoplasmic viral inclusion body (>).
Figure 2.
Figure 2.
Serum soluble CD163 (sCD163) concentrations and circulating monocyte changes in Ebola virus (EBOV)–exposed monkeys. A, Significant increases in serum sCD163 concentrations at day 6 after EBOV exposure and at the terminal day (T). B, Flow cytometry and hematology show significant increases in total circulatory CD3CD14CD20CD11cCD163+ cells at 3, 4, and 5 days after exposure. C, There were no significant differences in the CD3CD14CD20CD163CD11c+ population during disease progression. D, Representative dot plots show an increased frequency of CD163+ and CD11c+ cells from 3 to 5 days after exposure. Each plot shows the percentage of CD163+ and CD11c+ cells in the gated population. *P < .05; **P < .01; ***P < .001.
Figure 3.
Figure 3.
Immunohistochemistry (IHC) and semiquantification by digital image analysis (SQDIA) of CD163+ cells in the spleen. A, IHC reveals that there are no (day 0; uninfected control), a small number (day 5 after exposure), and many (terminal day [T]) CD163+ cells (arrows) in the splenic white pulp, while the number of CD163+ cells in the splenic red pulp (>) decreases daily. B, C, SQDIA confirmed that the percentage of CD163+ cells increases significantly (B), but cell density (C) is decreased significantly in the splenic white pulp at T. **P < .01.
Figure 4.
Figure 4.
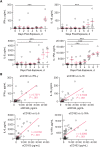
Serum cytokine concentrations and their correlations with soluble CD163 (sCD163). A, Higher serum concentrations of interferon (IFN) γ and interleukin 18, 6, and 1RA (IL-18, IL-6, and IL-1RA) were detected during disease progression. B, Significant positive correlations between sCD163 and IFN-γ, IL-18, IL-6, or IL-1RA. Data were analyzed by means of simple linear regression analysis. **P < .01; ***P < .001.
Figure 5.
Figure 5.
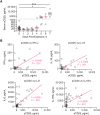
Serum soluble CD25 (sCD25) concentrations and their positive correlations with cytokines. A, Higher serum concentrations of sCD25 at day 6 after exposure and at the terminal day (T). B, sCD25 concentrations were correlated positively with interferon (IFN) γ and interleukin 18, 6, and 1RA (IL-18, IL-6, and IL-1RA). *P < .05; ***P < .001.
Figure 6.
Figure 6.
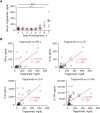
Serum triglyceride concentrations and their positive correlation with cytokines. A, Higher serum triglyceride concentrations at day 6 after exposure and at the terminal day (T). B. Positive correlations were detected between triglycerides and interferon (IFN) γ and interleukin 18, 6, and 1RA (IL-18, IL-6, or IL-1RA). **P < .01; ***P < .001.
Figure 7.
Figure 7.
Effect of Ebola virus (EBOV) infection on CD56+ peripheral natural killer (NK) cells in rhesus monkeys. A. The CD56+HLA-DR+–activated NK population decreased significantly at 1, 2, and 4 days after exposure, except for a transient increase observed at day 3. B. The CD56+HLA-DR–activated NK population remained steady throughout the study but was higher at day 4. C. Representative CD56 and HLA-DR phenotypic expressions are seen in whole-blood samples from an EBOV-exposed monkey. Note that CD56+HLA-DR+ cells started decreasing on day 2 and remained low throughout the study. *P < .05; **P < .01. Q1, HLA-DR+CD56-; Q2, HLA-DR+CD56+; Q3, HLA-DR-CD56+; Q4, HLA-DR-CD56-.

References

    1. Al-Samkari H, Berliner N. Hemophagocytic lymphohistiocytosis. Annu Rev Pathol 2018; 13:27–49. - PubMed
    1. Tan LH, Lum LC, Omar SF, Kan FK. Hemophagocytosis in dengue: comprehensive report of six cases. J Clin Virol 2012; 55:79–82. - PubMed
    1. McElroy AK, Shrivastava-Ranjan P, Harmon JR, et al. . Macrophage activation marker soluble CD163 associated with fatal and severe Ebola virus disease in humans. Emerg Infect Dis 2019; 25:290–8. - PMC - PubMed
    1. George MR. Hemophagocytic lymphohistiocytosis: review of etiologies and management. J Blood Med 2014; 5:69–86. - PMC - PubMed
    1. Baseler L, Chertow DS, Johnson KM, Feldmann H, Morens DM. The pathogenesis of Ebola virus disease. Annu Rev Pathol 2017; 12:387–418. - PubMed

Publication types