. 2023 Oct 3;146(10):4040-4054.
doi: 10.1093/brain/awad189.

Tau protein spreads through functionally connected neurons in Alzheimer's disease: a combined MEG/PET study

Affiliations

Tau protein spreads through functionally connected neurons in Alzheimer's disease: a combined MEG/PET study

Deborah N Schoonhoven et al. Brain. .

Abstract

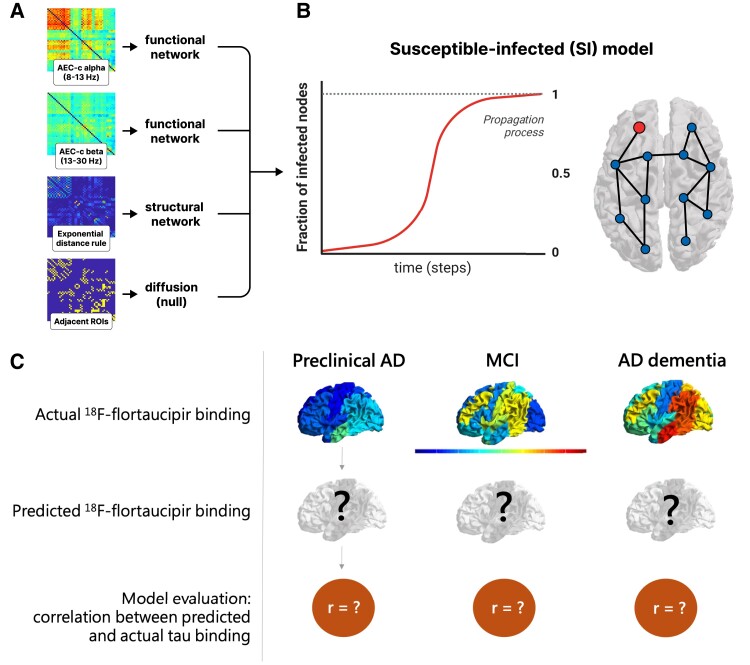
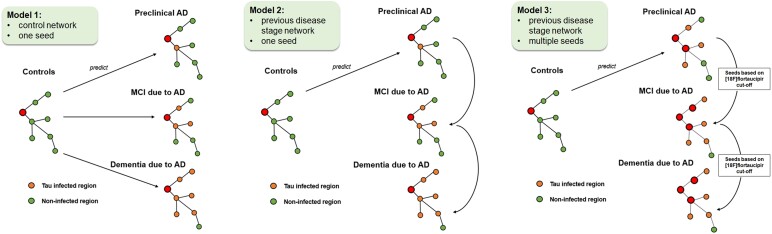
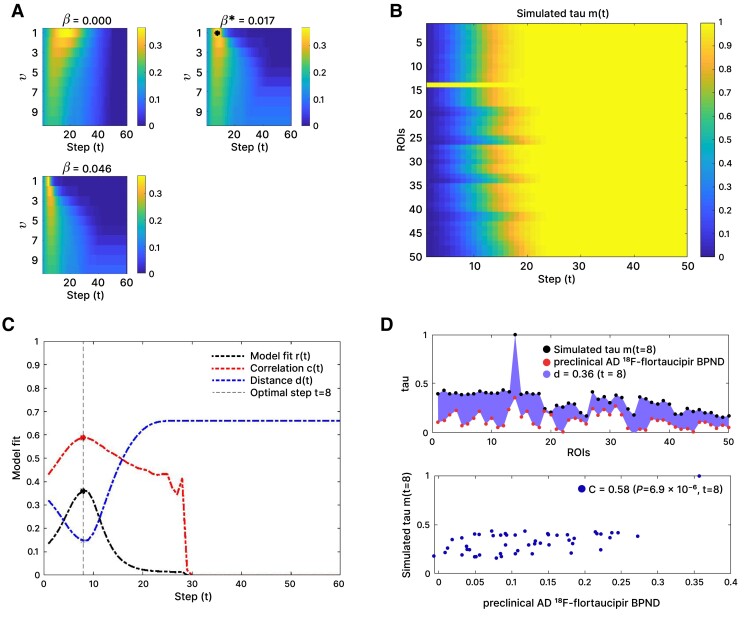
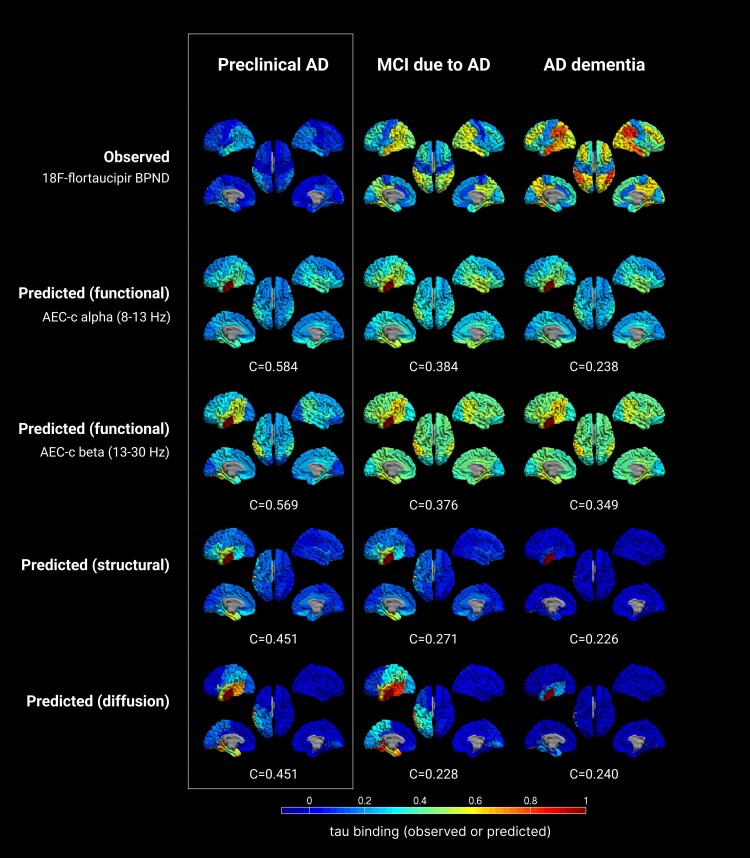
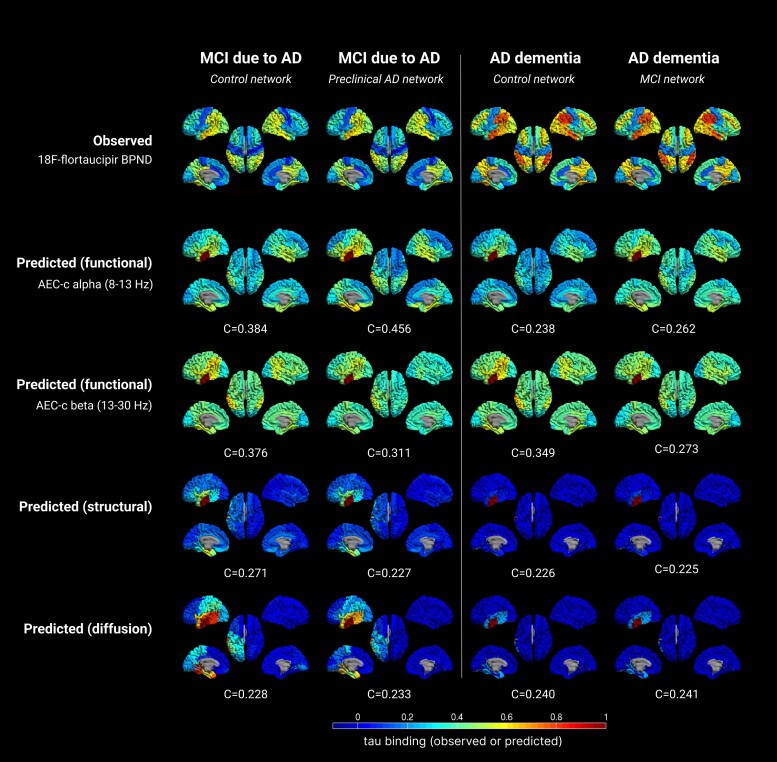
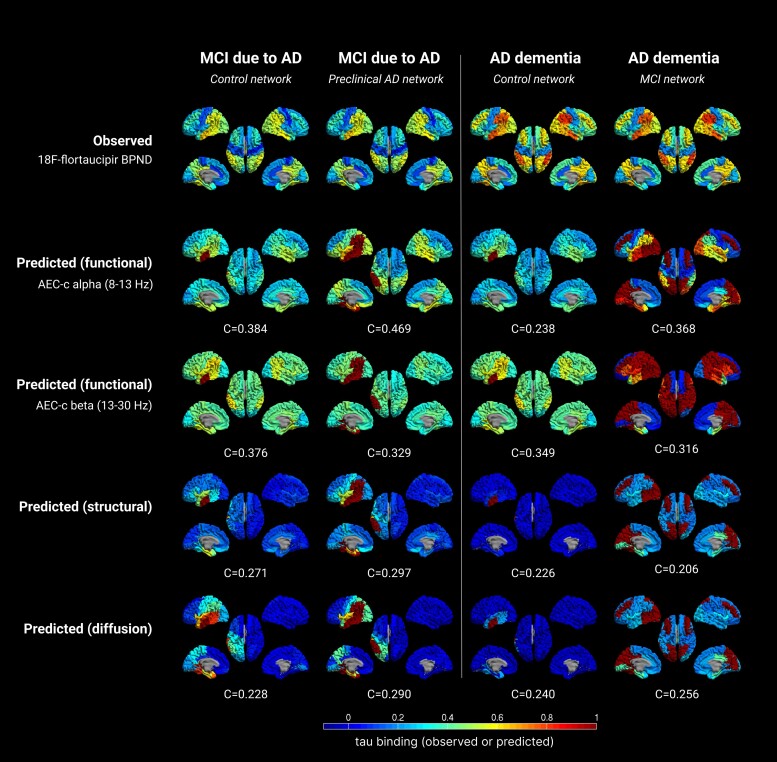
Recent studies on Alzheimer's disease (AD) suggest that tau proteins spread through the brain following neuronal connections. Several mechanisms could be involved in this process: spreading between brain regions that interact strongly (functional connectivity); through the pattern of anatomical connections (structural connectivity); or simple diffusion. Using magnetoencephalography (MEG), we investigated which spreading pathways influence tau protein spreading by modelling the tau propagation process using an epidemic spreading model. We compared the modelled tau depositions with 18F-flortaucipir PET binding potentials at several stages of the AD continuum. In this cross-sectional study, we analysed source-reconstructed MEG data and dynamic 100-min 18F-flortaucipir PET from 57 subjects positive for amyloid-β pathology [preclinical AD (n = 16), mild cognitive impairment (MCI) due to AD (n = 16) and AD dementia (n = 25)]. Cognitively healthy subjects without amyloid-β pathology were included as controls (n = 25). Tau propagation was modelled as an epidemic process (susceptible-infected model) on MEG-based functional networks [in alpha (8-13 Hz) and beta (13-30 Hz) bands], a structural or diffusion network, starting from the middle and inferior temporal lobe. The group-level network of the control group was used as input for the model to predict tau deposition in three stages of the AD continuum. To assess performance, model output was compared to the group-specific tau deposition patterns as measured with 18F-flortaucipir PET. We repeated the analysis by using networks of the preceding disease stage and/or using regions with most observed tau deposition during the preceding stage as seeds. In the preclinical AD stage, the functional networks predicted most of the modelled tau-PET binding potential, with best correlations between model and tau-PET [corrected amplitude envelope correlation (AEC-c) alpha C = 0.584; AEC-c beta C = 0.569], followed by the structural network (C = 0.451) and simple diffusion (C = 0.451). Prediction accuracy declined for the MCI and AD dementia stages, although the correlation between modelled tau and tau-PET binding remained highest for the functional networks (C = 0.384; C = 0.376). Replacing the control-network with the network from the preceding disease stage and/or alternative seeds improved prediction accuracy in MCI but not in the dementia stage. These results suggest that in addition to structural connections, functional connections play an important role in tau spread, and highlight that neuronal dynamics play a key role in promoting this pathological process. Aberrant neuronal communication patterns should be taken into account when identifying targets for future therapy. Our results also suggest that this process is more important in earlier disease stages (preclinical AD/MCI); possibly, in later stages, other processes may be influential.

Keywords: Alzheimer’s disease; functional connectivity; magnetoencephalography; spreading model; tau protein.


Conflict of interest statement

Research programs of W.v.d.F. have been funded by ZonMW, NWO, EU-FP7, EU-JPND, Alzheimer Nederland, Hersenstichting CardioVascular Onderzoek Nederland, Health∼Holland, Topsector Life Sciences & Health, stichting Dioraphte, Gieskes-Strijbis fonds, stichting Equilibrio, Edwin Bouw fonds, Pasman stichting, stichting Alzheimer & Neuropsychiatrie Foundation, Philips, Biogen MA Inc, Novartis-NL, Life-MI, AVID, Roche BV, Fujifilm, Combinostics. W.v.d.F. holds the Pasman chair. W.v.d.F. is recipient of ABOARD, which is a public-private partnership receiving funding from ZonMW (#73305095007) and Health∼Holland, Topsector Life Sciences & Health (PPP-allowance; #LSHM20106). All funding is paid to her institution. P.S. is a full time employee of EQT Life Sciences (formerly LSP). He has received consultancy fees (paid to the university) from Alzheon, Brainstorm Cell and Green Valley. Within his university affiliation he is global PI of the phase 1b study of AC Immune, Phase 2b study with FUJI-film/Toyama and phase 2 study of UCB. He is past chair of the EU steering committee of the phase 2b program of Vivoryon and the phase 2b study of Novartis Cardiology and presently co-chair of the phase 3 study with NOVO-Nordisk. All other authors report no competing interests.

Figures

Figure 1
Figure 1
Workflow visualizing the prediction model. (A) The group level connectivity between 50 regions of interest (ROIs) of the adjusted Hammers atlas serves as the basis for the functional (AEC-c in alpha and beta band), structural (EDR) and diffusion (adjacent ROIs) networks. (B) The networks are used as the backbone for the epidemic spreading model (SI model), where the fraction of newly infected nodes (red line), is represented as a function of time. (C) For each network and each disease stage, the spreading dynamics were simulated and the propagation pattern was constructed across all 50 ROIs, and compared with the actual 18F-flortaucipir pattern. AD = Alzheimer’s disease; AEC-c = corrected amplitude envelope correlation; MCI = mild cognitive impairment.
Figure 2
Figure 2
Visual representation of the prediction models of tau spread. Model 1: starting from the seed region (red), in the control group (amyloid-negative SCD) tau spread is modelled to the different stages of the Alzheimer’s disease (AD) continuum: preclinical AD (amyloid-positive SCD), MCI due to AD, and dementia due to AD. Orange nodes represent tau-infected areas, whereas green nodes represent non-infected areas. Model 2: to account for neurodegeneration in later disease stages, models were repeated with magnetoencephalography networks of the preceding disease stage. Model 3: alternative seed regions were added in the preclinical and mild cognitive impairment (MCI) stage, based on a 18F-flortaucipir cut-off, in order to model tau seeding from previously infected regions. Regions above this cut-off were considered tau-positive and were entered as seeds into the model. SCD = subjective cognitive decline.
Figure 3
Figure 3
Exemplary susceptible-infected propagation process for the functional network (AEC-c, alpha band) predicting tau spread in the preclinical Alzheimer’s disease stage using the control network. (A) Correlation between actual and predicted tau deposition for different spreading rates (β) and different weightings (v) of the functional connections. The optimum fit is indicated with an asterisk. (B) Model propagation pattern showing the probability pi(t), that a given region of interest (ROI) i (y-axis) is infected at simulation step t (x-axis). The seed (‘left middle and inferior temporal gyri’, ROI 14) is by definition infected at simulation Step 0. (C) Goodness of model fit, considering the total tau load [distance d(t)], the spatial pattern of the tau load [correlation C(t)], and final model fit [r(t)] for each simulation step (t). The dashed vertical line indicates the simulation step with the optimum model fit, in this case t = 8. (D) Simulated tau spread and observed tau spread by ROI (top), and the predicted tau spread versus observed tau spread for the optimal time point (t = 8), with the corresponding correlation and P-value (bottom).
Figure 4
Figure 4
Observed versus predicted patterns of tau spreading in several stages of the Alzheimer’s disease continuum. The top row displays the observed clinical 18F-flortaucipir-PET BPND for each group. The other rows display the predicted spreading patterns for the different (functional, structural, diffusion) networks, based on the group level control network and a single seed region, with the corresponding optimum correlation coefficient evaluating model performance. Warmer colours represent a higher proportion of regional tau-binding, or higher probability of infection. Note that in the predicted data, the seed region (ROI 14) is always infected with maximum tau binding (by definition). AD = Alzheimer’s disease; AEC-c = corrected amplitude envelope correlation; MCI = mild cognitive impairment.
Figure 5
Figure 5
Observed versus predicted patterns of tau spreading in several stages of the Alzheimer’s disease continuum, for the second model. The first and third columns show the original results from the first model, using the control network as backbone, with the second and fourth columns showing the new results, based on the networks of the preceding disease stage, with the corresponding fit evaluating model performance. The rows display the observed clinical 18F-flortaucipir-PET BPND, and the predicted spreading patterns for the different (functional, structural, diffusion) networks. Warmer colours represent higher proportion of regional tau-binding. Note that in the predicted data, the seed region (ROI 14) is always infected with maximum tau binding. AD = Alzheimer’s disease; AEC-c = corrected amplitude envelope correlation; MCI = mild cognitive impairment.
Figure 6
Figure 6
Observed versus predicted patterns of tau spreading in several stages of the Alzheimer’s disease continuum, for the third model. The first and third columns show the original results from the first model, using the control network as backbone, with the second and fourth columns showing the new results, based on the networks of the preceding disease stage and alternative seed regions (based on tau cut-offs), with the corresponding correlation evaluating model performance. The rows again display the observed clinical 18F-flortaucipir-PET BPND, and the predicted spreading patterns for the different (functional, structural, diffusion) networks. Warmer colours represent higher proportion of regional tau-binding. Note that in the predicted data, the seed regions are always infected with maximum tau binding. AD = Alzheimer’s disease; AEC-c = corrected amplitude envelope correlation; MCI = mild cognitive impairment.

References

    1. Wu JW, Hussaini SA, Bastille IM, et al. Neuronal activity enhances tau propagation and tau pathology in vivo. Nat Neurosci. 2016;19:1085–1092. - PMC - PubMed
    1. Pooler AM, Phillips EC, Lau DH, Noble W, Hanger DP. Physiological release of endogenous tau is stimulated by neuronal activity. EMBO Rep. 2013;14:389–394. - PMC - PubMed
    1. Yamada K, Holth JK, Liao F, et al. Neuronal activity regulates extracellular tau in vivo. J Exp Med. 2014;211:387–393. - PMC - PubMed
    1. Zhou J, Gennatas ED, Kramer JH, Miller BL, Seeley WW. Predicting regional neurodegeneration from the healthy brain functional connectome. Neuron. 2012;73:1216–1227. - PMC - PubMed
    1. Xia CF, Arteaga J, Chen G, et al. [(18)F]T807, a novel tau positron emission tomography imaging agent for Alzheimer's disease. Alzheimers Dement. 2013;9:666–676. - PubMed

Publication types