. 2023 Aug 9;224(4):iyad107.
doi: 10.1093/genetics/iyad107.

Demographic history inference and the polyploid continuum

Affiliations

Demographic history inference and the polyploid continuum

Paul D Blischak et al. Genetics. .

Abstract

Polyploidy is an important generator of evolutionary novelty across diverse groups in the Tree of Life, including many crops. However, the impact of whole-genome duplication depends on the mode of formation: doubling within a single lineage (autopolyploidy) versus doubling after hybridization between two different lineages (allopolyploidy). Researchers have historically treated these two scenarios as completely separate cases based on patterns of chromosome pairing, but these cases represent ideals on a continuum of chromosomal interactions among duplicated genomes. Understanding the history of polyploid species thus demands quantitative inferences of demographic history and rates of exchange between subgenomes. To meet this need, we developed diffusion models for genetic variation in polyploids with subgenomes that cannot be bioinformatically separated and with potentially variable inheritance patterns, implementing them in the dadi software. We validated our models using forward SLiM simulations and found that our inference approach is able to accurately infer evolutionary parameters (timing, bottleneck size) involved with the formation of auto- and allotetraploids, as well as exchange rates in segmental allotetraploids. We then applied our models to empirical data for allotetraploid shepherd's purse (Capsella bursa-pastoris), finding evidence for allelic exchange between the subgenomes. Taken together, our model provides a foundation for demographic modeling in polyploids using diffusion equations, which will help increase our understanding of the impact of demography and selection in polyploid lineages.

Keywords: allopolyploidy; autopolyploidy; demography; homoeologous exchange; site frequency spectrum.


Conflict of interest statement

Conflicts of interest The author(s) declare no conflict of interest.

Figures

Fig. 1.
Fig. 1.
Conceptual representation of the polyploid continuum and corresponding demographic models for polyploid formation. Here, eij represents the probability of tetrasomic inheritance.
Fig. 2.
Fig. 2.
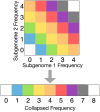
Illustration of SFS collapse across subgenomes. In this case, allele counts and frequencies across two subgenomes are combined, so that the colored entries in the 2D SFS (top) are summed to yield each corresponding entry in the collapsed 1D SFS (bottom).
Fig. 3.
Fig. 3.
Comparison of collapsed frequency spectra between SLiM and dadi for two different bottleneck sizes (ν=0.5 [top row] and ν=0.1 [bottom row]) for autotetraploids (a, b), segmental allotetraploids (c, d), and allotetraploids (e, f). The rate of homoeologous exchange for segmental allotetraploids was set to eij=5×10⁶.
Fig. 4.
Fig. 4.
Illustration of the effect of the homoeologous exchange rate on the collapsed polyploid site frequency spectrum for a tetraploid. Here, exchange rates vary from eij=0 (allotetraploid) to eij=0.01. At the high end of this range, the SFS no longer has a distinctive peak at 50% frequency due to the exchanges mixing alleles, making the SFS appear more similar to that of an autopolyploid.
Fig. 5.
Fig. 5.
a) Parameters estimates from dadi for bottleneck size (left panel) and formation time (right panel) for the allotetraploid bottleneck model simulated with SLiM across two different data types: GBS and WGS. For estimates of the bottleneck size, the secondary divisions in the plots show the true formation time (T2=0.25,0.5) in the rows and the true bottleneck size (νBot=0.25,0.5) in the columns. b) Parameters estimates from dadi for formation time (top-left panel), bottleneck size (top-right panel), and homoeologous exchange rate (bottom panel) for the segmental allotetraploid bottleneck model simulated with SLiM across GBS and WGS data types. For all plots, the blue line represents the true value used to simulate the data.
Fig. 6.
Fig. 6.
Graphical representations of the models used for validating the diffusion approximation for autopolyploids (left), segmental allopolyploids (middle), and allopolyploids (right). The main parameters used across the models are: N0 (parental/ancestral population size), nuBot (νbot: proportion of population remaining after bottleneck), T (bottleneck duration in autopolyploid model), T1 (duration of parental divergence before polyploid formation), T2 (time before sampling for allo- and segmental allopolyploids), and eij (eij: per-generation probability of homoeologous exchange).
Fig. 7.
Fig. 7.
[Top] Site frequency spectra resulting from the maximum likelihood parameters estimated for the allotetraploid bottleneck and segmental allotetraploid bottleneck models for C. bursa-pastoris, as well as for the exponential growth model from Douglas et al. (2015). The observed data are also shown in blue. [Bottom] Anscombe residual plot (model - data) comparing each entry in the SFS between the allotetraploid bottleneck, segmental allotetraploid bottleneck, and (Douglas et al. 2015) models with the observed data.

References

    1. Arnold BJ, Lahner B, DaCosta JM, Weisman CM, Hollister JD, Salt DE, Bomblies K, Yant L. Borrowed alleles and convergence in serpentine adaptation. Proc Natl Acad Sci USA. 2016;113:8320–8325. doi:10.1073/pnas.1600405113 - DOI - PMC - PubMed
    1. Baduel P, Bray S, Vallejo-Marin M, Kolář F, Yant L. The “polyploid hop”: shifting challenges and opportunities over the evolutionary lifespan of genome duplications. Front Ecol Evol. 2018;6:117. doi:10.3389/fevo.2018.00117 - DOI
    1. Baniaga AE, Marx HE, Arrigo N, Barker MS. Polyploid plants have faster rates of multivariate niche differentiation than their diploid relatives. Ecol Lett. 2020;23:68–78. doi:10.1111/ele.13402 - DOI - PubMed
    1. Blischak PD, Barker MS, Gutenkunst RN. Inferring the demographic history of inbred species from genome-wide SNP frequency data. Mol Biol Evol. 2020;37:2124–2136. doi:10.1093/molbev/msaa042 - DOI - PMC - PubMed
    1. Blischak PD, Kubatko LS, Wolfe AD. SNP genotyping and parameter estimation in polyploids using low-coverage sequencing data. Bioinformatics. 2018a;34:407–415. doi:10.1093/bioinformatics/btx587 - DOI - PubMed

Publication types