. 2023 Jul 5;33(14):9175-9185.
doi: 10.1093/cercor/bhad193.

Developmental differences in functional organization of multispectral networks

Affiliations

Developmental differences in functional organization of multispectral networks

Nathan M Petro et al. Cereb Cortex. .

Abstract

Assessing brain connectivity during rest has become a widely used approach to identify changes in functional brain organization during development. Generally, previous works have demonstrated that brain activity shifts from more local to more distributed processing from childhood into adolescence. However, the majority of those works have been based on functional magnetic resonance imaging measures, whereas multispectral functional connectivity, as measured using magnetoencephalography (MEG), has been far less characterized. In our study, we examined spontaneous cortical activity during eyes-closed rest using MEG in 101 typically developing youth (9-15 years old; 51 females, 50 males). Multispectral MEG images were computed, and connectivity was estimated in the canonical delta, theta, alpha, beta, and gamma bands using the imaginary part of the phase coherence, which was computed between 200 brain regions defined by the Schaefer cortical atlas. Delta and alpha connectivity matrices formed more communities as a function of increasing age. Connectivity weights predominantly decreased with age in both frequency bands; delta-band differences largely implicated limbic cortical regions and alpha band differences in attention and cognitive networks. These results are consistent with previous work, indicating the functional organization of the brain becomes more segregated across development, and highlight spectral specificity across different canonical networks.

Keywords: adolescence; connectivity; magnetoencephalography; oscillation; resting state; spontaneous.


Conflict of interest statement

All authors report no biomedical financial interests or potential conflicts of interest.

Figures
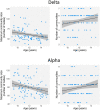
Fig. 1
Fig. 1
Developmental differences in network community. Age (x-axes) is plotted against the size of the largest community (left column) and the total number of communities (right column), separately for connectivity in the delta (top) and alpha (bottom) frequency bands. The least squares line is plotted in black, and the shaded region illustrates the 95% confidence interval. For both delta and alpha, the network structure was divided into more numerous and smaller communities in older adolescents.
Fig. 2
Fig. 2
Illustration of region and network level relationship between delta connectivity and age. (A) Illustration of brain regions exhibiting negative relationships with age. Edge weights related to decreasing age, after permuted significance thresholding, where stronger negative relationships are illustrated with thicker lines and more magenta (compared to yellow) color. Nodes are illustrated as spheres, where larger sizes indicate a greater number of significant edges; nodes are colored by network according to the color labels indicated in panel B. (B) Illustration of the number of edges negatively related to age. The chord diagram shows the network-wise distribution of significant age-related edges among the networks defined in the Schaefer atlas: Cognitive control (Cont), dorsal attention (DorsAttn), default mode (Default), limbic (Limbic), somato-motor (SomatoMotor), salience/ventral attention (VenAttn), visual (Vis). The networks are ordered clockwise by the total number of significant edges. Size of each chord reflects the number of connections between (or within) networks. Note that all connections are bidirectional; chord colors are differentiated for illustrative purposes and are colored according to the network with the overall greatest number of significant edges. Colored caps are included at the ends of each chord to indicate the opposite network shared by each chord. (C) Illustration of the strength of the negative age relationship in each network. Heatmap colors indicate the average standard beta weights of all network-wise edges. Adjacent bar graphs reflect the average standardized Beta weights of edges implicated in each network (i.e. the average of standardized beta weights in each row).
Fig. 3
Fig. 3
Illustration of region and network level relationship between alpha connectivity and age. (A) Illustration of brain regions exhibiting negative relationships with age. Edge weights related to decreasing age, after permuted significance thresholding, are shown with stronger negative relationships indicated by thicker lines and more magenta (compared to yellow) color. Nodes are illustrated as spheres, where larger sizes indicate a greater number of significant edges; nodes are colored by network according to the color labels indicated in panel B. (B) Illustration of the number of edges negatively related to age. Chord diagram showing the network-wise distribution of significant age-related edges among the networks defined in the Schaefer atlas: cognitive control (Cont), dorsal attention (DorsAttn), default mode (Default), limbic (Limbic), somato-motor (SomatoMotor), salience/ventral attention (VenAttn), visual (Vis). The networks are ordered clockwise by the total number of significant edges. Size of each chord reflects the number of connections between (or within) networks. Note that all connections are bidirectional; chord colors are differentiated for illustrative purposes and are colored according to the network with the overall greatest number of significant edges. Colored caps are included at the ends of each chord to indicate the opposite network shared by each chord. (C) Illustration of the strength of the negative age relationship in each network. Heatmap colors indicate the average standard beta weights of all network-wise edges. Adjacent bar graphs reflect the average standardized Beta weights of edges implicated in each network (i.e. the average of standardized Beta weights in each row).

References

    1. Agcaoglu O, Wilson TW, Wang Y-P, Stephen JM, Calhoun VD. Dynamic resting-state connectivity differences in eyes open versus eyes closed conditions. Brain Connect. 2020:10(9):504–519. - PMC - PubMed
    1. Andrews JL, Ahmed SP, Blakemore S-J. Navigating the social environment in adolescence: the role of social brain development. Biol Psychiatry Adolescent Brain Dev Psychopathol. 2021:89:109–118. - PubMed
    1. Ashburner J, Friston KJ. Unified segmentation. NeuroImage. 2005:26:839–851. - PubMed
    1. van Baal GCM, Boomsma DI, de Geus EJC. Longitudinal genetic analysis of EEG coherence in young twins. Behav Genet. 2001:31:637–651. - PubMed
    1. Barratt W. The Barratt simplified measure of social status (BSMSS): measuring SES; 2006

Publication types