. 2023 Jun 7;8(1):225.
doi: 10.1038/s41392-023-01433-4.

Adult-born neurons in critical period maintain hippocampal seizures via local aberrant excitatory circuits

Affiliations

Adult-born neurons in critical period maintain hippocampal seizures via local aberrant excitatory circuits

Liying Chen et al. Signal Transduct Target Ther. .

Abstract

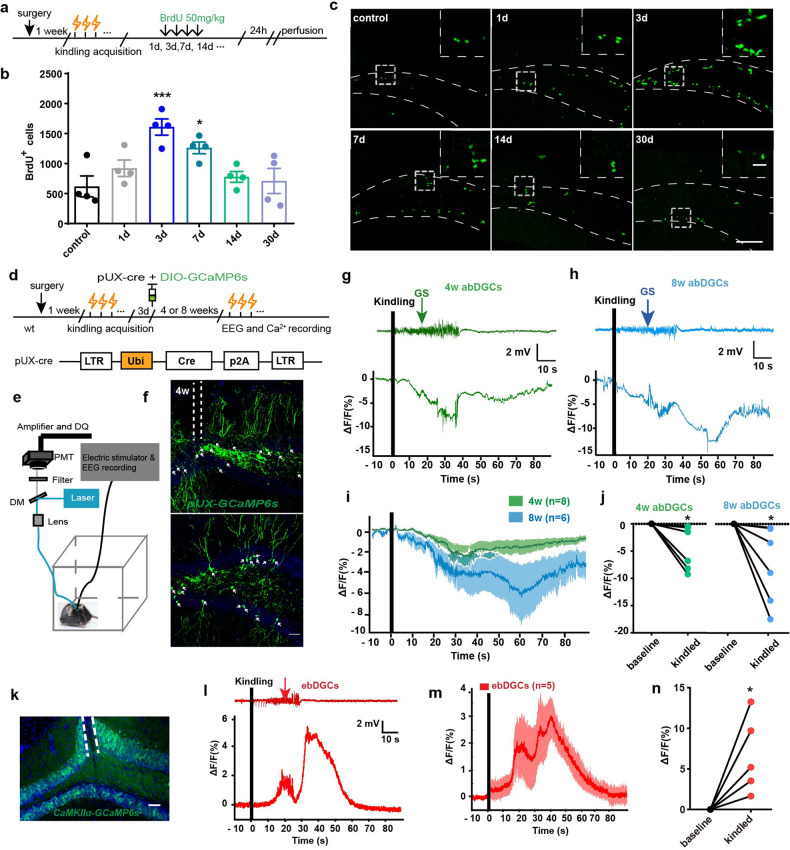
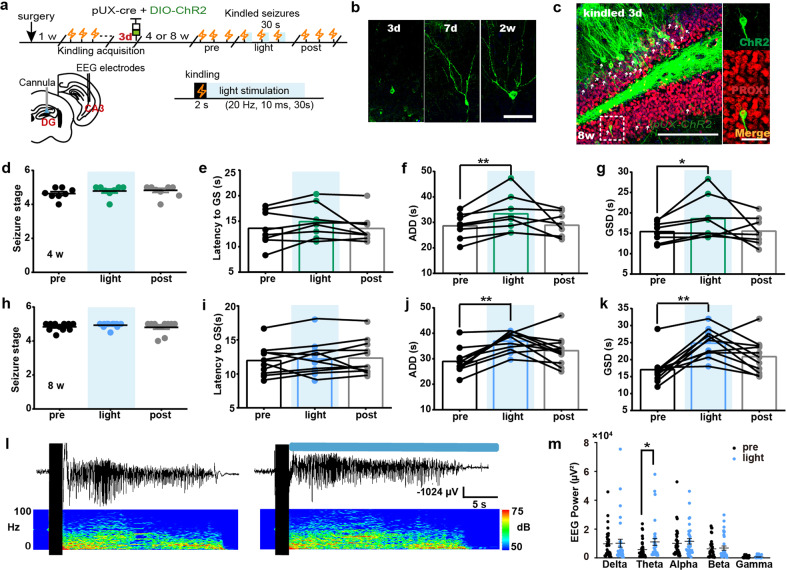
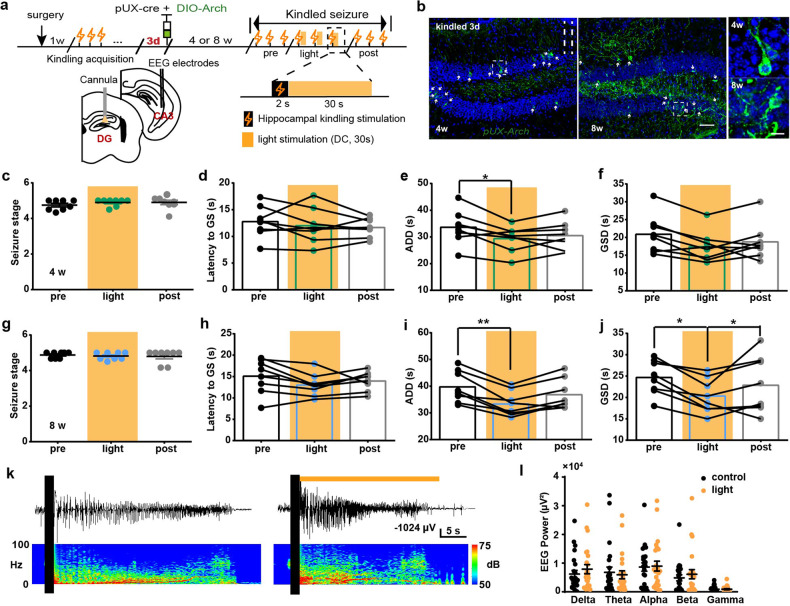
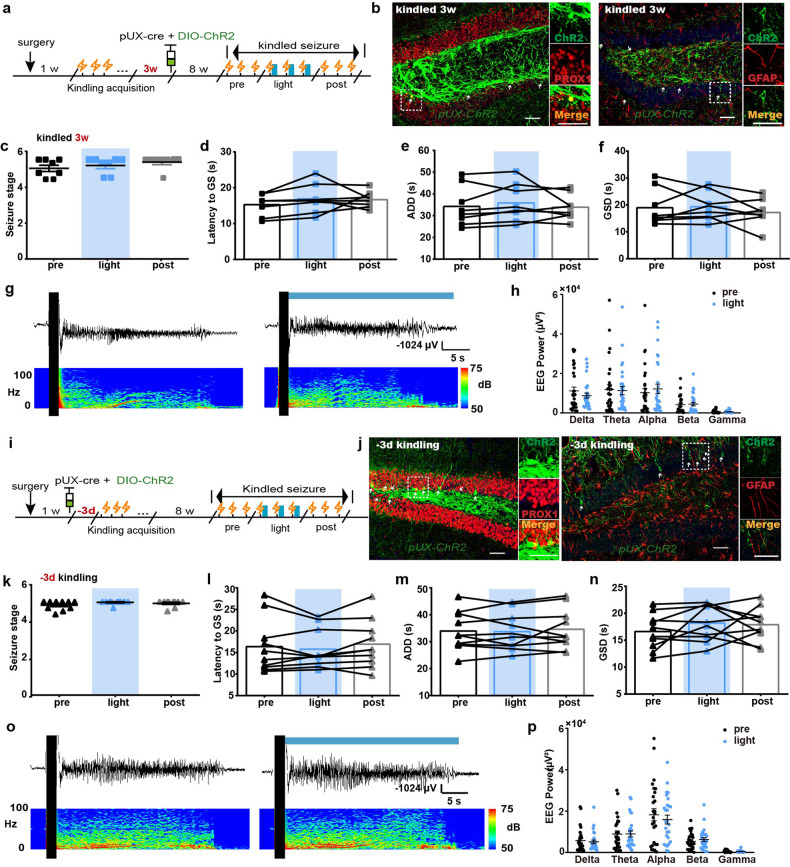
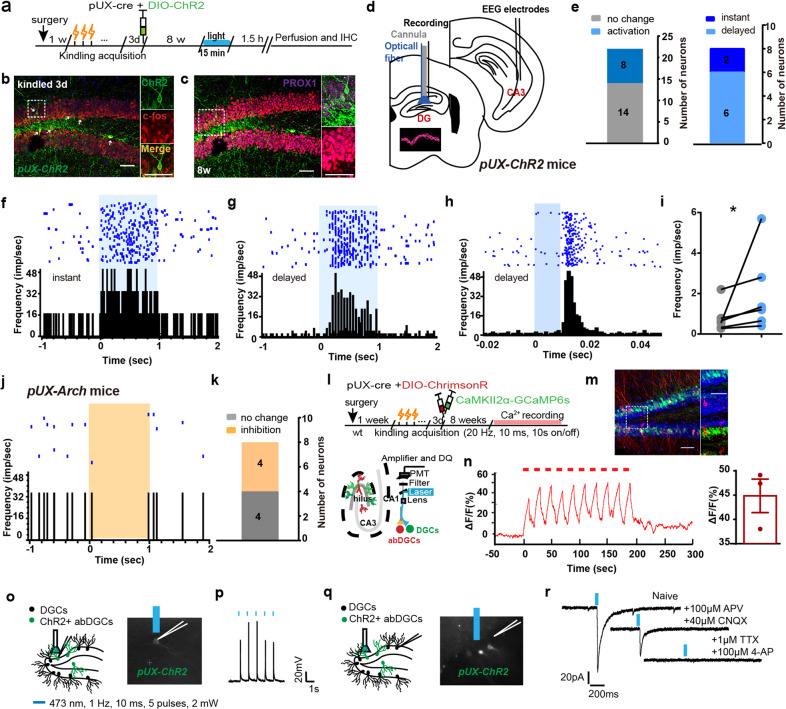
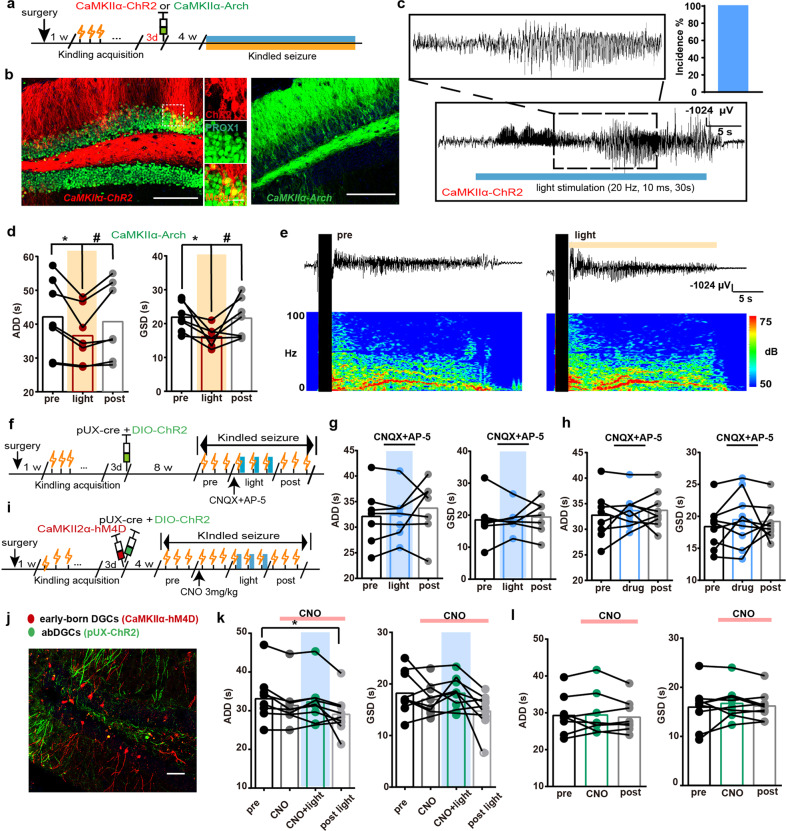
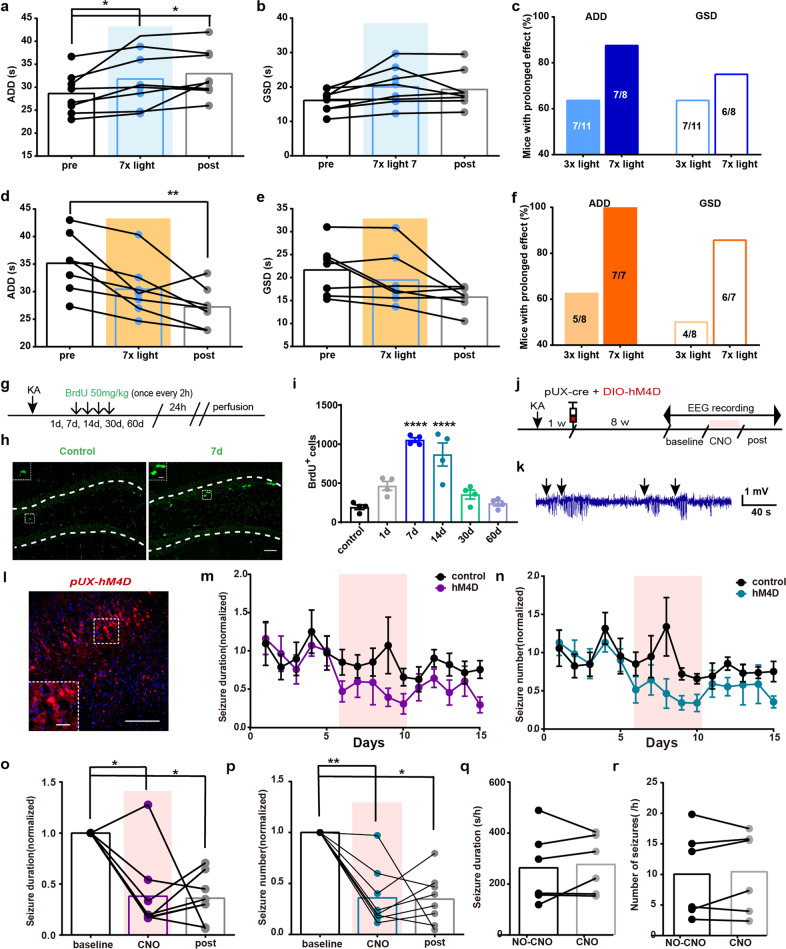
Temporal lobe epilepsy (TLE), one common type of medically refractory epilepsy, is accompanied with altered adult-born dentate granule cells (abDGCs). However, the causal role of abDGCs in recurrent seizures of TLE is not fully understood. Here, taking advantage of optogenetic and chemogenetic tools to selectively manipulate abDGCs in a reversible manner, combined with Ca2+ fiber photometry, trans-synaptic viral tracing, in vivo/vitro electrophysiology approaches, we aimed to test the role of abDGCs born at different period of epileptogenic insult in later recurrent seizures in mouse TLE models. We found that abDGCs were functionally inhibited during recurrent seizures. Optogenetic activation of abDGCs significantly extended, while inhibition curtailed, the seizure duration. This seizure-modulating effect was attributed to specific abDGCs born at a critical early phase after kindled status, which experienced specific type of circuit re-organization. Further, abDGCs extended seizure duration via local excitatory circuit with early-born granule cells (ebDGCs). Repeated modulation of "abDGC-ebDGC" circuit may easily induce a change of synaptic plasticity, and achieve long-term anti-seizure effects in both kindling and kainic acid-induced TLE models. Together, we demonstrate that abDGCs born at a critical period of epileptogenic insult maintain seizure duration via local aberrant excitatory circuits, and inactivation of these aberrant circuits can long-termly alleviate severity of seizures. This provides a deeper and more comprehensive understanding of the potential pathological changes of abDGCs circuit and may be helpful for the precise treatment in TLE.


Conflict of interest statement

The authors declare no competing interests.

Figures

Fig. 1
Fig. 1
The abDGCs generated acutely after kindled status are functionally inhibited during later recurrent hippocampal seizures. a Experiment scheme of using BrdU to label cell proliferation in adult SGZ at different timepoints after mice being fully kindled. b Proliferative activity in the SGZ was significantly increased at 3 days, remained elevated at 7 days, and returned to baseline levels by 14 days after mice being fully kindled (n = 4 for each group *p < 0.05, ***p < 0.001, compared with control; One-way ANOVA followed by post hoc Dunnett test). c Representative images of BrdU labeling at different timepoints after mice being fully kindled (bar = 50 μm) and the enlarged images (bar = 10 μm). d Schematic diagram of the Ca2+ fiber photometry experiment. Fluorometric monitoring was carried out separately 4 or 8 weeks after the virus being injected to label 3-day abDGCs. e Configuration for fluorometric monitoring of Ca2+ signaling of abDGCs and simultaneous EEG recording during hippocampal seizures. f Histochemical verification of GCaMP6s expression in coronal sections in the DG (bar = 50 μm). White arrow points to the labeled abDGCs. g, h Representative GCaMP signals aligning with EEG recordings during hippocampal seizures when labeled abDGCs were 4-weeks-old (green) and 8-weeks-old (blue), respectively. The parameter of kindling stimulation is: monophasic square-wave pulses, 20 Hz, 1 ms/pulse, 40 pulses, 200μA. i Mean fluorescence values of abDGCs during hippocampal seizures (n = 8 for 4 w; n = 6 for 8 weeks). j The statistical value of ΔF/F0 was shown separately for each mouse in the 4-weeks-old group and 8-weeks-old group (*p < 0.05, Paired Wilcoxon-tests). k Histochemical verification of GCaMP6s expression in ebDGCs in coronal sections (bar = 50 μm). l Representative GCaMP signal of ebDGCs aligning with EEG recording during hippocampal seizure. m Mean fluorescence values of ebDGCs during hippocampal seizures (n = 5). n The statistical value of ΔF/F0 was shown for each mouse in the CaMKII-GcaMP6s group (*p < 0.05, Paired Wilcoxon-tests)
Fig. 2
Fig. 2
Optogenetic activation of abDGCs extends seizure duration. a Experiment scheme for optogenetic activation protocol in recurrent hippocampal seizures. The parameter of blue light stimulation is: 473 nm, 20 Hz, 10 ms/pulse and 600 pulses, 5 mW. b Representative images of EYFP-immunoreactive cells at different time points (3 days, 7 days, 2 weeks) after injection of virus cocktail (pUX-cre and AAV-EF1a-DIO-hChR2-EYFP) (bar = 50 μm). c Histochemical verification of ChR2-expressing abDGCs in the DG and double immunostaining of PROX1 (red) and ChR2-EYFP (green) in brain slices with 8-weeks-old abDGCs (bar = 50 μm) and the enlarged images (bar = 10 μm). White arrow points to the labeled abDGCs. dg Effects of optogenetic activation of the 4-weeks-old abDGCs on seizure stage (d), latency to GS (e), ADD (f) and GSD (g) during hippocampal seizures (n = 8, *p < 0.05, **p < 0.01, Friedman-tests with post-hoc Dunn’s test for multiple comparisons). hk Effects of optogenetic activation of the 8-weeks-old abDGCs on seizure stage (h), latency to GS (i), ADD (j) and GSD (k) during hippocampal seizures (n = 11, **p < 0.01, Friedman-tests with post-hoc Dunn’s test for multiple comparisons). l Typical EEGs and power spectrograms recorded from the hippocampus during seizures when optogenetically activating 8-weeks-old abDGCs; the solid black vertical bar indicates kindling stimulation artifact and the horizontal blue bar indicates the time for delivery of blue light. m Power spectral analysis of the EEGs of hippocampal seizures (*p < 0.05, Paired t-tests)
Fig. 3
Fig. 3
Optogenetic inhibition of abDGCs shortens seizure duration. a Experiment scheme for optogenetic inhibition protocol in recurrent hippocampal seizures. Continuous 30-s yellow light (589 nm, direct current, 5 mw) stimulation was applied. b Histochemical verification of Arch-expressing 4- and 8-weeks-old abDGCs in the DG (bar = 50 μm) and the enlarged images (bar = 10 μm). cf Effects of optogenetic inhibition of the 4-weeks-old abDGCs on seizure stage (c), latency to GS (d), ADD (e) and GSD (f) during hippocampal seizure (n = 8, *p < 0.05, Friedman-tests with post-hoc Dunn’s test for multiple comparisons). gj Effects of optogenetic inhibition of the 8-weeks-old abDGCs on seizure stage (g), latency to GS (h), ADD (i) and GSD (j) during hippocampal seizures (n = 8, *p < 0.05, **p < 0.01, Friedman-tests with post-hoc Dunn’s test for multiple comparisons). k Typical EEGs and power spectrograms recorded from the hippocampus during seizures when optogenetically inhibiting 8-weeks-old abDGCs; the solid black vertical bar indicates kindling stimulation artifact and the horizontal yellow bar indicates the time for delivery of yellow light. l Power spectral analysis of the EEGs of hippocampal seizures
Fig. 4
Fig. 4
The abDGCs born at other stages of kindled status do not affect later recurrent hippocampal seizures. a Experiment scheme for optogenetic activation of abDGCs born at 3w after mice being fully kindled. b Histochemical verification of ChR2-expressing 8-weeks-old abDGCs in the DG. Left, double immunostaining of ChR2-EYFP (green) and PROX1 (red) and the enlarged images (bar = 50 μm). Right, double immunostaining of ChR2-EYFP (green) and GFAP (red) and the enlarged images (bar = 50 μm). c–f Effects of optogenetic activation of 8-weeks-old abDGCs, born 3 weeks after mice being fully kindled, on seizure stage (c), latency to GS (d), ADD (e) and GSD (f) during hippocampal seizures (n = 8). g Typical EEGs and power spectrograms recorded at the hippocampus during seizures when optogenetically activating 8-weeks-old abDGCs born at 3w after kindled status; the solid black vertical bar indicates kindling stimulation artifact and the solid horizontal blue bar indicates the time for blue light. h Power spectral analysis of the EEGs of hippocampal seizures. i Experiment scheme for optogenetic activation of abDGCs generated at −3d before kindling acquisition. j Histochemical verification of ChR2-expressing 8-weeks-old abDGCs in the DG. Left, double immunostaining of ChR2-EYFP (green) and PROX1 (red) and the enlarged images (bar = 50 μm). Right, double immunostaining of ChR2-EYFP (green) and GFAP (red) and the enlarged images (bar = 50 μm). k–n Effects of optogenetic activation of 8-weeks-old abDGCs, born 3 days before kindling acquisition, on seizure stage (k), latency to GS (l), ADD (m) and GSD (n) during hippocampal seizures (n = 10). o Typical EEGs and power spectrograms recorded at the hippocampus during seizures when optogenetically activating 8-weeks-old abDGCs born at −3d before kindling; the solid black vertical bar indicates kindling stimulation artifact and the solid horizontal blue bar indicates the time for blue light. p Power spectral analysis of the EEGs of hippocampal seizures
Fig. 5
Fig. 5
The abDGCs activate local ebDGCs in epileptic mice. a Experimental scheme for optogenetic activation of 8-weeks-old abDGCs born at 3 days after kindled status leads to c-fos expression in both ChR2-expressing abDGCs and other PROX1+ neurons in the GCL. b Immunostaining of c-fos (red) and ChR2-EYFP (green) and the enlarged images (bar = 50 μm); c Immunostaining of PROX1 (purple), ChR2-EYFP (green) and c-fos (red) and the enlarged images (bar = 50 μm). d Scheme of experiment for in vivo single unit recording when optogenetically activating 8-weeks-old abDGCs born at 3d after kindled status. Insert, the typical DGC spike waveform. e Statistics of firing response of recorded DGCs with photo-stimulation of ChR2-expressing abDGCs in kindled status. f, g Representative peri-event raster histogram of DGCs firing in response to photo-stimulation of ChR2-expressing abDGCs (10 ms bins) with either instant (f) or delayed (g) latency. h Peristimulus time histogram of the representative DGC (aligned by the pulse light onset, blue rectangle) reveals its response frequency to the photo-stimulation (peak response latency ~15 ms). i The statistical value of firing rate was shown separately for each neuron (n = 6) (*p < 0.05, Paired Wilcoxon-tests). j Representative peri-event raster histogram of DGC firing in response to photo-stimulation of Arch-expressing abDGCs (10 ms bins). k Statistics of firing response of recorded DGCs with photo-inhibition of ArR2-expressing abDGCs in kindled status. l Experiment scheme for the Ca2+ fiber photometry experiment during optogenetic activation of abDGCs. m Immunostaining of ChrimsonR (red) and GCaMP6s (green) expression in the DG and the enlarged images (bar = 50 μm). n Left panel: Representative trace showed that optogenetic activation of abDGCs (10 s on-off, 635 nm) increased Ca2+ level in the mature ebDGCs reliably. Right panel: The statistical value of ΔF/F0 was shown separately for each mouse, which was calculated by averaging the peak ΔF/F0 values (n = 3). o Scheme of experiment for in vitro electrophysiology in the acute brain slices containing DG of kindled mice, photo-stimulation of ChR2-epressing abDGCs and whole-cell recording of them. p Typical whole-cell current recordings from ChR2-positive abDGCs. Membrane potential responses to a train of 10 ms pulses of blue light at 1 Hz. q Scheme of experiment for in vitro electrophysiology in the acute brain slices containing DG of kindling mice, photo-stimulation of ChR2-epressing abDGCs and whole-cell recording of neighboring ebDGCs. r Light-evoked excitatory postsynaptic currents (EPSCs) were recorded in ebDGCs during photo-stimulation (473 nm, 1 Hz, 10 ms, 5 pulses, 2 mW) of ChR2-expressing abDGCs in DG in normal ACSF (naive) in the presence of tetrodotoxin (TTX, 1 μM) and 4-amynopyridine (4-AP, 100 μM), and in the presence of the glutamate receptor antagonist D-2-Amino-5-phosphonovaleric acid (APV, 100 μM) and 6-cyano-7-nitroquinoxaline-2,3-dione. (CNQX, 40 μM)
Fig. 6
Fig. 6
The abDGCs extend seizure duration via local recurrent excitatory circuit with ebDGCs. a Experiment scheme for optogenetic activation/inhibition of ebDGCs. b Histochemical verification of ChR2- and Arch-expressing ebDGCs in the GCL. Left, immunostaining of ChR2-mCherry (red) and PROX1 (green) (bar = 50 μm) and the enlarged images of co-localization of both stains (bar = 10 μm); Right, histochemical verification of ArchT-expressing ebDGCs in the DG (bar = 50 μm). c Light delivery to activate ebDGCs was sufficient to induce seizures in kindled CaMKIIα-ChR2 mice. Left panel: Typical EEGs of ebDGC activation-evoked seizure. Right panel: The incidence of ebDGC activation-induced seizures was 100% (n = 4). d Inhibition of ebDGCs shortened the ADD and GSD during hippocampal seizures in CaMKIIα-Arch mice (n = 7, *p < 0.05, **p < 0.01, Friedman-tests with post-hoc Dunn’s test for multiple comparisons). e Typical EEGs and power spectrograms recorded from hippocampus when optogenetically inhibiting ebDGCs; the solid black vertical bar indicates kindling stimulation artifact and the horizontal yellow bar indicates the time for yellow light. f Experiment scheme for optogenetic activation protocol in the presence of glutamate antagonists (intra-DG injection, CNQX 10 μM plus AP-5 25 μM, 1:1, 0.5 μL). The drugs were injected 5 min before the insertion of optic fiber to deliver blue light. g Optogenetic activation of abDGCs in pUX-ChR2 did not have any pro-seizure effects in the presence of intra-DG injection of glutamate antagonists (n = 7). h Intra-DG injection of glutamate blocker cocktails alone did not influence the ADD and GSD. i Experiment scheme for chemogenetic silencing of ebDGC and simultaneous optogenetic activation of abDGCs. CNO was injected (3.0 mg/kg, i.p.) 30 min before the 4th stimulation. j Representative histochemical image of ChR2-EYFP-expressing abDGCs (green) and hM4D-mCherry-expressing ebDGCs (red)(bar = 50 µm). k Effects of optogenetic activation of abDGCs on kindled seizures, while simultaneously chemogenetic inhibiting ebDGCs (n = 9, *p < 0.05, Friedman-tests with post-hoc Dunn’s test for multiple comparisons). Mice using in this experiment were tested beforehand to ensure that optogenetic activating of abDGCs reliably prolonged seizure duration. l CNO treatment alone did not influence the ADD and GSD of control animals injected with AAV-CamKIIα-GFP (n = 9)
Fig. 7
Fig. 7
Repeated inhibition of abDGCs long-termly alleviates hippocampal seizures in TLE models. a, b Effects of 7-times repeated photo-activation of the 8-weeks-old abDGCs on ADD (a) and GSD (b) during hippocampal seizures (n = 8, *p < 0.05, Friedman-tests with post-hoc Dunn’s test for multiple comparisons). c Statistics of percentage of mice maintained their increased ADD (post ADD > pre ADD) or GSD (post GSD > pre GSD) after receiving 3- or 7-times repeated photo-activations. d, e Effects of 7-times repeated photo-inhibition of the 8-weeks-old abDGCs on ADD (d) and GSD (e) during hippocampal seizures (n = 7, **p < 0.01, Friedman-tests with post-hoc Dunn’s test for multiple comparisons). f Statistics of percentage of mice maintained their decreased ADD (post ADD < pre ADD) or GSD (post GSD < pre GSD) after receiving 3- or 7-times repeated photo-inhibitions. g Experiment scheme of the cell proliferation in SGZ in KA chronic epilepsy model. h, i Proliferative activity in the SGZ was significantly increased at 7 d, remained elevated at 14 d, and returned to baseline levels by 30 d after SE (n = 4 for each group; ****p < 0.0001, compared with control; One-way ANOVA followed by post hoc Dunnett test). Proliferative activity was represented by BrdU-immunostaining in the SGZ ipsilateral to the electrode-implanted hippocampi (bar = 50 μm) and the enlarged images (bar = 10 μm). j Experiment scheme of virus delivery and chemogenetic inhibition protocol in KA chronic epilepsy model. k Typical EEGs of SRS in chronic KA epilepsy model. The black arrows indicate the beginning of seizure events. l Histochemical verification of hM4D-mCherry-expressing abDGCs in the DG (bar = 50 μm) and the enlarged images (bar = 10 μm). m, n Effects of chemogenetic inhibition of 8-weeks-old abDGCs on seizure duration (m) and frequency (n) each day in pUX-hM4D mice (n = 8 for hM4D group, n = 6 for control group). o, p The statistical summary of the effects of chemogenetic inhibition of 8-weeks-old abDGCs on seizure duration (total seizure duration/8 h) (o) and seizure frequency (total number of seizures/8 h) (p) in pUX-hM4D mice (n = 8, *p < 0.05, **p < 0.01, Friedman-tests with post-hoc Dunn’s test for multiple comparisons). q, r Effects of CNO alone on seizure duration (q) and seizure frequency (r) in chronic control animals (n = 6)

Similar articles

Cited by

References

    1. Thijs RD, Surges R, O’Brien TJ, Sander JW. Epilepsy in adults. Lancet. 2019;393:689–701. doi: 10.1016/S0140-6736(18)32596-0. - DOI - PubMed
    1. Collaborators, G.B.D.E. Global, regional, and national burden of epilepsy, 1990–2016: a systematic analysis for the Global Burden of Disease Study 2016. Lancet Neurol. 2019;18:357–375. doi: 10.1016/S1474-4422(18)30454-X. - DOI - PMC - PubMed
    1. Engel J., Jr. Mesial temporal lobe epilepsy: what have we learned? Neuroscientist. 2001;7:340–52. doi: 10.1177/107385840100700410. - DOI - PubMed
    1. Wang Y, Chen Z. An update for epilepsy research and antiepileptic drug development: Toward precise circuit therapy. Pharmacol. Ther. 2019;201:77–93. doi: 10.1016/j.pharmthera.2019.05.010. - DOI - PubMed
    1. Jobst BC, Cascino GD. Resective epilepsy surgery for drug-resistant focal epilepsy: a review. JAMA. 2015;313:285–93. doi: 10.1001/jama.2014.17426. - DOI - PubMed

Publication types