. 2023 Jun 6;14(1):3304.
doi: 10.1038/s41467-023-38840-8.

Colitis ameliorates cholestatic liver disease via suppression of bile acid synthesis

Affiliations

Colitis ameliorates cholestatic liver disease via suppression of bile acid synthesis

Wenfang Gui et al. Nat Commun. .

Abstract

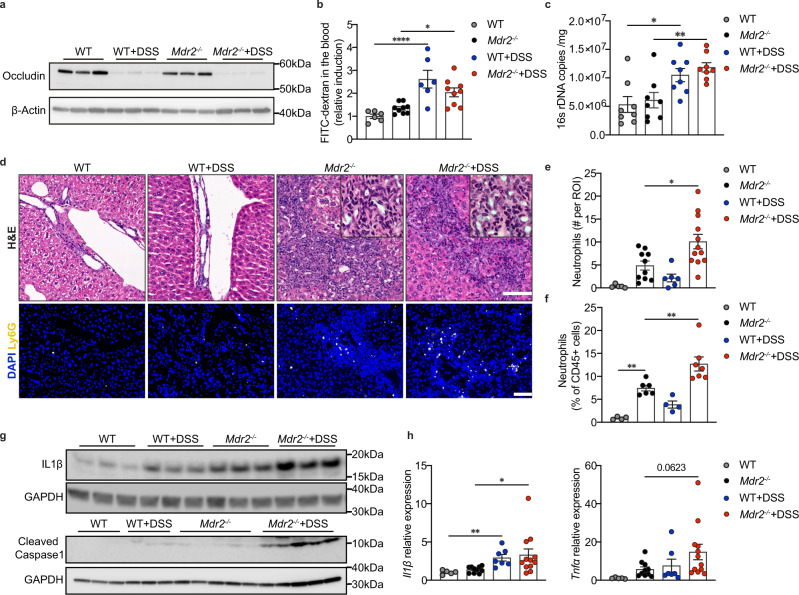
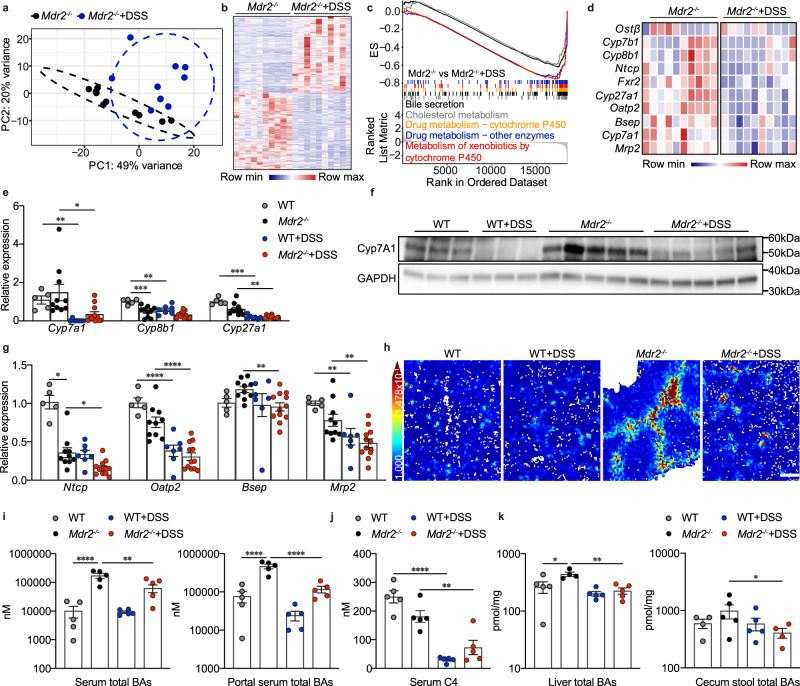
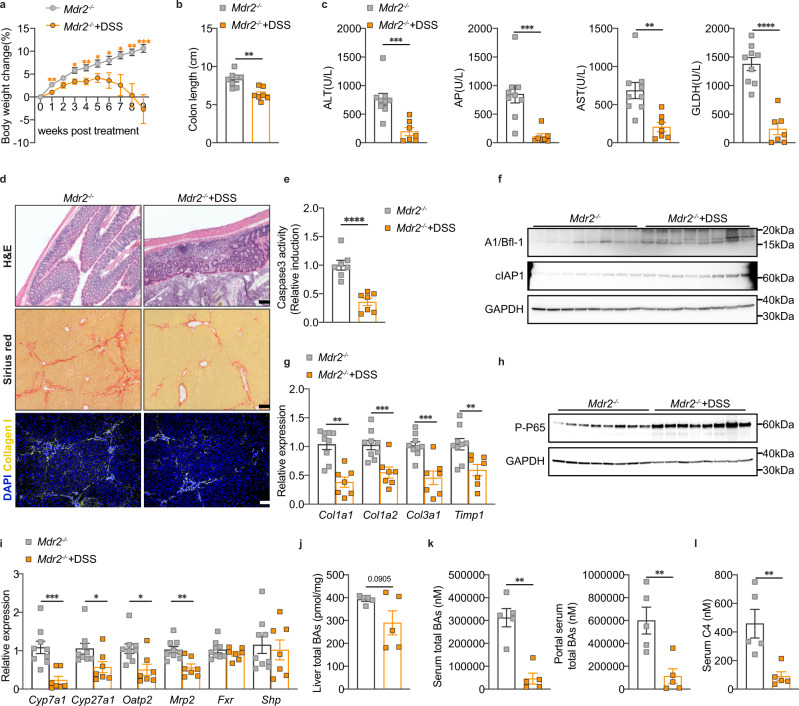
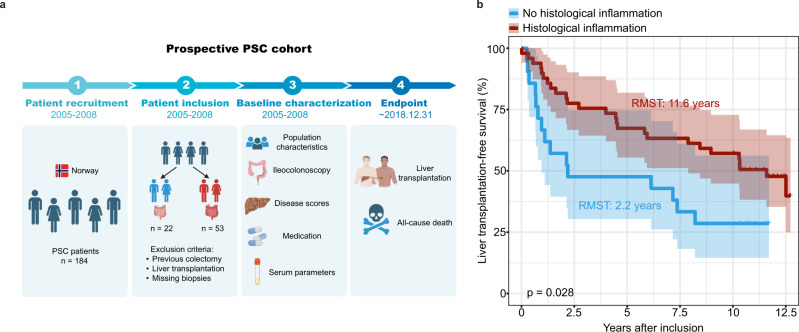
Primary sclerosing cholangitis (PSC) is a chronic cholestatic liver disease characterized by chronic inflammation and progressive fibrosis of the biliary tree. The majority of PSC patients suffer from concomitant inflammatory bowel disease (IBD), which has been suggested to promote disease development and progression. However, the molecular mechanisms by which intestinal inflammation may aggravate cholestatic liver disease remain incompletely understood. Here, we employ an IBD-PSC mouse model to investigate the impact of colitis on bile acid metabolism and cholestatic liver injury. Unexpectedly, intestinal inflammation and barrier impairment improve acute cholestatic liver injury and result in reduced liver fibrosis in a chronic colitis model. This phenotype is independent of colitis-induced alterations of microbial bile acid metabolism but mediated via hepatocellular NF-κB activation by lipopolysaccharide (LPS), which suppresses bile acid metabolism in-vitro and in-vivo. This study identifies a colitis-triggered protective circuit suppressing cholestatic liver disease and encourages multi-organ treatment strategies for PSC.


Conflict of interest statement

The authors declare no competing interests.

Figures

Fig. 1
Fig. 1. Acute experimental colitis alleviates cholestatic hepatocyte injury in Mdr2−/− mice.
a The body weight curves and (b) colon length of WT and Mdr2−/− mice (WT, n = 5; Mdr2−/−,n = 10; WT + DSS, n = 7; Mdr2−/−+DSS, n = 12); one-way ANOVA with Bonferroni’s multiple comparison test (Colon length: WT vs WT + DSS: 95% CI 1.025–2.895, P < 0.0001; Mdr2−/− vs Mdr2−/−+DSS, 95% CI 1.26–2.627, P < 0.0001). c Representative images of haematoxylin and eosin (H&E) stained distal colon (scale bar, 100 µm) (WT, n = 5; Mdr2−/−,n = 9; WT + DSS, n = 7; Mdr2−/−+DSS, n = 12). d Scoring of colon inflammation (WT, n = 5; Mdr2−/−, n = 7; WT + DSS, n = 7; Mdr2−/−+DSS, n = 8); Kruskal-Wallis test with Dunn’s multiple comparison test (WT vs WT + DSS, P = 0.0051; Mdr2−/− vs Mdr2−/−+DSS, P = 0.0021). e Serum ALT, AST and AP levels (WT, n = 7; Mdr2−/−, n = 9; WT + DSS, n = 6; Mdr2−/−+DSS, n = 10) from 2 representative independent cohorts; one-way ANOVA with Bonferroni’s multiple comparison test (ALT: WT vs Mdr2−/−, 95% CI −645.6 to −399, P < 0.0001; Mdr2−/− vs Mdr2−/−+DSS, 95% CI 234.5–459.3, P < 0.0001; WT + DSS vs vs Mdr2−/−+DSS, 95% CI −317 to −64.35, P = 0.0016; AST: WT vs Mdr2−/−, 95% CI −617.5 to −360.9, P < 0.0001; Mdr2−/− vs Mdr2−/−+DSS, 95% CI 231.8 to 465.8, P < 0.0001; WT + DSS vs vs Mdr2−/−+DSS, 95% CI −284.7 to −21.68, P = 0.0171; AP: WT vs Mdr2−/−, 95% CI −638.1 to −437, P < 0.0001; Mdr2−/− vs Mdr2−/−+DSS, 95% CI 323.9–507.2, P < 0.0001; WT + DSS vs vs Mdr2−/−+DSS, 95% CI −284.2 to −78.16, P = 0.0003). f Analysis of liver caspase 3 activity (WT, n = 6; Mdr2−/−, n = 7; WT + DSS, n = 6; Mdr2−/−+DSS, n = 7); one-way ANOVA with Bonferroni’s multiple comparison test (WT vs Mdr2−/−, 95% CI −3.174 to −0.8397, P = 0.0009; Mdr2−/− vs Mdr2−/−+DSS, 95% CI 0.2597–2.503, P = 0.0144). g Western blot of liver anti-apoptotic A1/Bfl-1 and cIAP1 (WT, n = 3; Mdr2−/−, n = 5; WT + DSS, n = 3; Mdr2−/−+DSS, n = 5). All data are graphed as mean ± SEM and considered significant at *p < 0.05, **p < 0.01, ***p < 0.001 and ****p < 0.0001. Source data are provided as a Source Data file.
Fig. 2
Fig. 2. Colitis and intestinal barrier impairment trigger translocation of bacterial components and hepatic inflammation.
a Images of colon Occludin western blot (n = 3 mice per group). b Analysis of FITC-dextran assay (WT, n = 6; Mdr2−/−, n = 9; WT + DSS, n = 6; Mdr2−/−+DSS, n = 9); one-way ANOVA with Bonferroni’s multiple comparison test (WT vs WT + DSS, 95% CI −2.428 to −0.8037, P < 0.0001; Mdr2−/− vs Mdr2−/−+DSS, 95% CI −1.358 to −0.03156, P = 0.0378). c Measurement of total bacterial 16S rDNA in the frozen liver (n = 8 mice per group); one-way ANOVA with Bonferroni’s multiple comparison test (WT vs WT + DSS, 95% CI −9700599 to −601901, P = 0.0212; Mdr2−/− vs Mdr2−/−+DSS, 95% CI −10300599 to −1201901, P = 0.0087). d Representative H&E and Ly6G stainings of liver sections (H&E: WT, n = 5; Mdr2−/−, n = 10; WT + DSS, n = 7; Mdr2−/−+DSS, n = 12; Ly6G: WT, n = 5; Mdr2−/−, n = 8; WT + DSS, n = 7; Mdr2−/−+DSS, n = 10) (scale bar,100 µm). e Quantification of liver neutrophils identified by their characteristic morphology in liver H&E staining (WT, n = 5; Mdr2−/−, n = 10; WT + DSS, n = 6; Mdr2−/−+DSS, n = 12); one-way ANOVA with Bonferroni’s multiple comparison test (Mdr2−/− vs Mdr2−/−+DSS, 95% CI −9.688 to −0.7727, P = 0.0161). f The percentage of liver CD11b+Ly6G+ neutrophils to CD45+ leukocytes (WT, n = 4; Mdr2−/−, n = 6; WT + DSS, n = 4; Mdr2−/−+DSS, n = 7); one-way ANOVA with Bonferroni’s multiple comparison test (WT vs Mdr2−/−, 95% CI −11.32 to −1.761, P = 0.0055; Mdr2−/− vs Mdr2−/−+DSS, 95% CI −9.374 to −1.138, P = 0.0095). g Hepatic protein expression of IL1β (n = 3 mice per group) and Cleaved Caspase1 (WT, n = 3; Mdr2−/−, n = 5; WT + DSS, n = 3; Mdr2−/−+DSS, n = 5). h Liver Il1β and Tnfα mRNA expression (WT, n = 5; Mdr2−/−, n = 10; WT + DSS, n = 7; Mdr2−/−+DSS, n = 12); Kruskal-Wallis test with Dunn’s multiple comparison test (Il1β: WT vs WT + DSS, P = 0.0065; Mdr2−/− vs Mdr2−/−+DSS, P = 0.0231; Tnfα: Mdr2−/− vs Mdr2−/−+DSS, P = 0.0623). All data are displayed as mean ± SEM and considered statistically significant at *p < 0.05, **p < 0.01, ***p < 0.001 and ****p < 0.0001. Source data are provided as a Source Data file.
Fig. 3
Fig. 3. Colitis dampens bile acid synthesis and transport in Mdr2−/− mice.
a PCA (principal component analysis) plot of liver RNA-seq data (n = 10 mice per group). b Heatmap of differentially expressed genes from hepatic RNA-seq data (n = 10 mice per group); Wald test with Benjamini-Hochberg adjustment (two-sided) (padj < 0.05 & Log2foldchange > 1 or < −1). c Suppressed pathways in DSS-treated Mdr2−/− liver identified by RNA-seq-based gene set enrichment analysis (n = 10 mice per group). d Heatmap of liver RNA-seq data shows downregulated genes (n = 10 mice per group). e mRNA expression of genes related to bile acid synthesis (WT, n = 5; Mdr2−/−, n = 10; WT + DSS, n = 7; Mdr2−/−+DSS, n = 12); one-way ANOVA with Bonferroni’s multiple comparison test (Cyp8b1: WT vs Mdr2−/−, 95% CI 0.223–0.827, P = 0.0004; WT vs WT + DSS, 95% CI 0.1056–0.7512, P = 0.0063); Kruskal-Wallis test with Dunn’s multiple comparison test (Cyp7a1: WT vs WT + DSS, P = 0.0011; Mdr2−/− vs Mdr2−/−+DSS, P = 0.0197; Cyp27a1: WT vs WT + DSS, P = 0.0008; Mdr2−/− vs Mdr2−/−+DSS, P = 0.0018). f Western blot of liver Cyp7A1 (WT, n = 3; Mdr2−/−, n = 5; WT + DSS, n = 3; Mdr2−/−+DSS, n = 5). g mRNA expression of genes involved in bile acid trafficking (WT, n = 5; Mdr2−/−, n = 10; WT + DSS, n = 7; Mdr2−/−+DSS, n = 12); one-way ANOVA with Bonferroni’s multiple comparison test (Oatp2: WT vs WT + DSS, 95% CI 0.3657–0.8851, P < 0.0001; Mdr2−/− vs Mdr2−/−+DSS, 95% CI 0.2581–0.6379, P < 0.0001; Mrp2: WT vs WT + DSS, 95% CI 0.1302 to 0.7397, P = 0.0042; Mdr2−/− vs Mdr2−/−+DSS, 95% CI 0.0725–0.5182, P = 0.0078); Kruskal-Wallis test with Dunn’s multiple comparison test (Ntcp: WT vs Mdr2−/−, P = 0.0361; Mdr2−/− vs Mdr2−/−+DSS, P = 0.0384; Bsep: Mdr2−/− vs Mdr2−/−+DSS, P = 0.0051). h Spatial distribution of taurocholic acid in the liver visualized by Matrix-assisted laser desorption/ionization mass spectrometry imaging. (WT, n = 5; Mdr2−/−, n = 6; WT + DSS, n = 7; Mdr2−/−+DSS, n = 7) (scale bar, 300 µm; color bar, 147.8–1000). i Total bile acids of serum and portal serum (n = 5 mice per group); one-way ANOVA with Bonferroni’s multiple comparison test (serum total BAs: WT vs Mdr2−/−, 95% CI −238,281 to −83,938, P < 0.0001; Mdr2−/− vs Mdr2−/−+DSS, 95% CI 31,605–185,948, P = 0.0044; portal serum total BAs: WT vs Mdr2−/−, 95% CI −537,812 to −240,590, P < 0.0001; Mdr2−/− vs Mdr2−/−+DSS, 95% CI 200,324–497,546, P < 0.0001). j C4 in serum (n = 5 mice per group); one-way ANOVA with Bonferroni’s multiple comparison test (WT vs WT + DSS, 95% CI 141.7–296.5, P < 0.0001; Mdr2−/− vs Mdr2−/−+DSS, 95% CI 30.64–185.4, P = 0.0048). k Total bile acids of liver and cecum stool (n = 5 mice per group. For technical reason, bile acids can not be assayed in few samples leading to different sample sizes); one-way ANOVA with Bonferroni’s multiple comparison test (liver total BAs: WT vs Mdr2−/−, 95% CI −338.6 to −11.27, P = 0.0336; Mdr2−/− vs Mdr2−/−+DSS, 95% CI 49.95–377.2, P = 0.0085; total BAs of cecum stool: Mdr2−/− vs Mdr2−/−+DSS, 95% CI 17.64–1,138, P = 0.0441).All data are expressed as mean ± SEM and considered statistically significant at *p < 0.05, **p < 0.01, ***p < 0.001 and ****p < 0.0001. Source data are provided as a Source Data file.
Fig. 4
Fig. 4. DSS-triggered liver inflammation mediates alterations of BA metabolism.
a Western blot of distal ileum FGF15 (WT, n = 3; Mdr2−/−, n = 5; WT + DSS, n = 3; Mdr2−/−+DSS, n = 5). b mRNA expression of liver Fxr and Shp (WT, n = 5; Mdr2−/−, n = 10; WT + DSS, n = 7; Mdr2−/−+DSS, n = 12); one-way ANOVA with Bonferroni’s multiple comparison test (Fxr & Shp: no statistical difference between Mdr2−/− vs Mdr2−/−+DSS). c Activated pathways in DSS-treated Mdr2−/− liver identified by RNA-seq-based gene set enrichment analysis (n = 10 mice per group). d Heatmap of liver RNA-seq data demonstrates upregulated inflammatory genes (n = 10 mice per group). e Spleen to body weight ratio (WT, n = 5; Mdr2−/−, n = 10; WT + DSS, n = 7; Mdr2−/−+DSS, n = 12); one-way ANOVA with Bonferroni’s multiple comparison test (WT vs Mdr2−/−, 95% CI −0.4801 to −0.007131, P = 0.0412; Mdr2−/− vs Mdr2−/−+DSS, 95% CI −0.5723 to −0.2025, P < 0.0001). f Spearman correlation heatmap reveals negative correlation between liver inflammatory genes and BA metabolism genes(Mdr2−/−, n = 10; Mdr2−/−+DSS, n = 10). g Heatmap of differentially expressed genes from microarray analysis of co-cultured human primary hepatocytes and Kupffer cells treated with or without LPS in 3-dimentional Human Liver Microtissues (MT) (n = 3 samples per group). h Serum ALT, AP and AST levels (n = 7 mice per group); unpaired two-tailed Student’s t-test (ALT: Mdr2−/−+PBS vs Mdr2−/−+LPS, P = 0.0494; AP: Mdr2−/−+PBS vs Mdr2−/−+LPS, P = 0.0186; AST: Mdr2−/−+PBS vs Mdr2−/−+LPS, P = 0.0432). i The percentage of liver neutrophils to CD45+ leukocytes (n = 7 mice per group); unpaired two-tailed Student’s t-test (Mdr2−/−+PBS vs Mdr2−/−+LPS, P < 0.0001). j Western blot of liver phosphorylated NF-κB P65 (n = 7 mice per group). k mRNA expression of hepatic genes responsible for bile acid synthesis (n = 7 mice per group); unpaired two-tailed Student’s t-test (Mdr2−/−+PBS vs Mdr2−/−+LPS: Cyp27a1, P = 0.0247); Two-tailed Mann–Whitney test (Mdr2−/−+PBS vs Mdr2−/−+LPS: Cyp7a1, P = 0.007; Cyp8b1, P = 0.0111). l mRNA expression of hepatic genes associated with bile acid transporter (n = 7 mice per group); unpaired two-tailed Student’s t-test (Mdr2−/−+PBS vs Mdr2−/−+LPS: Mrp3, P = 0.0011); Two-tailed Mann–Whitney test (Mdr2−/−+PBS vs Mdr2−/−+LPS: Ntcp, P = 0.0111; Oatp2, P = 0.0175; Bsep, P = 0.0006; Mrp2, P = 0.0111). All data are mean ± SEM and considered significant at *p < 0.05, **p < 0.01, ***p < 0.001 and ****p < 0.0001. Source data are provided as a Source Data file.
Fig. 5
Fig. 5. Abrogation of NF-κB signaling aggravates cholestasis in Mdr2−/− mice.
a Western blot of liver phosphorylated NF-κB P65 (WT, n = 3; Mdr2−/−, n = 5; WT + DSS, n = 3; Mdr2−/−+DSS, n = 5). b Spearman correlation heatmap of RNA-seq analysis demonstrates negative correlation between liver Nfkb and BA metabolism genes(Mdr2−/−, n = 10; Mdr2−/−+DSS, n = 10). c Representative images of Mdr2−/− and Mdr2−/−NemoΔhepa mice. d Body weight of Mdr2−/− and Mdr2−/−NemoΔhepa mice (Mdr2−/−, n = 7; Mdr2−/−NemoΔhepa, n = 5); unpaired two-tailed Student’s t-test (Mdr2−/− vs Mdr2−/−NemoΔhepa, P < 0.0001). e Serum ALT, AP and AST levels (Mdr2−/−, n = 7; Mdr2−/−NemoΔhepa, n = 5); unpaired two-tailed Student’s t-test (ALT: Mdr2−/− vs Mdr2−/−NemoΔhepa, P = 0.0008; AST: Mdr2−/− vs Mdr2−/−NemoΔhepa, P < 0.0001); Two-tailed Mann–Whitney test (AP: Mdr2−/− vs Mdr2−/−NemoΔhepa, P = 0.0025). f The percentage of hepatic neutrophils to CD45+ leukocytes (Mdr2−/−, n = 4; Mdr2−/−NemoΔhepa, n = 5); unpaired two-tailed Student’s t-test (Mdr2−/− vs Mdr2−/−NemoΔhepa, P = 0.0064). g Representative images of liver H&E, CK19 and Sirius red stainings (Mdr2−/−, n = 8; Mdr2−/−NemoΔhepa, n = 6) (scale bar, 100 µm). h Liver mRNA expression of fibrotic markers (Mdr2−/−, n = 5; Mdr2−/−NemoΔhepa, n = 7); unpaired two-tailed Student’s t-test (Mdr2−/− vs Mdr2−/−NemoΔhepa: Col1a1, P = 0.0013; Col1a2, P = 0.0006; Col3a1, P = 0.035; Mmp2, P = 0.0047; Timp1, P = 0.0181; αSma, P = 0.0025; Cd34, P = 0.0247; Thy1, P = 0.0164; Elastin, P = 0.0002); Two-tailed Mann–Whitney test (Mdr2−/− vs Mdr2−/−NemoΔhepa: Desmin, P = 0.0303; Msln, P = 0.0051). i Western blot of liver Cyp7A1 and αSMA (Mdr2−/−, n = 5; Mdr2−/−NemoΔhepa, n = 8); unpaired two-tailed Student’s t-test (αSMA: Mdr2−/− vs Mdr2−/−NemoΔhepa, P = 0.0003); Two-tailed Mann–Whitney test (Cyp7A1: Mdr2−/− vs Mdr2−/−NemoΔhepa, P = 0.0016). j Bile acids measurement of liver (Mdr2−/−, n = 5; Mdr2−/−NemoΔhepa, n = 3) and serum (Mdr2−/−, n = 5; Mdr2−/−NemoΔhepa, n = 4); unpaired two-tailed Student’s t-test (Liver total BAs: Mdr2−/− vs Mdr2−/−NemoΔhepa, P = 0.0359); Two-tailed Mann–Whitney test (Serum total UBAs: Mdr2−/− vs Mdr2−/−NemoΔhepa, P = 0.0095). All data are mean ± SEM and considered significant at *p < 0.05, **p < 0.01, ***p < 0.001 and ****p < 0.0001. Source data are provided as a Source Data file.
Fig. 6
Fig. 6. Chronic colitis attenuates liver disease progression in Mdr2−/− mice.
a Body weight change of Mdr2−/− mice after 1% DSS treatment for 9 weeks (Mdr2−/−, n = 9; Mdr2−/−+DSS, n = 7); unpaired two-tailed Student’s t-test (Mdr2−/− vs Mdr2−/−+DSS: week1, P = 0.004; week3, P = 0.0143; week4, P = 0.0094; week5, P = 0.0242; week6, P = 0.0279; week8, P = 0.0016; week9, P = 0.0005); Two-tailed Mann–Whitney test (Mdr2−/− vs Mdr2−/−+DSS: week7, P = 0.0229). b Colon length of Mdr2−/− mice with or without 1% DSS treatment (Mdr2−/−, n = 8; Mdr2−/−+DSS, n = 7); unpaired two-tailed Student’s t-test (Mdr2−/− vs Mdr2−/−+DSS, P = 0.001). c Serum ALT, AP, AST and GLDH levels (Mdr2−/−, n = 9; Mdr2−/−+DSS, n = 7); unpaired two-tailed Student’s t-test (Mdr2−/− vs Mdr2−/−+DSS: AST, P = 0.0028; GLDH, P < 0.0001); Two-tailed Mann–Whitney test (Mdr2−/− vs Mdr2−/−+DSS: ALT, P = 0.0007; AP, P = 0.0003). d Representative images of H&E stained distal colon (Mdr2−/−, n = 9; Mdr2−/−+DSS, n = 7), liver Sirius red (Mdr2−/−, n = 9; Mdr2−/−+DSS, n = 7) and collagen I stainings (Mdr2−/−, n = 8; Mdr2−/−+DSS, n = 7) (scale bar, 100 µm). e Analysis of liver caspase 3 activity (n = 7 mice per group); unpaired two-tailed Student’s t-test (Mdr2−/− vs Mdr2−/−+DSS, P < 0.0001). f Western blot of liver A1/Bfl-1 and cIAP1 (n = 8 mice per group); g Real-time PCR analysis of fibrotic genes (Mdr2−/−, n = 9; Mdr2−/−+DSS, n = 7); unpaired two-tailed Student’s t-test (Mdr2−/− vs Mdr2−/−+DSS: Col1a2, P = 0.0018; Col3a1, P = 0.0006; Timp1, P = 0.007); Two-tailed Mann–Whitney test (Mdr2−/− vs Mdr2−/−+DSS: Col1a1, P = 0.0007). h Western blot of liver phosphorylated NF-κB P65 (n = 8 mice per group). i Gene expression related to bile acid metabolism (Mdr2−/−, n = 9; Mdr2−/−+DSS, n = 7); unpaired two-tailed Student’s t-test (Mdr2−/− vs Mdr2−/−+DSS: Mrp2, P = 0.0023; Fxr & Shp, no statistical differences); Two-tailed Mann–Whitney test (Mdr2−/− vs Mdr2−/−+DSS: Cyp7a1, P = 0.0007; Cyp27a1, P = 0.0311; Oatp2, P = 0.0229). j Total bile acids of liver (n = 5 mice per group); unpaired two-tailed Student’s t-test (Mdr2−/− vs Mdr2−/−+DSS: P = 0.0905). k Total bile acids of serum and portal serum (n = 5 mice per group); unpaired two-tailed Student’s t-test (Mdr2−/− vs Mdr2−/−+DSS: portal serum total BAs, P = 0.0068); Two-tailed Mann–Whitney test (Mdr2−/− vs Mdr2−/−+DSS: serum total BAs, P = 0.0079). l Serum C4 (n = 5 mice per group); unpaired two-tailed Student’s t-test (Mdr2−/− vs Mdr2−/−+DSS: P = 0.0081). All data are graphed as mean ± SEM and considered significant at *p < 0.05, **p < 0.01, ***p < 0.001 and ****p < 0.0001. Source data are provided as a Source Data file.
Fig. 7
Fig. 7. Histological inflammation of intestine improves the liver transplantation-free survival in PSC patients.
a Diagram of the study design for the PSC cohort. b Kaplan–Meier survival curves of PSC patients according to the presence of histological inflammation of intestine. (Histological inflammation: n = 49; No histological inflammation: n = 21; 4 patients with histological inflammation and 1 patient without were excluded to avoid bias caused by patients already being listed for a liver transplantation since they reached endpoint within 3 months from inclusion). Survival probabilites for each group are shown using the Kaplan-Meier estimator with corresponding (coloured) 95% confidence intervals and the log-rank test (P = 0.028). Average survival times are shown in figure using restricted mean survival time (RMST). Source data are provided as a Source Data file.

References

    1. Ponsioen CY, et al. Defining primary sclerosing Cholangitis: Results from an international primary sclerosing cholangitis study group consensus process. Gastroenterology. 2021;161:1764–1775.e1765. doi: 10.1053/j.gastro.2021.07.046. - DOI - PubMed
    1. Boonstra K, Beuers U, Ponsioen CY. Epidemiology of primary sclerosing cholangitis and primary biliary cirrhosis: A systematic review. J. Hepatol. 2012;56:1181–1188. doi: 10.1016/j.jhep.2011.10.025. - DOI - PubMed
    1. Hirschfield GM, Karlsen TH, Lindor KD, Adams DH. Primary sclerosing cholangitis. Lancet. 2013;382:1587–1599. doi: 10.1016/S0140-6736(13)60096-3. - DOI - PubMed
    1. Loftus EV, Jr., et al. PSC-IBD: A unique form of inflammatory bowel disease associated with primary sclerosing cholangitis. Gut. 2005;54:91–96. doi: 10.1136/gut.2004.046615. - DOI - PMC - PubMed
    1. Dyson JK, Beuers U, Jones DEJ, Lohse AW, Hudson M. Primary sclerosing cholangitis. Lancet. 2018;391:2547–2559. doi: 10.1016/S0140-6736(18)30300-3. - DOI - PubMed

Publication types

Substances