. 2023 Jun 6;14(1):3188.
doi: 10.1038/s41467-023-38946-z.

Neoantigen-specific CD8 T cells with high structural avidity preferentially reside in and eliminate tumors

Affiliations

Neoantigen-specific CD8 T cells with high structural avidity preferentially reside in and eliminate tumors

Julien Schmidt et al. Nat Commun. .

Abstract

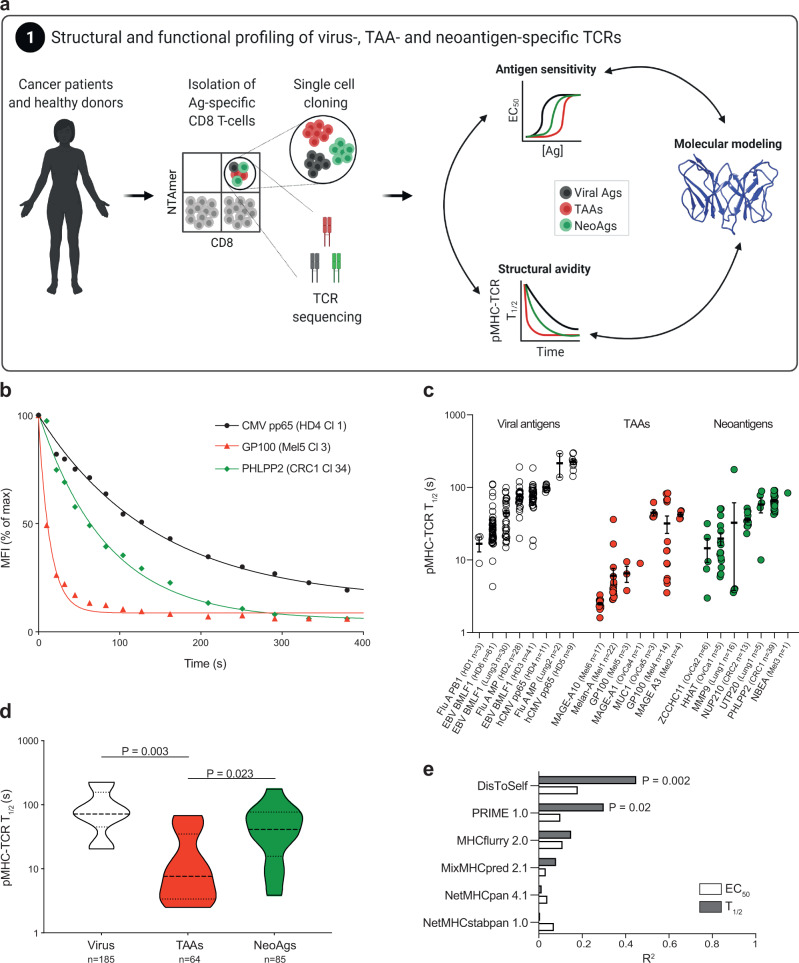
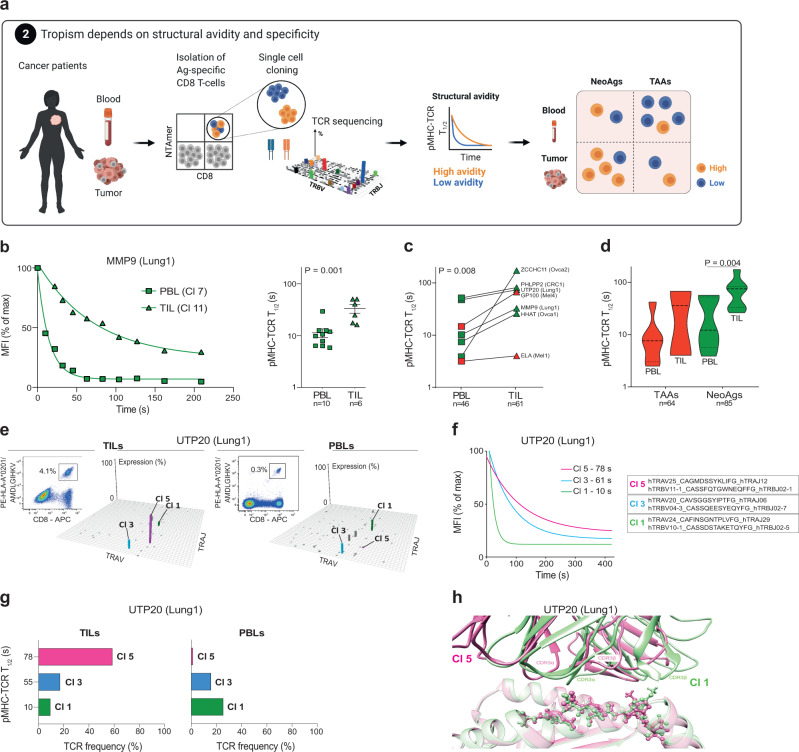
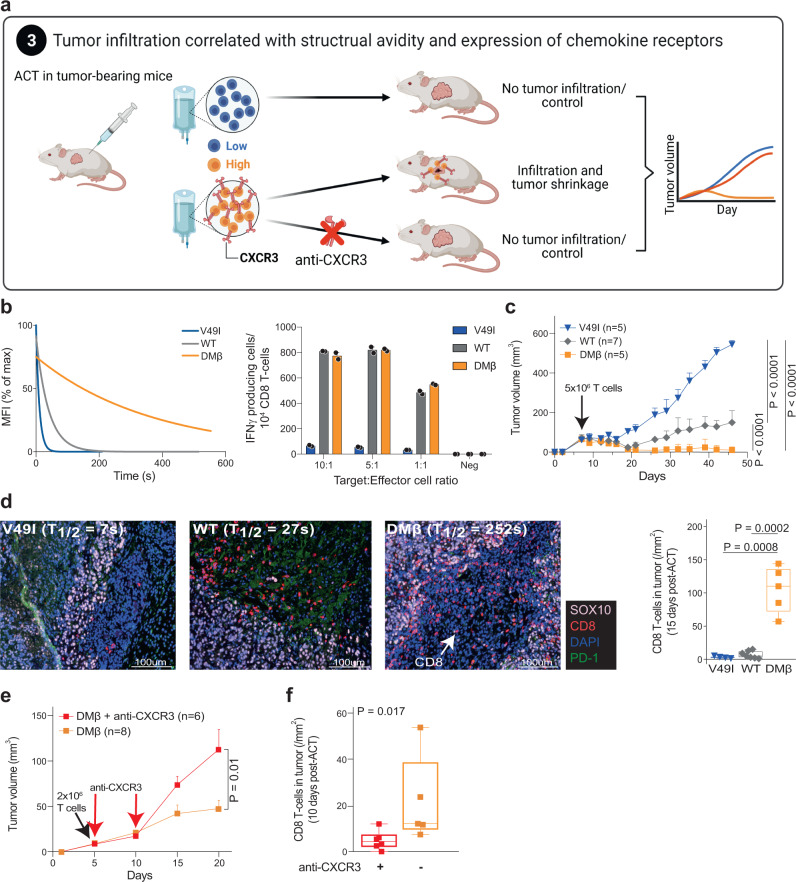
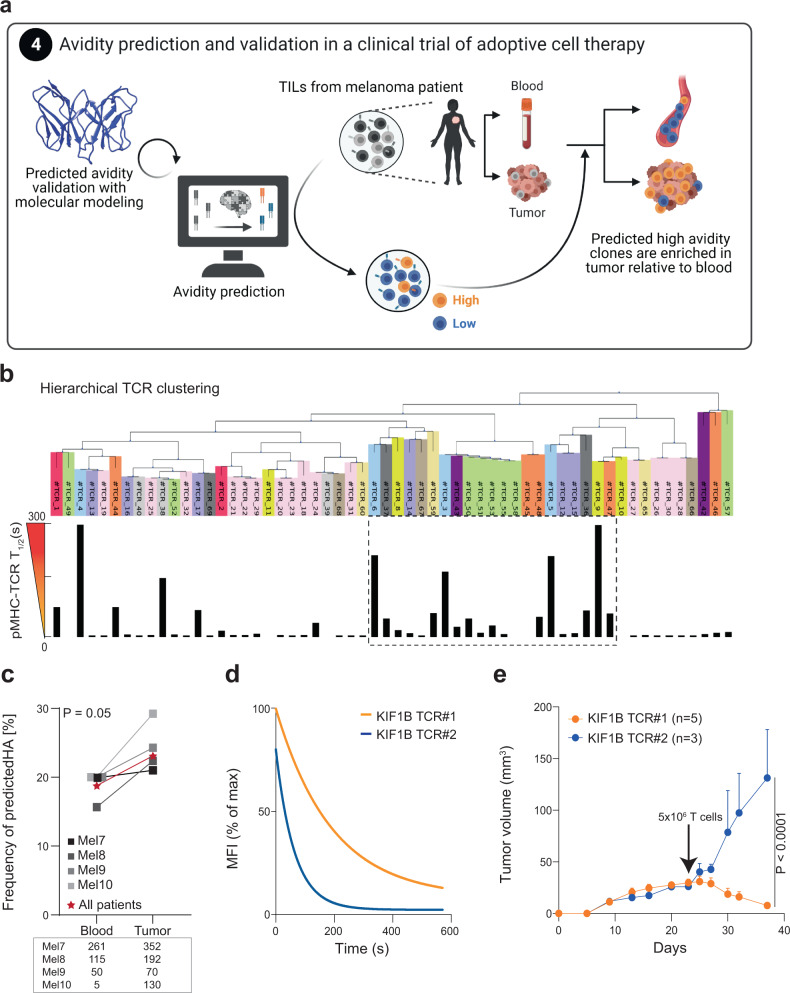
The success of cancer immunotherapy depends in part on the strength of antigen recognition by T cells. Here, we characterize the T cell receptor (TCR) functional (antigen sensitivity) and structural (monomeric pMHC-TCR off-rates) avidities of 371 CD8 T cell clones specific for neoantigens, tumor-associated antigens (TAAs) or viral antigens isolated from tumors or blood of patients and healthy donors. T cells from tumors exhibit stronger functional and structural avidity than their blood counterparts. Relative to TAA, neoantigen-specific T cells are of higher structural avidity and, consistently, are preferentially detected in tumors. Effective tumor infiltration in mice models is associated with high structural avidity and CXCR3 expression. Based on TCR biophysicochemical properties, we derive and apply an in silico model predicting TCR structural avidity and validate the enrichment in high avidity T cells in patients' tumors. These observations indicate a direct relationship between neoantigen recognition, T cell functionality and tumor infiltration. These results delineate a rational approach to identify potent T cells for personalized cancer immunotherapy.


Conflict of interest statement

G.C. has received grants, research support or is coinvestigator in clinical trials by Bristol-Myers-Squibb, Celgene, Boehringer Ingelheim, Tigen, Roche, Iovance and Kite. G.C. has received honoraria for consultations or presentations by Roche, Genentech, BMS, AstraZeneca, Sanofi-Aventis, Nextcure and GeneosTx. G.C. has patents in the domain of antibodies and vaccines targeting the tumor vasculature as well as technologies related to T cell expansion and engineering for T cell therapy. G.C. receives royalties from the University of Pennsylvania. S.B. and A.H. have patents in technologies related to T cell expansion and engineering for T cell therapy. Other authors declare no competing interests.

Figures

Fig. 1
Fig. 1. Structural avidity of neoantigen-, TAA- and virus-specific CD8 T cells.
a Neoantigen- and TAA-specific CD8 T cells were purified from in vitro expanded CD8 T cells of melanoma, ovarian, lung or colorectal cancer patients and virus-specific CD8 were isolated from healthy donors and cancer patients. After single-cell cloning and expansion, individual clones were subjected to antigen sensitivity and structural avidity measurements as well as TCR sequencing. Molecular modeling of pMHC-TCR interactions were also performed. b Representative examples of structural avidity of virus-, TAA- and neoantigen-specific CD8 T cells. Structural avidity was determined with reversible pMHC multimers to measure monomeric pMHC-TCR T1/2. c Structural avidity of individual virus-, TAA- or neoantigen-specific CD8 T cells (mean ± SEM). The number of clones is indicated in brackets (each clone was tested individually). d Cumulative structural avidities per classes of antigen- (virus, TAAs and neoantigen)-specific CD8 T cells. The number of clones is indicated in brackets. P values are provided when significant at 95% confidence interval and using two-sided Mann–Whitney test. e Coefficient of determination R2 of the regression analyses (Supplementary Fig. 4a–f) between pMHC binding/stability and immunogenicity predictors values and the medians of T1/2 (s) or EC50 (M) of antigen-specific CD8 T cells. Pearson coefficients (two-sided test) were calculated and mentioned when significant. Patients and clones are described in Supplementary Tables 1 and 2. Source data are provided as a Source Data file.
Fig. 2
Fig. 2. Association between structural avidity and tumor tropism.
a Correlation between the structural profile of antigen-specific CD8 T cells and tropism at steady state. b Representative examples and cumulative analyses (Mean ± SEM) of monomeric pMHC-TCR dissociation kinetics of MMP9-specific PBLs and TILs assessed with NTAmers (reversible pMHC multimers). The number of clones is indicated in brackets (each clone was tested individually). P values are provided at 95% confidence interval and using two-sided Mann–Whitney test. c Comparison of the structural avidity of seven pairs of PBLs and TILs recognizing the same pMHCs. The number of clones is indicated in brackets (each clone was tested individually). Wilcoxon two-sided test was used to determine the P value. d Structural avidity of TAA- and neoantigen-specific PBLs and TILs. The number of clones is indicated in brackets. P values are provided at 95% confidence interval and using two-sided Mann–Whitney test when significant. e UTP20-specific CD8 T cells from patient Lung1 were sorted from TILs and PBLs using NTAmers, bulk TCR sequenced and cloned by limiting dilution. The Manhattan plots of TCRα repertoires are shown and only clonotypes identified in both PBLs and TILs repertoires are color-coded. f Monomeric pMHC-TCR dissociation kinetics of three UTP20-specific clones of patient Lung1 assessed with reversible pMHC multimers (NTAmers). g Relative frequency of clones 1, 3 and 5 among UTP20-specific CD8 TILs (left) and PBLs (right). Structural avidity for each clone is also plotted. h Superimposition of in silico analyses of the pMHC-TCRs molecular interactions for UTP20-specific clones 5 and 1. Pink and green are used to color TCR ribbons, MHC (shaded color) and peptides (ball and stick) for clones 5 and 1, respectively. Source data are provided as a Source Data file.
Fig. 3
Fig. 3. Tumor infiltration of high-avidity clones is associated to CXCR3 expression.
a Preferential tumor infiltration by high-avidity clones and CXCR3-mediated tumor homing was validated by in vivo ACT in mice and in four melanoma patients receiving T cell therapy. b Reactivity of V49I, WT and DMβ-transduced T cell was measured through IFN-γ secretion upon coculture with Me275 tumor cells (right, n = 2 independent experiments, Mean ± SEM) and monomeric pMHC-TCR dissociation kinetics of the three mutants were determined using reversible pMHC multimers (left, n = 2 independent experiments). c Me275 tumor growth in IL-2 NOG mice adoptively transferred at day 7 post-tumor engraftment with 5 × 10⁶ primary CD8 T cells transduced with V49I, WT or DMβ NY-ESO-I157–165-specific TCRs (n = 1 independent experiment, Mean ± SEM). Log-rank two-sided tests were used to determine P values. d Representative examples of Me275 tumor sections, harvested from engrafted IL-2 NOG mice at day 8 post-ACT with 5 × 10⁶ V49I, WT or DMβ-transduced T cells (n = 2 independent experiments). Tumors were stained for SOX10, PD-1 and CD8. DAPI was used to stain nuclei. For tumor infiltration by CD8 T cells (cells/mm2), bounds of box are 25th to 75th percentiles with median, whiskers are min to max. Mann–Whitney two-sided test was used to calculate P values. Analyses were performed using Inform v2.3.0. e Me275 tumor growth in IL-2 NOG mice adoptively transferred with 2 × 10⁶ DMβ-transduced primary CD8 T cells at day 5 and co-injected or not with anti-CXCR3 blocking antibody (100 μg at day 5 and day 10) (n = 2 independent experiments, Mean ± SEM). Log-rank test was used to determine P value. f Quantitative measurement of tumor infiltration by CD8 T cells (cells/mm2) 10 days post-ACT of 2 × 10⁶ DMβ-transduced primary CD8 T cells co-injected or not with anti-CXCR3 blocking antibody (n = 2 independent experiments). Bounds of box are 25th to 75th percentiles with median, whiskers are min to max. Mann–Whitney two-sided test was used to calculate the P value. Source data are provided as a Source Data file.
Fig. 4
Fig. 4. Tumor infiltration after ACT correlates with predicted structural avidity inferred from TCR clustering analyses.
a Computational analysis of TCR features led to the establishment of a predictor of TCR avidity and its application on patients’ TIL-ACT products allowed tracking of predicted low and high-avidity TCRs in post-ACT tumor samples. b Hierarchical clustering of 58 TCR sequences provided based on a biophysical approach. TCRs sharing the closest 4-mer features are next to each other and TCRs recognizing the same pMHC have the same color code. TCR model numbers are presented as labels and further details about TRAV, TRAJ, TRBV, TRBJ, HLA and peptide are found in Supplementary Table 4. The structural avidity of each cognate TCRs is represented below (mean of n = 3 independent experiments). The black dashed box highlights a region where high-avidity TCRs recognizing multiple pMHC specificities are clustering. c Cumulative analysis for four melanoma patients of the percentage of predicted high-avidity CD8 T cells in blood and tumor samples. Values for individual patients are plotted (gray and black) as well as the cumulative analysis (in red) for which the P value was calculated as described in the method section. The number of clones is indicated below for each patient individually. d Monomeric pMHC-TCR dissociation kinetics of Jurkat cells transfected with neoantigen KIF1BS918F-specific TCR#1 and TCR#2, respectively predicted as high and low-avidity TCRs. e Autologous (Mel8) tumor growth in IL-2 NOG mice adoptively transferred at day 22 with 5 × 10⁶ primary T cells transduced with KIF1BS918F-specific TCRs (n = 1 independent experiment, Mean ± SEM). Log-rank two-sided test was used to determine the exact P value. Source data are provided as a Source Data file.

References

    1. Schumacher TN, Schreiber RD. Neoantigens in cancer immunotherapy. Science. 2015;348:69–74. doi: 10.1126/science.aaa4971. - DOI - PubMed
    1. Prickett TD, et al. Durable complete response from metastatic melanoma after transfer of autologous T cells recognizing 10 mutated tumor antigens. Cancer Immunol. Res. 2016;4:669–678. doi: 10.1158/2326-6066.CIR-15-0215. - DOI - PMC - PubMed
    1. Lennerz V, et al. The response of autologous T cells to a human melanoma is dominated by mutated neoantigens. Proc. Natl Acad. Sci. USA. 2005;102:16013–16018. doi: 10.1073/pnas.0500090102. - DOI - PMC - PubMed
    1. Lauss M, et al. Mutational and putative neoantigen load predict clinical benefit of adoptive T cell therapy in melanoma. Nat. Commun. 2017;8:1738. doi: 10.1038/s41467-017-01460-0. - DOI - PMC - PubMed
    1. Lu Y-C, et al. Efficient identification of mutated cancer antigens recognized by T cells associated with durable tumor regressions. Clin. Cancer Res. 2014;20:3401–3410. doi: 10.1158/1078-0432.CCR-14-0433. - DOI - PMC - PubMed

Publication types

Substances