. 2023 Jun 7;11(1):30.
doi: 10.1038/s41413-023-00267-8.

Super enhancers targeting ZBTB16 in osteogenesis protect against osteoporosis

Affiliations

Super enhancers targeting ZBTB16 in osteogenesis protect against osteoporosis

Wenhui Yu et al. Bone Res. .

Erratum in

Abstract

As the major cell precursors in osteogenesis, mesenchymal stem cells (MSCs) are indispensable for bone homeostasis and development. However, the primary mechanisms regulating osteogenic differentiation are controversial. Composed of multiple constituent enhancers, super enhancers (SEs) are powerful cis-regulatory elements that identify genes that ensure sequential differentiation. The present study demonstrated that SEs were indispensable for MSC osteogenesis and involved in osteoporosis development. Through integrated analysis, we identified the most common SE-targeted and osteoporosis-related osteogenic gene, ZBTB16. ZBTB16, positively regulated by SEs, promoted MSC osteogenesis but was expressed at lower levels in osteoporosis. Mechanistically, SEs recruited bromodomain containing 4 (BRD4) at the site of ZBTB16, which then bound to RNA polymerase II-associated protein 2 (RPAP2) that transported RNA polymerase II (POL II) into the nucleus. The subsequent synergistic regulation of POL II carboxyterminal domain (CTD) phosphorylation by BRD4 and RPAP2 initiated ZBTB16 transcriptional elongation, which facilitated MSC osteogenesis via the key osteogenic transcription factor SP7. Bone-targeting ZBTB16 overexpression had a therapeutic effect on the decreased bone density and remodeling capacity of Brd4fl/fl Prx1-cre mice and osteoporosis (OP) models. Therefore, our study shows that SEs orchestrate the osteogenesis of MSCs by targeting ZBTB16 expression, which provides an attractive focus and therapeutic target for osteoporosis. Without SEs located on osteogenic genes, BRD4 is not able to bind to osteogenic identity genes due to its closed structure before osteogenesis. During osteogenesis, histones on osteogenic identity genes are acetylated, and OB-gain SEs appear, enabling the binding of BRD4 to the osteogenic identity gene ZBTB16. RPAP2 transports RNA Pol II from the cytoplasm to the nucleus and guides Pol II to target ZBTB16 via recognition of the navigator BRD4 on SEs. After the binding of the RPAP2-Pol II complex to BRD4 on SEs, RPAP2 dephosphorylates Ser5 at the Pol II CTD to terminate the transcriptional pause, and BRD4 phosphorylates Ser2 at the Pol II CTD to initiate transcriptional elongation, which synergistically drives efficient transcription of ZBTB16, ensuring proper osteogenesis. Dysregulation of SE-mediated ZBTB16 expression leads to osteoporosis, and bone-targeting ZBTB16 overexpression is efficient in accelerating bone repair and treating osteoporosis.


Conflict of interest statement

The authors declare no competing interests.

Figures

None
Without SEs located on osteogenic genes, BRD4 is not able to bind to osteogenic identity genes due to its closed structure before osteogenesis. During osteogenesis, histones on osteogenic identity genes are acetylated, and OB-gain SEs appear, enabling the binding of BRD4 to the osteogenic identity gene ZBTB16. RPAP2 transports RNA Pol II from the cytoplasm to the nucleus and guides Pol II to target ZBTB16 via recognition of the navigator BRD4 on SEs. After the binding of the RPAP2-Pol II complex to BRD4 on SEs, RPAP2 dephosphorylates Ser5 at the Pol II CTD to terminate the transcriptional pause, and BRD4 phosphorylates Ser2 at the Pol II CTD to initiate transcriptional elongation, which synergistically drives efficient transcription of ZBTB16, ensuring proper osteogenesis. Dysregulation of SE-mediated ZBTB16 expression leads to osteoporosis, and bone-targeting ZBTB16 overexpression is efficient in accelerating bone repair and treating osteoporosis.
Fig. 1
Fig. 1
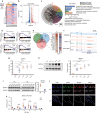
SE profile analysis and identification of critical OB-gain SEs. a ChIP-seq profile heatmaps showing H3K27ac abundance in hBMMSCs, H3K27ac and BRD4 abundance in hFOB1.19 cells and H3K27ac and MED1 abundance in immortal TERT4-MSCs. b Example signal traces of OB-gain, OB-lost and nonspecific SEs. The shadows indicate SE regions. c ChIP-seq profile heatmaps of the SEs identified by H3K27ac in hBMMSCs, H3K27ac and BRD4 in immortal hFOB1.19 and H3K27ac and MED1 in TERT4-MSCs cells. d The average SE signal levels are shown in line plots, and the numbers of OB-lost and OB-gain SEs are shown in histograms. e Venn diagram showing the intersecting OB-gain SEs from different datasets. f GO analyses of OB-gain SEs from different datasets
Fig. 2
Fig. 2
SEs are involved in MSC osteogenesis. a ARS and ALP staining showing that BRD4 knockdown and overexpression affect MSC osteogenesis. Quantification of ARS and ALP is shown in the scatter plots. b Western blot analysis showing that BRD4 knockdown and overexpression affect COL I expression in MSCs. c BRD4 knockdown and overexpression affect osteogenesis in vivo. HE, Masson and COL I immunohistochemistry staining of HA/TCP. Scatter plots showing Masson staining quantification. d ARS and ALP staining of MSCs treated with DMSO or 50 nmol·L−1 JQ1. Quantification of ARS and ALP is shown in the scatter plots. e COL I protein abundance in osteogenic-differentiating MSCs treated with DMSO or 50 nmol·L−1 JQ1. The relative intensity of COL I is shown in the scatter plot. f Effects of JQ1 on osteogenesis in vivo. HE, Masson and COL I immunohistochemistry staining of HA/TCP. Scatter plot showing Masson staining quantification. g CUT&Tag profile heatmap of BRD4 in MSCs treated with DMSO or 50 nmol·L−1 JQ1. h Western blot analysis showing BRD4 expression in MSCs from the NCs (n = 21) and OP patients (n = 17). i Immunofluorescence showing BRD4 expression in the femurs of the NCs (n = 21) and OP patients (n = 17). The statistical data are represented as the means ± SEMs, n = 9 (except h, i), *P < 0.05, **P < 0.01, ***P < 0.005, ****P < 0.001
Fig. 3
Fig. 3
SE disorder of MSCs leads to the OP phenotype and delayed bone repair. a DNA electrophoresis was performed to genotype genetically modified mice. b Immunoblot analysis of BRD4 protein expression in different organs of the Brd4fl/fl and Brd4fl/fl Prx1-cre mice. Scatter plot showing the relative protein abundance of BRD4. c Micro-CT analysis of the Brd4fl/fl and Brd4fl/fl Prx1-cre mice, and the trabecular bones were 3D reconstructed. Bone morphometric analysis was performed, and the parameters included bone BV/TV, Tb. Th, Tb. N, Tb. Sp and cortical Ct. Th. d HE and Masson staining of femurs from the Brd4fl/fl and Brd4fl/fl Prx1-cre mice. Scatter plot showing the quantification of Masson staining. e ARS and ALP staining of osteogenic differentiating MSCs extracted from the Brd4fl/fl and Brd4fl/fl Prx1-cre mice. Quantification of ARS and ALP are shown in the scatter plots. f Diagram showing the workflow of calvarial and femoral defect induction and analysis. g Micro-CT analysis showing the calvarial and femoral defects of the Brd4fl/fl and Brd4fl/fl Prx1-cre mice. h CUT&Tag profile heatmap of BRD4 in MSCs from the Brd4fl/fl and Brd4fl/fl Prx1-cre mice. The statistical data are represented as the means ± SEMs, n = 9 (n = 5 in c), *P < 0.05, **P < 0.01, ***P < 0.005, ****P < 0.001
Fig. 4
Fig. 4
ZBTB16 plays a pivotal role in SE-mediated osteogenesis but is decreased in OP. a Heatmap of DEGs between MSCs not undergoing osteogenic induction and MSCs during osteogenic differentiation. b Volcano plot showing the DEGs of MSCs in the OB and NC groups. c GO analysis showing the osteogenic-related terms. d GSEA showing the enriched osteogenic-related terms between the NC and OB groups. e Venn diagram showing the intersection of OB-gain SEs in all datasets, significantly upregulated genes in OB MSCs, and DEGs in OP MSCs compared to those of the NC subjects. The log2fc of the 15 intersected genes are shown. f Signal traces of RNA-seq and ChIP-seq data. The shadows show the SE regions. g Scatter plot showing the expression of ZBTB16 mRNA in osteogenic differentiating MSCs. h Immunoblot analysis showing the protein abundance of ZBTB16 in osteogenic differentiating MSCs. Scatter plot showing the relative abundance of ZBTB16. i Western blot analysis showing ZBTB16 expression in MSCs from the NCs (n = 21) and OP patients (n = 17). j Immunofluorescence showing BRD4 and ZBTB16 expression in the femurs of the NCs (n = 21) and OP (n = 17) patients. k ChIP‒qPCR analysis showing BRD4 occupancy on ZBTB16 in MSCs of the NCs (n = 21) and OP (n = 17) patients. The statistical data are represented as the means ± SEMs, n = 9 (except ik), *P < 0.05, **P < 0.01, ***P < 0.005, ****P < 0.001
Fig. 5
Fig. 5
ZBTB16 promotion of osteogenesis is regulated by BRD4 binding with RPAP2. a ARS and ALP staining showing the effects of ZBTB16 knockdown and overexpression on MSC osteogenesis. Quantification of ARS and ALP are shown in the scatter plots. b Effects of ZBTB16 knockdown and overexpression on osteogenesis in vivo. HE, Masson and COL I immunohistochemistry staining of HA/TCP. Scatter plot showing Masson staining quantification. c BRD4 knockdown and overexpression and JQ1 treatment affected the mRNA expression of ZBTB16. d BRD4 knockdown and overexpression and JQ1 treatment affected the protein expression of ZBTB16 in MSCs. Scatter plots showing the relative protein abundance of BRD4 and ZBTB16. e Representative gel of BRD4-coimmunoprecipitated proteins stained with Coomassie blue to visualize the binding of BRD4 and RPAP2. f Diagram showing different BRD4 constructs. g Co-IP experiment showing the binding of different BRD4 constructs with RPAP2. h Effects of RPAP2 knockdown, RPAP2 knockdown and BRD4 overexpression, RPAP2 overexpression, BRD4 overexpression and BRD4 ΔET overexpression on the protein abundance of BRD4, ZBTB16, and RPAP2 in MSCs. Scatter plots showing the protein abundance of BRD4, ZBTB16 and RPAP2. The statistical data are represented as the means ± SEMs, n = 9, *P < 0.05, **P < 0.01, ***P < 0.005, ****P < 0.001
Fig. 6
Fig. 6
BRD4 navigates the translocation of the RPAP2-Pol II complex to SEs and drives ZBTB16 transcription. a Co-IP experiment showing the binding of RPAP2 and RPB1. b Immunofluorescence showing the effects of RPAP2 knockdown, leptomycin B pretreatment prior to RPAP2 knockdown and JQ1 treatment on the subcellular distribution of RPAP2 and RPB1 in MSCs. cf Western blot analysis of protein fractions showing the distribution of RPB1, BRD4 and RPAP2 in the cytoplasm, nucleus and chromatin. Tubulin, lamin A/C and histone 3 were the internal controls for proteins in the cytoplasm, nucleus and chromatin, respectively (c). Scatter plots showing the respective abundances of RPB1 (d), BRD4 (e) and RPAP2 (f) in different protein extracts. g ChIP-seq signal traces showing POL II binding to ZBTB16 in NC or OB group MSCs. h Location of ChIP‒qPCR primers for ZBTB16. i ChIP‒qPCR analysis showing POL II occupancy on ZBTB16 in NC and OB group MSCs. j ChIP‒qPCR analysis showing the effects of JQ1 treatment, leptomycin B and leptomycin B pretreatment prior to RPAP2 knockdown on POL II occupancy on ZBTB16 in MSCs. The statistical data are represented as the means ± SEMs, n = 9, *P < 0.05, **P < 0.01, ***P < 0.005, ****P < 0.001
Fig. 7
Fig. 7
BRD4 and RPAP2 promote ZBTB16 transcriptional pause release and elongation by synergistically regulating RPB1 CTD phosphorylation. a ChIP‒qPCR analysis showing the relative levels of pSer5 of the RPB1 CTD on ZBTB16 in NC and OB group MSCs. b ChIP‒qPCR analysis showing the relative levels of pSer2 of the RPB1 CTD on ZBTB16 in NC and OB group MSCs. ce Western blot analysis of pSer5 and pSer2 in the cytoplasm, nucleus and chromatin (c). Scatter plots showing the relative levels of pSer5 (d) and pSer2 (e) in different protein extract fractions. f ChIP‒qPCR analysis showing the effects of RPAP2 knockdown, BRD4 knockdown and JQ1 treatment on the relative levels of pSer5 of the RPB1 CTD on ZBTB16 in MSCs. g ChIP‒qPCR analysis showing the effects of RPAP2 knockdown, BRD4 knockdown and JQ1 treatment on the relative levels of pSer2 of the RPB1 CTD on ZBTB16 in MSCs. h DNase-seq signal traces showing the accessibility of ZBTB16 chromatin at different time points during osteogenic differentiation. Shadows show the constituent SE enhancers targeting ZBTB16. i Dual-luciferase reporter assays showing the effects of RPAP2 knockdown, BRD4 knockdown and JQ1 treatment on the transcriptional activity of the constituent SE enhancers targeting ZBTB16 in MSCs. j Dual-luciferase reporter assays showing the effects of BRD4 and BRD4 ΔET overexpression on the transcriptional activity of the constituent SE enhancers targeting ZBTB16 in MSCs. The statistical data are represented as the means ± SEMs, n = 9, *P < 0.05, **P < 0.01, ***P < 0.005, ****P < 0.001
Fig. 8
Fig. 8
Targeting ZBTB16 protects against low bone mass and impaired bone repair in Brd4fl/fl Prx1-cre mice and OP models. a Immunoblot analysis of ZBTB16 protein expression in different organs of the Brd4fl/fl and Brd4fl/fl Prx1-cre mice. b Scatter plot showing the relative protein abundance of ZBTB16. c Diagram of rAAV9-ZBTB16 tail vein injection in mice with calvarial and femoral defects. d Immunoblot analysis showing the expression of neon green in different organs of the Brd4fl/fl Prx1-cre mice injected with rAAV9-ZBTB16 or the vector control. e Fluorescence image of the Brd4fl/fl Prx1-cre mice injected with rAAV9-ZBTB16. f Micro-CT analysis showing the calvarial and femoral defects of the Brd4fl/fl Prx1-cre mice treated with rAAV9-ZBTB16 or the rAAV9 vector control injection. g ARS and ALP staining of osteogenic differentiating MSCs extracted from the Brd4fl/fl Prx1-cre mice treated with rAAV9-ZBTB16 or rAAV9 vector control injection. Quantification of ARS and ALP is shown in the scatter plots. h Immunofluorescence showing the expression of BRD4 and ZBTB16 in femurs of the sham and OVX mice. i Workflow of rAAV9-ZBTB16 injection to treat the OVX mice. j Micro-CT analysis of the OVX mice treated with rAAV9-ZBTB16 or the rAAV9 vector control injection, and the trabecular bones were 3D reconstructed. Bone morphometric analysis was performed, and the parameters included BV/TV, Tb. Th, Tb. N, Tb. Sp and Ct. Th. The statistical data are represented as the means ± SEMs, n = 9 (n = 5 in j), *P < 0.05, **P < 0.01, ***P < 0.005, ****P < 0.001

Similar articles

Cited by

References

    1. Salhotra A, Shah HN, Levi B, Longaker MT. Mechanisms of bone development and repair. Nat. Rev. Mol. Cell Biol. 2020;21:696–711. doi: 10.1038/s41580-020-00279-w. - DOI - PMC - PubMed
    1. Wang R, Wang Y, Zhu L, Liu Y, Li W. Epigenetic regulation in mesenchymal stem cell aging and differentiation and osteoporosis. Stem Cells Int. 2020;2020:8836258. doi: 10.1155/2020/8836258. - DOI - PMC - PubMed
    1. Whyte WA, et al. Master transcription factors and mediator establish super-enhancers at key cell identity genes. Cell. 2013;153:307–319. doi: 10.1016/j.cell.2013.03.035. - DOI - PMC - PubMed
    1. Brown JD, et al. BET bromodomain proteins regulate enhancer function during adipogenesis. Proc. Natl Acad. Sci. USA. 2018;115:2144–2149. doi: 10.1073/pnas.1711155115. - DOI - PMC - PubMed
    1. Zhao Y, et al. MyoD induced enhancer RNA interacts with hnRNPL to activate target gene transcription during myogenic differentiation. Nat. Commun. 2019;10:5787. doi: 10.1038/s41467-019-13598-0. - DOI - PMC - PubMed