. 2023 Jun 6;14(1):3303.
doi: 10.1038/s41467-023-38429-1.

Chromatin alternates between A and B compartments at kilobase scale for subgenic organization

Affiliations

Chromatin alternates between A and B compartments at kilobase scale for subgenic organization

Hannah L Harris et al. Nat Commun. .

Abstract

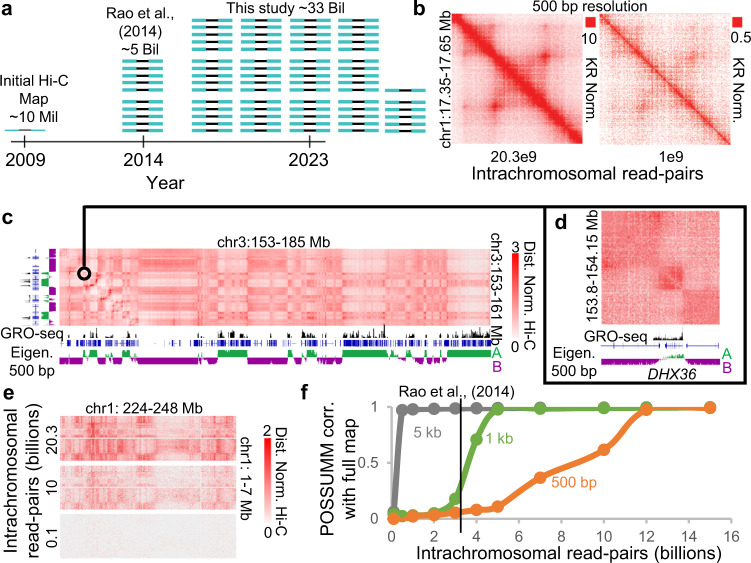
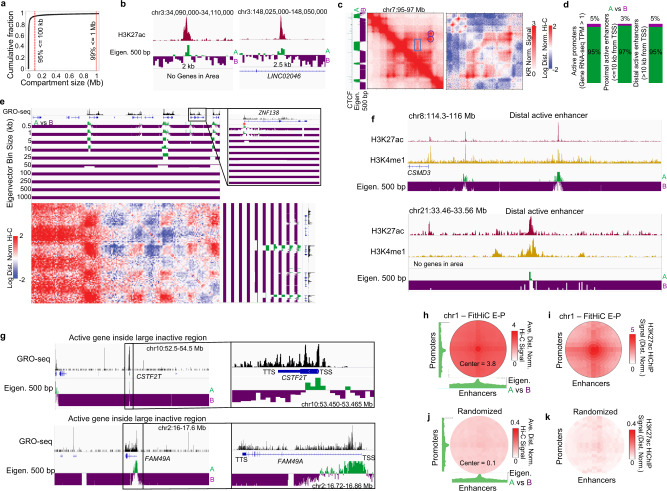
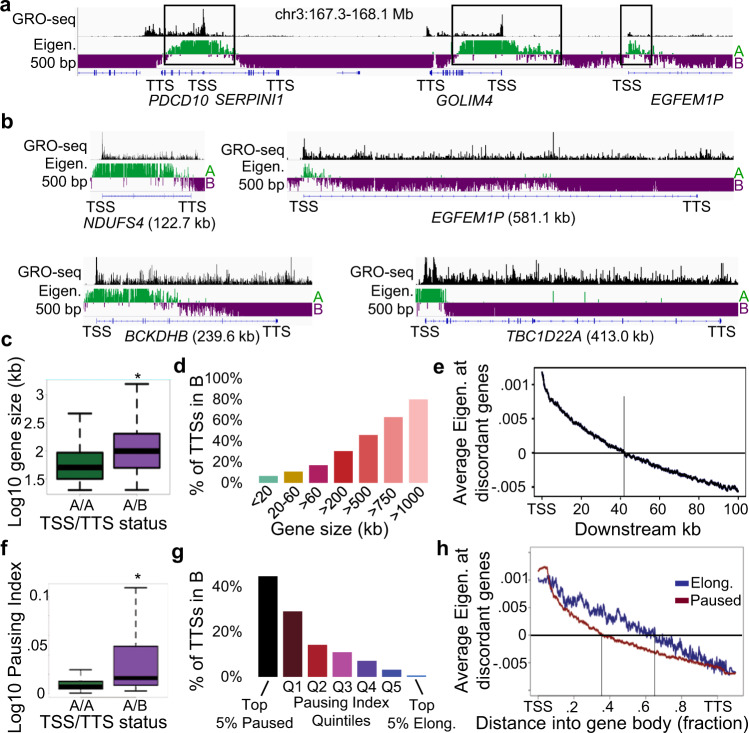
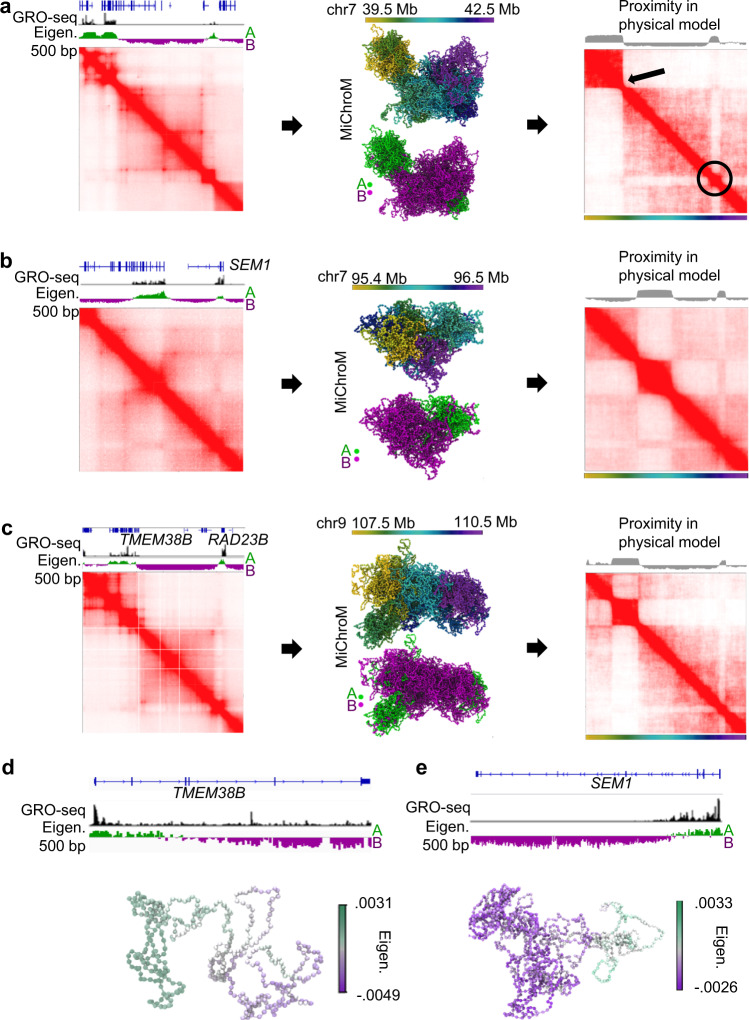
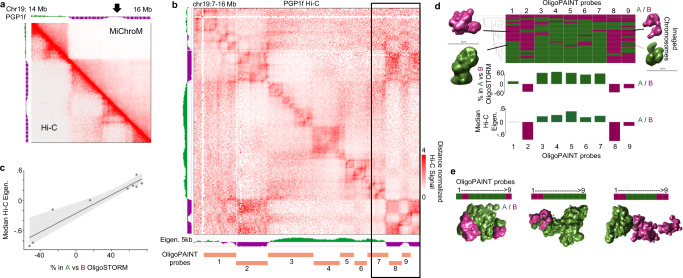
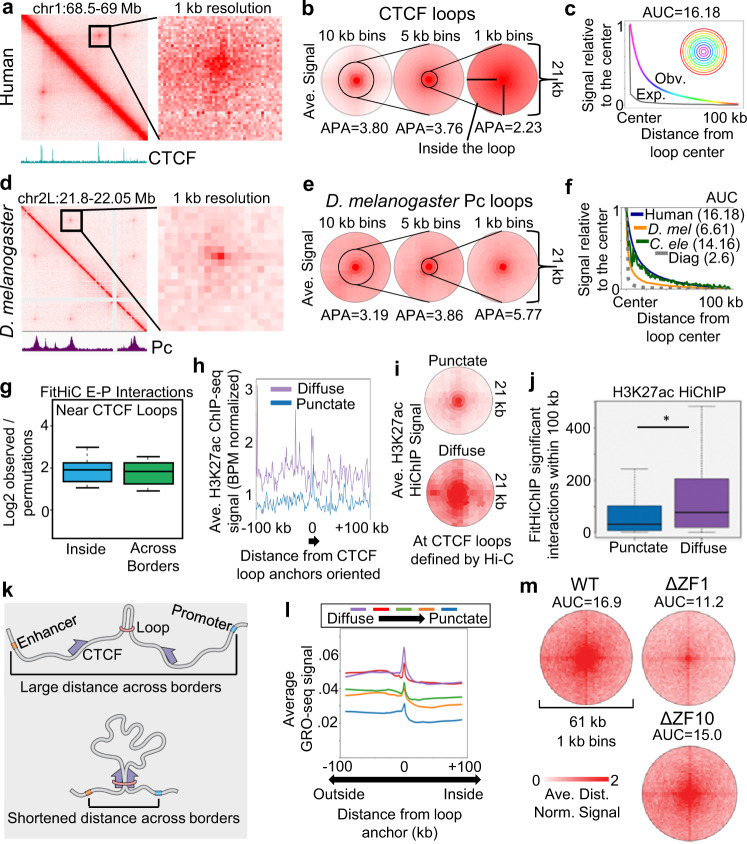
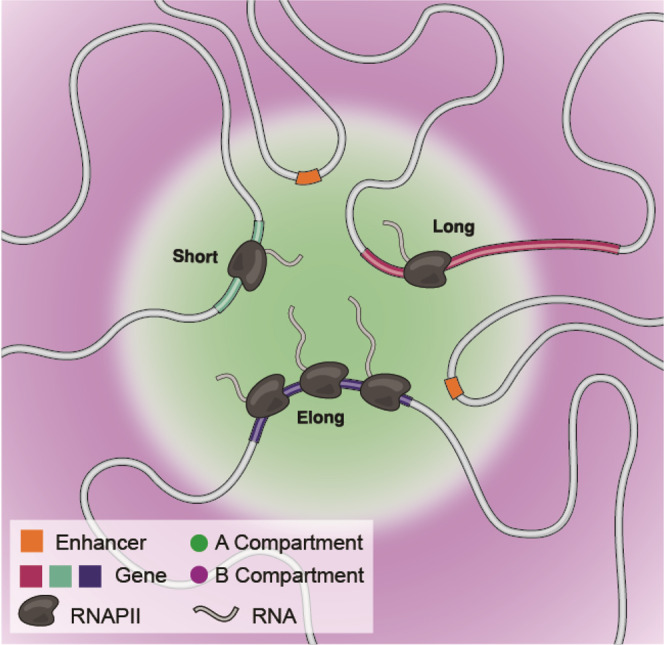
Nuclear compartments are prominent features of 3D chromatin organization, but sequencing depth limitations have impeded investigation at ultra fine-scale. CTCF loops are generally studied at a finer scale, but the impact of looping on proximal interactions remains enigmatic. Here, we critically examine nuclear compartments and CTCF loop-proximal interactions using a combination of in situ Hi-C at unparalleled depth, algorithm development, and biophysical modeling. Producing a large Hi-C map with 33 billion contacts in conjunction with an algorithm for performing principal component analysis on sparse, super massive matrices (POSSUMM), we resolve compartments to 500 bp. Our results demonstrate that essentially all active promoters and distal enhancers localize in the A compartment, even when flanking sequences do not. Furthermore, we find that the TSS and TTS of paused genes are often segregated into separate compartments. We then identify diffuse interactions that radiate from CTCF loop anchors, which correlate with strong enhancer-promoter interactions and proximal transcription. We also find that these diffuse interactions depend on CTCF's RNA binding domains. In this work, we demonstrate features of fine-scale chromatin organization consistent with a revised model in which compartments are more precise than commonly thought while CTCF loops are more protracted.


Conflict of interest statement

The authors declare no competing interests.

Figures

Fig. 1
Fig. 1. By combining ultra-deep Hi-C and POSSUMM, we generated a fine map of nuclear compartmentalization achieving 500 bp resolution.
a Schematic representing the total mapped read-pairs in the current study compared to earlier published Hi-C studies. b Example locus showing Hi-C signal in 500 bp bins in our full map with 20.3 billion intrachromosomal read-pairs (left) and when read-pairs are subsampled to 1 billion (right). Scales are set to be proportional to sequencing depth. c Example of compartment interactions in a Hi-C map identified by the eigenvector (Eigen.) in 500 bp bins (bottom track). The black track displays transcription measured by GRO-seq. The black square represents the region shown in Fig. 1d. Scales represent distance normalized Hi-C. d Zoomed in view of a compartment domain. e Long-range Hi-C signal displaying how sequencing depth impacts the visibility of the long-range compartmental checkerboard pattern. f Correlation of the eigenvector in the full map compared to various sequencing depths. The black line indicates the number of intra-chromosomal read pairs in the published GM12878 dataset. Source data are provided as a Source Data file.
Fig. 2
Fig. 2. Nearly all active TSSs and enhancers localize to kilobase-scale A compartments.
a Cumulative fraction of compartment domain sizes when identified at 500 bp resolution. b Examples of small compartment intervals. c Example of a compartmental interval smaller than an inside a CTCF loop. Observed and distance-normalized maps are shown to highlight the compartment interactions. Circles highlight loops that encompass the compartment interaction pattern indicated by a rectangle. CTCF ChIP-seq and eigenvector are shown on the side. d Percentage of active gene promoters, proximal enhancers, and distal enhancers assigned to A (green) or B (purple) compartment intervals when identified by the 500 bp compartment eigenvector. Source data are provided as a Source Data file. e Example of small compartment intervals only identifiable at high-resolution (red asterisks). Log transformed and distance normalized Hi-C map is shown alongside the eigenvector tracks at various bin sizes. f Examples of active enhancers denoted by H3K27ac and H3K4me1 signal localizing to the A compartment and surrounded by the B compartment. g Examples of active promoters denoted by GRO-seq signal localizing to the A compartment and surrounded by B compartment intervals. h Average eigenvector (green tracks) and Hi-C signal at promoters and enhancers identified by FitHiC. i Average H3K27ac HiChIP signal at those same loci. j Average Hi-C and k H3K27ac HiChIP signal at the same promoters and enhancers, but they are randomly assigned to each other. Color intensity scales on (j) and (k) are 10-fold lower to highlight the lack of signal even at this lower range.
Fig. 3
Fig. 3. Many genes exhibit discordant compartmentalization.
a, b Examples of genes of various sizes where the TSS is in the A compartment while the TTS is in the B compartment. GRO-seq signal is shown as an indicator of the gene’s transcription status. Black rectangles indicate regions of TSSs that reside in the A compartment. c Sizes of genes with concordant (labeled A/A & green) or discordant (labeled A/B & purple) compartments. * indicates p < 2.2e-16 two-sided Wilcoxon Rank Sum, n = 6021 (AA) and 510 (AB). Source data are provided as a Source Data file. d Percentage of TTSs that localize to the B compartment for genes of various sizes that have the TSS in the A compartment. Source data are provided as a Source Data file. e Average profile of the eigenvector at discordant genes. The vertical line indicates the distance where the average eigenvector value equals zero. f Pausing Index of genes with concordant (labeled A/A & green) or discordant (labeled A/B & purple) compartments. * indicates p < 2.2e-16 two-sided Wilcoxon Rank Sum, n = 6021 (AA) and 510 (AB). Source data are provided as a Source Data file. g Percentage of TTS that localize to the B compartment for genes with different pausing statuses and have the TSS in A. Source data are provided as a Source Data file. h Scaled average profiles of the compartment eigenvector for elongating (blue) or paused (red) discordant genes. The vertical line indicates the distance where the average eigenvector value equals zero.
Fig. 4
Fig. 4. Computational modeling of chromatin segments with kilobase-scale compartments.
a–c Examples of simulated chromatin segments for chr7: 39.5–42.5 Mb, chr7: 95.4–96.5 Mb and chr9: 107.5–110.5 Mb. Each segment is shown with the experimental Hi-C map (left) and a representation of the structures (middle) that were used to build the simulated distance map (right) at 1 kb resolution. The circle and line indicate compartmental features near the diagonal captured by the simulation. d, e Examples modeling genes with discordant compartments are shown for TMEM38B in chromosome 9 and SEM1 in chromosome 7.
Fig. 5
Fig. 5. Ambiguous Hi-C compartment intervals have high heterogeneity.
a Hi-C map compared to MiChroM in PGP1f cells. Arrow indicates a locus with ambiguous eigenvector values, which MiChroM had difficulty predicting. b Distance normalized Hi-C map of PGP1f cells, with the imaged segments denoted. Rectangle highlights the section modeled by MiChroM. c Median eigenvector within each imaged segment (y-axis) compared to the relative percent of images where that location was in A vs. B by OligoSTORM (x-axis). The line represents a linear fit, R2 = 0.91, while the shaded area is a fit encompassing all data points. d The imaging-based compartment status in single chromosomes. Heatmap represents the A or B designation of each imaged segment (columns) based on spatial and volumetric features of individual chromosomes in single cells (rows). On the sides are representative images of the corresponding genomic segments. Below are the percentage of individual chromosomes where the imaging reflects A vs. B compartment segments compared to the median eigenvector. Source data are provided as a Source Data file. e Representative images of the entire region colored by the A/B designation of each imaged segment. MichroM model parameters are included in Source Data.
Fig. 6
Fig. 6. Diffuse CTCF loops are dependent on RNA-binding domains.
a Example of broad signal enrichment near CTCF loops when binned at 1 kb. The CTCF ChIP-seq signal is shown below. b Average signal at CTCF loops when binned at 10, 5, or 1 kb, centered on convergent CTCF anchors. c Average Hi-C signal in 1 kb bins at each radial distance away from the CTCF loop anchors (rainbow). The average signal of the diagonal decay is shown for reference (gray) to estimate interactions due to polymeric distance. AUC = area under the curve. d Example of punctate signal enrichment at Pc loops in D. melanogaster when binned at 1 kb. The Pc ChIP-seq signal is shown below. e Average signal at D. melanogaster Pc loops when binned at 10, 5, or 1 kb. f Average Hi-C signal in 1 kb bins at each radial distance away from human CTCF loop anchors (blue) vs. D. melanogaster Pc loops (orange) and C. elegans X-chromosome loops (green). The average signal at the C. elegans Hi-C diagonal is shown for reference (gray). AUC = area under the curve. g Enrichment vs. random regions of Fit-Hi-C enhancer-promoter interactions within 100 kb of loops inside the loop (blue) or crossing over loop boundaries (green). Boxplots represent the median and the interquartile range (IQR), with whiskers representing 1.5*IQR. n = 18,948 EP FitHiC interactions, 2559 CTCF loops, and 10 permutations. Average H3K27ac ChIP-seq (h) and HiChIP (i) signal near diffuse vs. punctate CTCF loop anchors. j Number of H3K27ac HiChIP significant interactions determined by FitHiChIP near punctate (n = 1076) vs. diffuse (n = 1086) CTCF loop anchors. Boxplots represent the median and the interquartile range (IQR), with whiskers representing 1.5*IQR. * indicated p < 2.2e-16 Wilcoxon sum-rank test. k Diagram of how CTCF loops can shorten distances between enhancers (orange) and promoters (blue) even when both are located outside of the loop. l Average GRO-seq signal at CTCF loop anchors and neighboring loci for loops divided into five distinct diffuse categories. m Average Hi-C signal in WT (left), ΔZF1 (right), or ΔZF10 (bottom) CTCF mutants at CTCF loops. AUC area under the curve.
Fig. 7
Fig. 7. Sub-genic compartmentalization organizes the human genome.
Diagram depicting localization of active enhancers and TSSs to the A compartment, while TTSs are oriented to the B compartment dependent on size and transcription elongation status.

Similar articles

Cited by

References

    1. Lieberman-Aiden E, et al. Comprehensive mapping of long-range interactions reveals folding principles of the human genome. Science. 2009;326:289–293. doi: 10.1126/science.1181369. - DOI - PMC - PubMed
    1. Rao SSP, et al. A 3D map of the human genome at kilobase resolution reveals principles of chromatin looping. Cell. 2014;159:1665–1680. doi: 10.1016/j.cell.2014.11.021. - DOI - PMC - PubMed
    1. Kalluchi A, et al. Considerations and caveats for analyzing chromatin compartments. Front. Mol. Biosci. 2023;10:1168562. doi: 10.3389/fmolb.2023.1168562. - DOI - PMC - PubMed
    1. Belaghzal H, et al. Liquid chromatin Hi-C characterizes compartment-dependent chromatin interaction dynamics. Nat. Genet. 2021;53:367–378. doi: 10.1038/s41588-021-00784-4. - DOI - PMC - PubMed
    1. Krietenstein N, et al. Ultrastructural details of mammalian chromosome architecture. Mol. Cell. 2020;78:554–565.e557. doi: 10.1016/j.molcel.2020.03.003. - DOI - PMC - PubMed

Publication types

MeSH terms