. 2023 Jun 6;14(1):3281.
doi: 10.1038/s41467-023-38834-6.

Native American ataxia medicines rescue ataxia-linked mutant potassium channel activity via binding to the voltage sensing domain

Affiliations

Native American ataxia medicines rescue ataxia-linked mutant potassium channel activity via binding to the voltage sensing domain

Rían W Manville et al. Nat Commun. .

Abstract

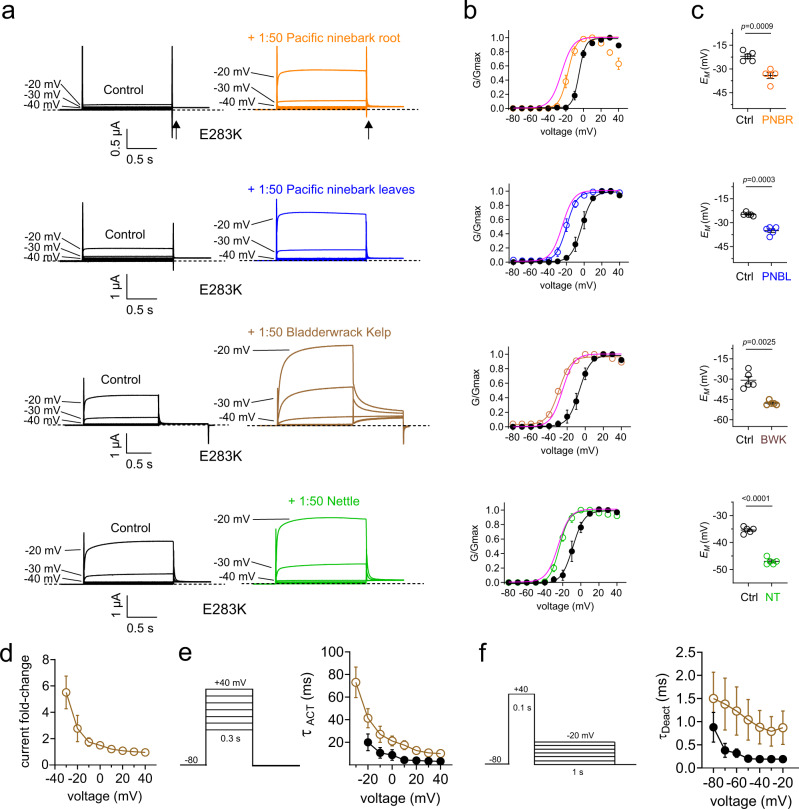
There are currently no drugs known to rescue the function of Kv1.1 voltage-gated potassium channels carrying loss-of-function sequence variants underlying the inherited movement disorder, Episodic Ataxia 1 (EA1). The Kwakwaka'wakw First Nations of the Pacific Northwest Coast used Fucus gardneri (bladderwrack kelp), Physocarpus capitatus (Pacific ninebark) and Urtica dioica (common nettle) to treat locomotor ataxia. Here, we show that extracts of these plants enhance wild-type Kv1.1 current, especially at subthreshold potentials. Screening of their constituents revealed that gallic acid and tannic acid similarly augment wild-type Kv1.1 current, with submicromolar potency. Crucially, the extracts and their constituents also enhance activity of Kv1.1 channels containing EA1-linked sequence variants. Molecular dynamics simulations reveal that gallic acid augments Kv1.1 activity via a small-molecule binding site in the extracellular S1-S2 linker. Thus, traditional Native American ataxia treatments utilize a molecular mechanistic foundation that can inform small-molecule approaches to therapeutically correcting EA1 and potentially other Kv1.1-linked channelopathies.


Conflict of interest statement

The authors declare no competing interests.

Figures

Fig. 1
Fig. 1. Plant extracts used by Kwakwaka’wakw for ataxia therapy enhance activation at negative potentials of wild-type Kv1.1 and/or Kv1.2.
Error bars indicate SEM. n indicates number of biologically independent oocytes. At least 2 batches of oocytes were used per experiment. Statistical comparisons by two tailed paired t-test. Dashed lines indicate zero current line here and throughout. Source data are available. a Plants from which extracts were used by Kwakwaka’wakw for ataxia therapy. Photo credits: Urtica dioica (nettle)—Bo Abbott (used by permission). Physocarpus capitatus (Pacific ninebark)—senior author (GWA). Fucus gardneri (Bladderwrack kelp)—Steve Lonhart/NOAA MBNMS—http://sanctuarymonitoring.org/photos/photo_info.php?photoID=3530&search=algae&s=260&page=14, Public Domain, https://commons.wikimedia.org/w/index.php?curid=40550057. b Mean traces for Kv1.1 or Kv1.2 as indicated expressed in oocytes in the absence (Control) or presence of 1:50 dilution extracts as indicated. Scale bars lower left for each pair of traces; voltage protocol upper inset; n = 4–6 per group. c Mean normalized tail current (G/Gmax) for traces as in b. Kv1.1 nettles (n = 5); Kv1.2 nettles (n = 6); Kv1.1 1:50 pacific ninebark root (n = 5); Kv1.2 pacific ninebark root (n = 5); Kv1.1 pacific ninebark leaves (n = 5); Kv1.2 pacific ninebark leaves (n = 5); Kv1.1 bladderwrack kelp (n = 4); Kv1.2 bladderwrack kelp (n = 6). d Mean unclamped oocyte membrane potential for oocytes as in B; Kv1.1 nettles (n = 5 per; p = 0.0211); Kv1.2 nettles (n = 6; p = 0.0007); Kv1.1 pacific ninebark root (n = 5; p = 0.0028); Kv1.2 pacific ninebark root (n = 5; p = 0.0915); Kv1.1 pacific ninebark leaves (n = 5; p = 0.0201); Kv1.2 pacific ninebark leaves (n = 5; p = 0.4156); Kv1.1 bladderwrack kelp (n = 4; p = 0.0097); Kv1.2 bladderwrack kelp (n = 6; p = 0.0009).
Fig. 2
Fig. 2. Identification of constituents of plant extracts used by Kwakwaka’wakw for ataxia therapy that enhance activation at negative potentials of wild-type Kv1.1.
Error bars indicate SEM. n indicates number of biologically independent oocytes. At least 2 batches of oocytes were used per experiment. Statistical comparisons by two tailed paired t-test. Source data are available. a Mean traces for Kv1.1 expressed in oocytes in the absence (Control) or presence of plant extract components (100 µM) as indicated. Scale bars lower left for each trace; voltage protocol upper inset; n = 4–6 per group. Arrow indicates where tail current measurements are made for G/Gmax plots. Highlighted traces (magenta or cyan) show same-voltage pulses in each pair for comparison. b Close up of tail currents from a; arrow indicates where tail current measurements are made for G/Gmax plots. c Mean normalized tail current (G/Gmax) for traces as in a. 100 µM catechin hydrate (n = 5); 100 µM gallic acid (n = 5); 100 µM cytisine (n = 5); 100 µM kaempferol (n = 4); 100 µM quercetin (n = 4); 100 µM rutin (n = 4); 100 µM tannic acid (n = 5). d Mean unclamped oocyte membrane potential for oocytes as in a; 100 µM catechin hydrate (n = 5; p = 0.3238); 100 µM gallic acid (n = 5; p = 0.0002); 100 µM cytisine (n = 5; p = 0.0349); 100 µM kaempferol (n = 4; p = 0.6042); 100 µM quercetin (n = 4; p = 0.9438); 100 µM rutin (n = 4; p = 0.065); 100 µM tannic acid (n = 5; <0.0001).
Fig. 3
Fig. 3. Identification of other medicinal plant extracts with wild-type Kv1.1 function-enhancing activity.
Error bars indicate SEM. n indicates number of biologically independent oocytes. At least 2 batches of oocytes were used per experiment. Statistical comparisons by two tailed paired t-test. Source data are available. a Mean traces for Kv1.1 expressed in oocytes in the absence (Control) or presence of plant extract (1:50) as indicated. Scale bars lower left for each trace; voltage protocol as in Fig. 2; n = 4–8 per group. Arrow indicates where tail current measurements are made for G/Gmax plots. Highlighted traces (magenta or cyan) show same-voltage pulses in each pair for comparison. b Mean normalized tail current (G/Gmax) for traces as in a. White oak bark (n = 5); cramp bark (n = 5); wild cherry bark (n = 5); white willow bark (n = 5); Saphora japonica (n = 6); 100 µM oxymatrine (n = 8). c Mean unclamped oocyte membrane potential for oocytes as in a; white oak bark (n = 5; <0.0001); cramp bark (n = 5; p = 0.4146); wild cherry bark (n = 5; p = 0.0346); white willow bark (n = 5; <0.0001); Saphora japonica (n = 6; p = 0.0002); 100 µM oxymatrine (n = 8; p = 0.1720).
Fig. 4
Fig. 4. Dose responses for wild-type Kv1.1 and Kv1.2 modulation by gallic acid, tannic acid and rutin.
Error bars indicate SEM. n indicates number of biologically independent oocytes. At least 2 batches of oocytes were used per experiment. Source data are available. a Mean shift in voltage dependence of activation (ΔV0.5activation) vs. [gallic acid] for Kv1.1 (n = 5) and Kv1.2 (n = 5), quantified from traces similar to those shown in Fig. 2. b Mean change in unclamped oocyte membrane potential (ΔEM) vs. [gallic acid] for oocytes expressing Kv1.1 (n = 5) and Kv1.2 (n = 5). c Mean ΔV0.5activation vs. [tannic acid] for Kv1.1 and Kv1.2, quantified from traces similar to those shown in Fig. 2. Kv1.1 tannic acid concentrations 0.01 µM (n = 5); 0.1 µM (n = 12); 1 µM (n = 12); 3 µM (n = 5); 10 µM (n = 7); 50 µM (n = 7); 100 µM (n = 7); 250 µM (n = 6); 500 µM (n = 7); Kv1.2 (n = 5). d Mean change in unclamped oocyte membrane potential (ΔEM) vs. [tannic acid] for oocytes expressing Kv1.1 or Kv1.2. Kv1.1 tannic acid concentrations 0.01 µM (n = 5); 0.1 µM (n = 12); 1 µM (n = 12); 3 µM (n = 5); 10 µM (n = 7); 50 µM (n = 7); 100 µM (n = 7); 250 µM (n = 6); 500 µM (n = 7); Kv1.2 (n = 5). e Mean ΔV0.5activation vs. [rutin] for Kv1.1 (n = 5) and Kv1.2 (n = 5), quantified from traces similar to those shown in Fig. 2. f Mean change in unclamped oocyte membrane potential (ΔEM) vs. [rutin] for oocytes expressing Kv1.1 (n = 5) and Kv1.2 (n = 5).
Fig. 5
Fig. 5. Specific plant extracts used by Kwakwaka’wakw for ataxia therapy enhance activation of EA1-linked Kv1.1/Kv1.1-L155P channels.
Error bars indicate SEM. n indicates number of biologically independent oocytes. At least 2 batches of oocytes were used per experiment. Statistical comparisons by two-tailed paired t-test. Source data are available. a Schematic of location of EA1 sequence variants on Kv1.1 studied herein. b Mean traces for Kv1.1/Kv1.1-L155P channels expressed by co-injection of 50/50 wild-type/L155P Kv1.1 cRNA in oocytes in the absence (Control) or presence of 1:50 dilution extracts as indicated. Scale bars lower left for each trace; voltage protocol as in Fig. 2; n = 5 per group. c Mean normalized tail current (G/Gmax) for traces as in b; n = 5 per group. d Mean unclamped oocyte membrane potential for oocytes as in b; bladderwrack kelp (n = 5; <0.0001); pacific ninebark root (n = 5; p = 0.0046); pacific ninebark leaves (n = 5; p = 0.0036); nettle (n = 5; p = 0.0348).
Fig. 6
Fig. 6. Specific plant extracts used by Kwakwaka’wakw for ataxia therapy enhance activation of EA1-linked Kv1.1-E283K channels.
Error bars indicate SEM. n indicates number of biologically independent oocytes. At least 2 batches of oocytes were used per experiment. Statistical comparisons by two-tailed paired t-test. Source data are available. a Mean traces for Kv1.1-E283K channels expressed by injection of 100% Kv1.1-E283K cRNA in oocytes in the absence (Control) or presence of 1:50 dilution extracts as indicated (only −80 to −20 mV range shown, for clarity). Scale bars lower left for each trace; voltage protocol as in Fig. 2; n = 5 per group. Arrow indicates where tail current measurements are made for G/Gmax plots. b Mean normalized tail current (G/Gmax) for traces as in a; n = 5 per group. Control wild-type Kv1.1 G/V curves (magenta) from Fig. 1 overlaid for comparison. c Mean unclamped oocyte membrane potential for oocytes as in a; pacific ninebark root (n = 5; p = 0.0009); pacific ninebark leaves (n = 5; p = 0.0003); bladderwrack kelp (n = 5; p = 0.0025); nettle (n = 5; <0.0001). d Mean Kv1.1-E283K peak prepulse current fold-change vs. voltage induced by bladderwrack kelp (1:50); n = 5. e Mean activation rate (ΤACT) vs. voltage for Kv1.1-E283K in bath solution (black) vs. 1:50 bladderwrack kelp (brown). Left, voltage protocol; n = 5. f Mean deactivation rate (ΤDeact) vs. voltage for Kv1.1-E283K in bath solution (black) vs. 1:50 bladderwrack kelp (brown). Left, voltage protocol; n = 8.
Fig. 7
Fig. 7. Gallic acid enhances activation of EA1-linked Kv1.1/Kv1.1-E283K channels.
Error bars indicate SEM. n indicates number of biologically independent oocytes. At least 2 batches of oocytes were used per experiment. Statistical comparisons by two-tailed paired t-test. Source data are available. a Mean traces (only −80 to −20 mV range shown, for clarity) for EA1-linked mutant Kv1.1 channels as indicated, expressed by co-injection of 50/50 wild-type/mutant Kv1.1 cRNA in oocytes in the absence (Control) or presence of gallic acid (1 µM). Scale bars lower left for each trace; voltage protocol as in Fig. 2; n = 5 per group. b Mean peak current (measured during prepulse) from traces as in a; n = 5 per group. c Mean normalized tail current (G/Gmax) for Kv1.1/Kv1.1-E283K traces as in a; n = 5 per group. Control wild-type Kv1.1 GV curve (magenta) from Fig. 1 overlaid for comparison. d Mean unclamped oocyte membrane potential for oocytes as in a; Kv1.1/Kv1.1-G311D (n = 5; p = 0.1067); Kv1.1/Kv1.1-L328V (n = 5; p = 0.0131); Kv1.1/Kv1.1-V408A (n = 5; p = 0.0289); Kv1.1/Kv1.1-E283K (n = 4; p = 0.0005).
Fig. 8
Fig. 8. Gallic acid enhances activation of EA1-linked Kv1.1/Kv1.1L155P channels.
Error bars indicate SEM. n indicates number of biologically independent oocytes. At least 2 batches of oocytes were used per experiment. Statistical comparisons by one-way ANOVA with post-hoc Tukey HSD. Source data are available. a Mean traces for Kv1.1/Kv1.1-L155P channels expressed by co-injection of 50/50 wild-type/L155P Kv1.1 cRNA in oocytes in the absence (Control) or presence of gallic acid (1 µM). Scale bars lower left; voltage protocol as in Fig. 2; n = 9 per group. Upper insets show close-up of tail currents. Magenta traces show same-voltage pulses in each current family for comparison. b Mean traces for Kv1.1/Kv1.1-L155P channels expressed in oocytes in the absence (Control) or presence of gallic acid (1–100 µM). Scale bars lower left; voltage protocol as in Fig. 2; n = 9 per group. c Mean normalized tail current (G/Gmax) from traces as in a and b; n = 9 per group. d Mean unclamped oocyte membrane potential for oocytes as in a and b; 1 µM gallic acid (n = 9; p = 0.0002); 10 µM gallic acid (n = 9; p < 0.0001); 100 µM gallic acid (n = 9; p < 0.0001).
Fig. 9
Fig. 9. Tannic acid enhances activation of EA1-linked Kv1.1-E283K channels.
Error bars indicate SEM. n indicates number of biologically independent oocytes. At least 2 batches of oocytes were used per experiment. Statistical comparisons by two-tailed paired t-test. Source data are available. a Mean traces for Kv1.1-E283K channels expressed by co-injection of 100% Kv1.1-E283K cRNA in oocytes in the absence (Control) or presence of tannic acid (1 µM). Scale bars lower left; voltage protocol lower inset; n = 6 per group. Upper insets show close-up of tail currents. Cyan, traces at −20 mV highlighted for ease of comparison. Cyan traces show same-voltage pulses in each current family for comparison. b Mean normalized tail current (G/Gmax) from traces as in a; n = 6 per group. Control wild-type Kv1.1 G/V curve (red) from Fig. 1 overlaid for comparison. c Mean unclamped oocyte membrane potential for oocytes as in a (n = 6; p = 0.0003). d Mean Kv1.1-E283K current fold-change vs. voltage induced by tannic acid (1 µM); n = 5. e Mean activation rate (ΤACT) vs. voltage for Kv1.1-E283K in bath solution (black) vs. tannic acid (1 µM) (purple). Voltage protocol, upper inset; n = 5. f Mean traces using voltage protocol indicated (upper inset) for Kv1.1-E283K in bath solution (black) vs. tannic acid (1 µM) (purple) to illustrate the dramatic current enhancing effects at −30 mV; n = 6.
Fig. 10
Fig. 10. Gallic acid binding to the Kv1.1 S1-S2 linker is predicted to reorientate S4 arginines towards the interior of the VSD.
Error bars indicate SEM. n indicates number of biologically independent oocytes. At least 2 batches of oocytes were used per experiment. Statistical comparisons by two-tailed paired t-test. Source data are available. a Left, SwissDock results for unbiased docking of gallic acid (GA; blue) to the AlphaFold-predicted structure of Kv1.1. VSD helices are individually labeled and colored. b Sequence alignment of human Kv1.1, 2, 3 and 4 partial S1 and S1-S2 linker with notable Kv1.2-specific sequence differences colored (cyan vs. red). *Residues are identical at this position in all sequences in the alignment; “:”, conserved substitutions at this position in all sequences in the alignment; “.”, semi-conserved substitutions at this position in all sequences in the alignment. Arrows, S1/2 linker residues predicted by docking and/or MD simulations to interact with gallic acid. c SwissDock unbiased docking of gallic acid to Kv1.2 produced no GA docking to the VSD. Notable Kv1.2-specific sequence differences from Panel B are colored red and labeled. d SwissDock unbiased docking of gallic acid to Kv1.2 with mutations made to S1-S2 linker residues as indicated in cyan to match Kv1.1 residues (Kv1.2*) produced no GA docking to the VSD. e Starting configuration for MD simulations of gallic acid (red) binding to the Kv1.1 VSD structure predicted by Alphafold. Residues interacting with gallic acid are shown in licorice representation colored by atom (C, silver; N, blue; O, red; H, white). Waters in the solvation shell of gallic acid are rendered as lines colored by atom. Dashed lines, H-bond like configurations. f Predominant localization of gallic acid for the last 200 ns of the 300-ns MD trajectory. Residues present in the neighborhood of gallic acid at least 50% of the time the last 200 ns of the MD trajectory are shown in licorice representation colored by atom. Waters in the solvation shell of gallic acid are rendered as lines colored by atom. Dashed lines, H-bond like configurations. g Superimposed configuration snapshots from the end of the wild-type Kv1.1 simulations with and without gallic acid. The VSD backbone is shown in ribbon representation (orange, with gallic acid bound; tan, without gallic acid). For the gallic acid-bound simulation system, the first three S4 arginines (R236, R239, and R242) and gallic acid are shown in licorice representation colored by atom (C, silver; N, blue; O, red; H, white). The S4 arginines in the simulation system without gallic acid are colored green. h A similar superimposed configuration as in panel g, shown for the Kv1.1–3 M simulation system. i Mean traces for Kv1.1-I182S,E192I,K195N (termed Kv1.1–3 M) channels expressed in oocytes in the absence (Control) or presence of gallic acid (1–100 µM). Scale bars central; voltage protocol as in Fig. 2; n = 5 per group. Magenta traces show same-voltage pulses in each pair for comparison. j Mean peak current (measured during prepulse) from traces as in i; n = 5 per group. k Mean peak current fold-change vs. [gallic acid] for A1-3M traces in i and wild-type Kv1.1; 0.1 µM gallic acid (n = 5; p = 0.0085); 1 µM gallic acid (n = 5; p = 0.0066); 10 µM gallic acid (n = 5; p = 0.0085); 100 µM gallic acid (n = 5; p = 0.0074). l Mean change in unclamped oocyte membrane potential (ΔEM) vs. [gallic acid] for oocytes expressing A1-3M (as in i) or wild-type Kv1.1; n = 5.

Similar articles

Cited by

References

    1. Fiske D. The ataxias; a review. Arch. Intern. Med. (Chic.) 1949;83:593–607. doi: 10.1001/archinte.1949.00220350003001. - DOI - PubMed
    1. Browne DL, et al. Episodic ataxia/myokymia syndrome is associated with point mutations in the human potassium channel gene, KCNA1. Nat. Genet. 1994;8:136–140. doi: 10.1038/ng1094-136. - DOI - PubMed
    1. Hasan, S. M. & D’Adamo, M. C. In GeneReviews((R)) (eds. Adam, M. P. et al.) (University of Washington, Seattle, 1993). - PubMed
    1. Zerr P, Adelman JP, Maylie J. Episodic ataxia mutations in Kv1.1 alter potassium channel function by dominant negative effects or haploinsufficiency. J. Neurosci. 1998;18:2842–2848. doi: 10.1523/JNEUROSCI.18-08-02842.1998. - DOI - PMC - PubMed
    1. Zerr P, Adelman JP, Maylie J. Characterization of three episodic ataxia mutations in the human Kv1.1 potassium channel. FEBS Lett. 1998;431:461–464. doi: 10.1016/S0014-5793(98)00814-X. - DOI - PubMed

Publication types

Substances

Supplementary concepts