. 2023 Jun 6;14(1):3168.
doi: 10.1038/s41467-023-38832-8.

Drug screening at single-organoid resolution via bioprinting and interferometry

Affiliations

Drug screening at single-organoid resolution via bioprinting and interferometry

Peyton J Tebon et al. Nat Commun. .

Abstract

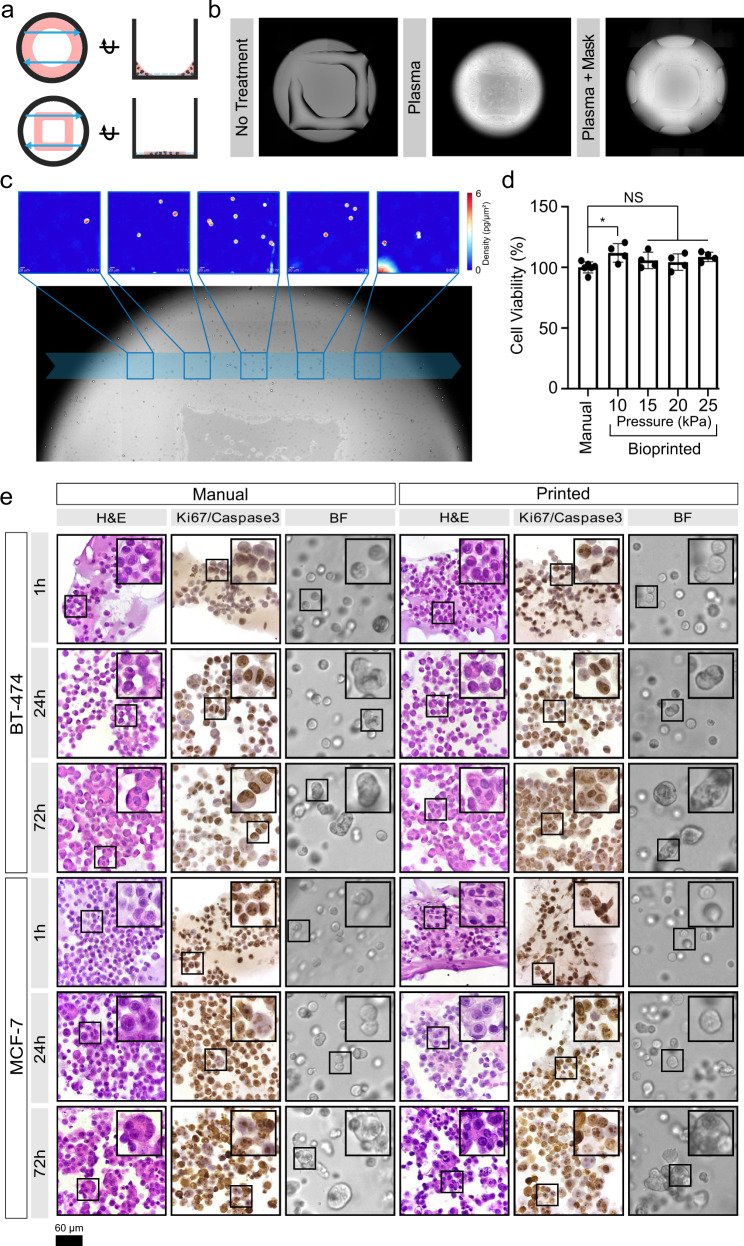
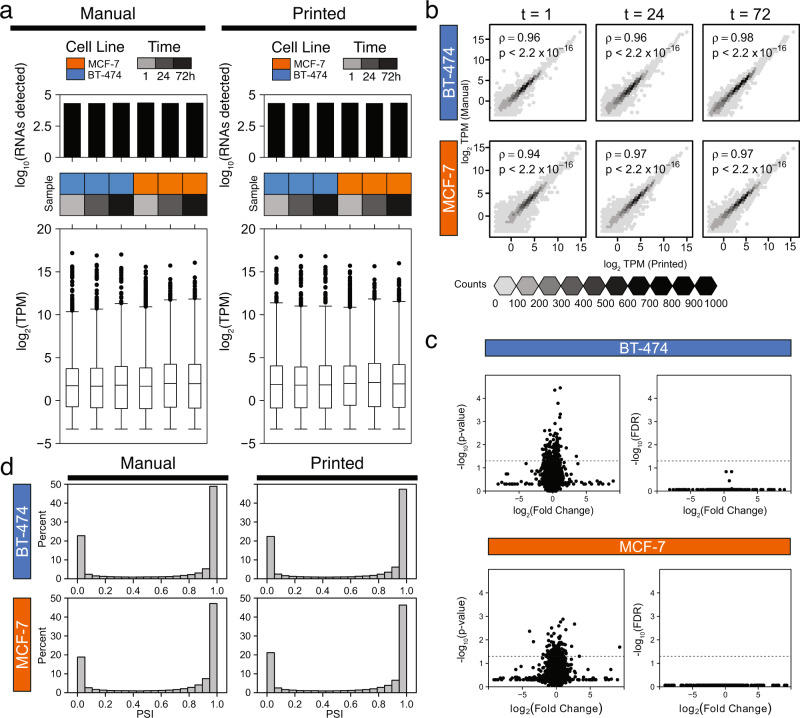
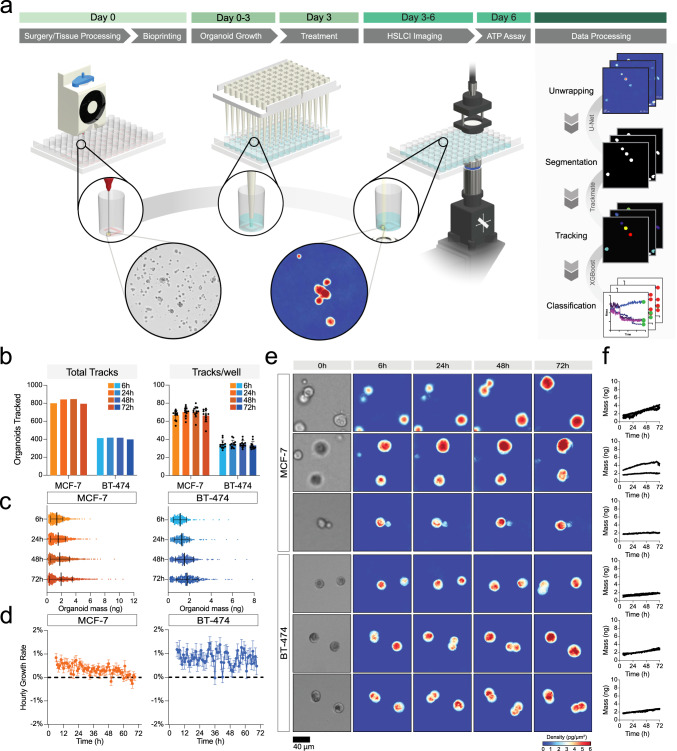
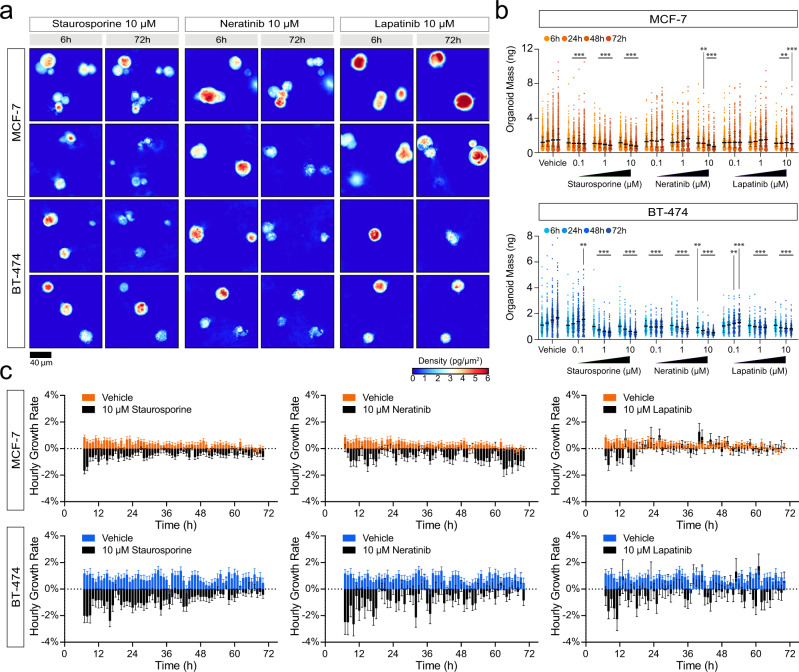
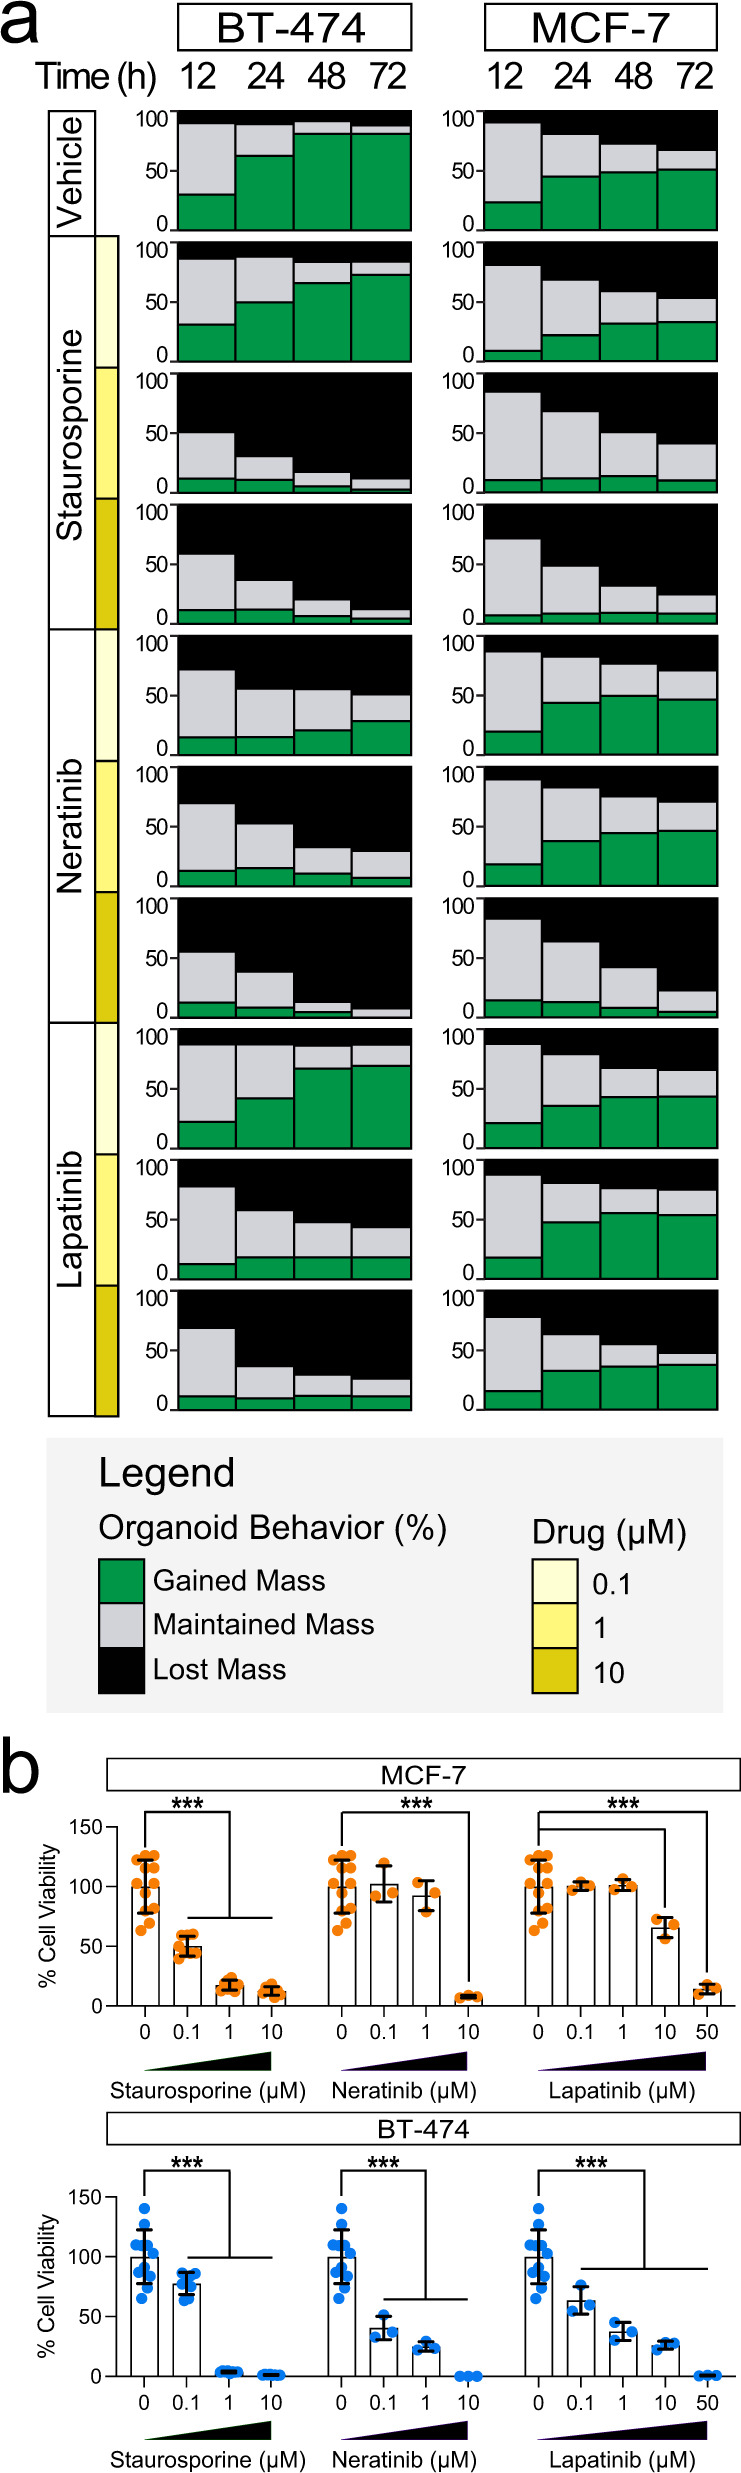
High throughput drug screening is an established approach to investigate tumor biology and identify therapeutic leads. Traditional platforms use two-dimensional cultures which do not accurately reflect the biology of human tumors. More clinically relevant model systems such as three-dimensional tumor organoids can be difficult to scale and screen. Manually seeded organoids coupled to destructive endpoint assays allow for the characterization of treatment response, but do not capture transitory changes and intra-sample heterogeneity underlying clinically observed resistance to therapy. We present a pipeline to generate bioprinted tumor organoids linked to label-free, time-resolved imaging via high-speed live cell interferometry (HSLCI) and machine learning-based quantitation of individual organoids. Bioprinting cells gives rise to 3D structures with unaltered tumor histology and gene expression profiles. HSLCI imaging in tandem with machine learning-based segmentation and classification tools enables accurate, label-free parallel mass measurements for thousands of organoids. We demonstrate that this strategy identifies organoids transiently or persistently sensitive or resistant to specific therapies, information that could be used to guide rapid therapy selection.


Conflict of interest statement

A.S., P.T., B.W., and N.T. are inventors on patent application PCT/US2021/062264 filed by The Regents Of The University Of California covering some aspects of the bioprinting process. A.S. and P.C.B. are the founders and owners of Icona BioDx. All other authors declare no competing interests.

Figures

Fig. 1
Fig. 1. Bioprinting enables the seeding of Matrigel-encapsulated cells optimized for efficient HSLCI.
a Schematic of wells with mini-rings (top) and mini-squares (bottom) relative to HSLCI imaging path (blue arrows). The top views (left) demonstrate that transitioning from rings to squares increases the area of material in the HSLCI imaging path. The side views (right) show that organoids in the square geometry align to a single focal plane better than organoids in a ring. b Plasma treatment of the well plate prior to printing optimizes hydrogel construct geometry. Bioprinting Matrigel onto untreated glass (left) generates thick ( ~ 200 µm) constructs that decreases the efficiency of organoid tracking by increasing the number of clusters out of the focal plane. Whole well plasma treatment (middle) increases the hydrophilicity of all well surfaces causing the Matrigel to spread thin ( ~ 50 µm) over the surface; however, the increased hydrophilicity also draws bioink up the walls of the well. Plasma treatment with a well mask facilitates the selective treatment of a desired region of the well (right). This leads to optimal constructs with a uniform thickness of approximately 75 µm across the imaging path. c Individual organoids can be tracked over time across imaging modalities. Five representative HSLCI images are traced to the imaging path across a brightfield image. d Cell viability of printed versus manually seeded MCF-7 cells in a Matrigel-based bioink, 1 h after plating. Data are presented as mean values ± SD. A one-way ANOVA was performed (n = 4, p = 0.0605) with post-hoc Bonferroni’s multiple comparisons test to compare all bioprinted conditions against the manually seeded control. Adjusted p-values were 0.0253, 0.6087, >0.9999, 0.1499 for print pressures 10, 15, 20, 25 kPa, respectively. e H&E staining shows the development of multicellular organoids over time regardless of seeding method. The prevalence and size of multicellular structures increases with culture time. Ki-67/Caspase-3 staining demonstrates that most cells remain in a proliferative state throughout culture time. While some apoptotic cells were observed in organoids cultured for 72 hours, the majority of cells show strong Ki-67 positivity. Ki-67 is stained brown, and Caspase-3 is stained pink. Scale bar is 60 µm. Source data is provided as a Source Data file.
Fig. 2
Fig. 2. Bioprinting does not significantly alter transcriptomes.
a Distributions of total number of RNAs detected (above) and RNA abundance (below) measured as transcripts per million (TPM) are similar between manually seeded (left) and bioprinted (right) cells. n = 30,544 transcripts were assessed across two independent experiments. Boxplot centers represent each median, edges of the boxes represent the 25th and 75th quartiles, whiskers represent the range of the data, and individually plotted points are outliers greater than 1.5 times the interquartile range from the median. b Spearman’s rank correlation of RNA abundance of manually seeded and bioprinted cell line 3D models at three time points (t = 1, 24, and 72 hours post-seeding). We found strong correlations between RNA abundance in manually seeded and bioprinted cells for both cell lines. p-values are derived from a two-tailed test of correlation between paired samples. c Volcano plots of paired, two-tailed t-test results comparing the RNA abundance of manually seeded and bioprinted MCF-7 and BT-474 with unadjusted p-values (left) and false discovery rate (FDR) adjusted p-values (right). No transcripts were preferentially expressed based upon the seeding method for either cell line (n = 0 out of 30,544 genes, FDR < 0.05, t-test). d Distribution of percent spliced in (PSI) exons are similarly distributed among BT-474 (top) and MCF-7 (bottom). The distribution of PSI is similar between manually seeded (left) and bioprinted (right) cells. PSI of 1 indicates that the exon is exclusively included, while a PSI of 0 indicates that the exon is exclusively excluded. Source data is provided as a Source Data file.
Fig. 3
Fig. 3. Bioprinting enables single-organoid tracking with high-speed live cell interferometry.
a General schematic of the pipeline. Extrusion-based bioprinting is used to deposit single-layer Matrigel constructs into a 96-well plate (Day 0). Organoid model establishment and growth (Day 0–3) can be monitored through brightfield imaging. After treatment (Day 3), the well plate is transferred to the high-speed live cell interferometer for phase imaging (Day 3–6). Coherent light illuminates the bioprinted construct and a phase image is obtained. Organoids are tracked up to three days using the HSLCI and changes in organoid mass are measured to observe response to treatment. b Total number of tracks (left) and mean number ± SD of tracks per well (right) for cell clusters from each cell line at four time points (t = 6, 24, 48, and 72 hours after treatment). The total number of tracks across replicate wells treated with vehicle (1% DMSO) was 921 for MCF-7 (n = 12 wells) and 438 for BT-474 (n = 12 wells) c Mass distribution at four time points (t = 6, 24, 48, and 72 hours after treatment). Black bars represent the mean with error bars representing the standard deviation. Mean and standard deviation calculated based on n = 804, 855, 859, 803 for MCF-7 and n = 421, 420, 423, 402 for BT-474 cell clusters at t = 6, 24, 48, and 72 hours, respectively. d Hourly growth rate (percent mass change per hour) of tracked MCF-7 (left) and BT-474 (right) cultured in 1% DMSO. Data presented as mean ± SEM for each hour calculated based on growth rate data for n = 921 MCF-7 and n = 438 BT-474 tracked clusters. e Representative HSLCI-acquired phase images at four time points (t = 6, 24, 48, and 72 hours after treatment). Brightfield images taken immediately before treatment are shown on the left. f Calculated mass of each representative organoid over time. Source data is provided as a Source Data file.
Fig. 4
Fig. 4. HSLCI enables high throughput, longitudinal drug response profiling of 3D models of cancer.
a Representative HSLCI-acquired phase images of MCF-7 and BT-474 grown in 3D and treated with 10 µM staurosporine, 10 µM neratinib, and 10 µM lapatinib. b Each bar represents the mass distribution at 6-, 24-, 48-, and 72 hours post-treatment (left to right). Black horizontal bars represent the median with error bars representing the interquartile range of the distribution. Sample sizes, summary statistics, and exact p-values for each condition are available in Supplementary Table 3. Statistical significance was assessed using Kruskal-Wallis tests. For samples with p-values lower than 0.05, we performed two-tailed Mann-Whitney U-tests against the vehicle control at the respective time points. p < 0.05 is denoted by *, p < 0.01 is denoted by **, and p < 0.001 is denoted by ***. c Hourly growth rates, calculated as percent mass change per hour, are compared between organoids treated with 10 µM staurosporine and vehicle, 10 µM neratinib and vehicle, and 10 µM lapatinib and vehicle. Data are presented as mean growth rate ± SEM. Growth rate data is derived from n = 921, 592, 249, and 292 MCF-7 cell clusters and n = 438, 299, 110, and 127 BT-474 clusters treated with the vehicle, 10 µM staurosporine, 10 µM neratinib, and 10 µM lapatinib, respectively. Source data is provided as a Source Data file.
Fig. 5
Fig. 5. HSLCI enables identification of resistant and sensitive 3D cluster subpopulations and discerns response to treatment earlier than endpoint assays.
a Plots showing the percentage of tracked clusters in each condition that gain (green) or lose (black) more than 10% of their initial mass 12, 24, 48, 72 hours after treatment. b Relative viability of treated wells in HSLCI-imaged plates of bioprinted MCF-7 and BT-474, determined by endpoint ATP release assays. Bars represent the mean and error bars represent the standard deviation. Each point represents the normalized luminescence signal from independent replicates. n = 12 and n = 11 wells were treated with the vehicle control for MCF-7 and BT-474, respectively. For treated wells in both experiments, N = 8 replicates were screened for each concentration of staurosporine and N = 3 replicate wells were screened for each concentration of both lapatinib and neratinib. Statistical significance was assessed using a two-tailed, unpaired t-test with Welch’s correction. p < 0.05 is denoted by *, p < 0.01 is denoted by **, and p < 0.001 is denoted by ***. Exact p-values are reported in Supplementary Table 6. Source data is provided as a Source Data file.

References

    1. Letai A. Functional precision cancer medicine-moving beyond pure genomics. Nat. Med. 2017;23:1028–1035. doi: 10.1038/nm.4389. - DOI - PubMed
    1. Bhola PD, et al. High-throughput dynamic BH3 profiling may quickly and accurately predict effective therapies in solid tumors. Sci. Signal. 2020;13:eaay1451. doi: 10.1126/scisignal.aay1451. - DOI - PMC - PubMed
    1. Phan N, et al. A simple high-throughput approach identifies actionable drug sensitivities in patient-derived tumor organoids. Commun. Biol. 2019;2:1–11. doi: 10.1038/s42003-019-0305-x. - DOI - PMC - PubMed
    1. Vlachogiannis G, et al. Patient-derived organoids model treatment response of metastatic gastrointestinal cancers. Science. 2018;359:920–926. doi: 10.1126/science.aao2774. - DOI - PMC - PubMed
    1. Guillen, K. P. et al. A human breast cancer-derived xenograft and organoid platform for drug discovery and precision oncology. Nat. Cancer3, 232–250 (2022). - PMC - PubMed

Publication types