

Perivascular network segmentations derived from high-field MRI and their implications for perivascular and parenchymal mass transport in the rat brain
- PMID: 37280246
- PMCID: PMC10244386
- DOI: 10.1038/s41598-023-34850-0
Perivascular network segmentations derived from high-field MRI and their implications for perivascular and parenchymal mass transport in the rat brain
Abstract
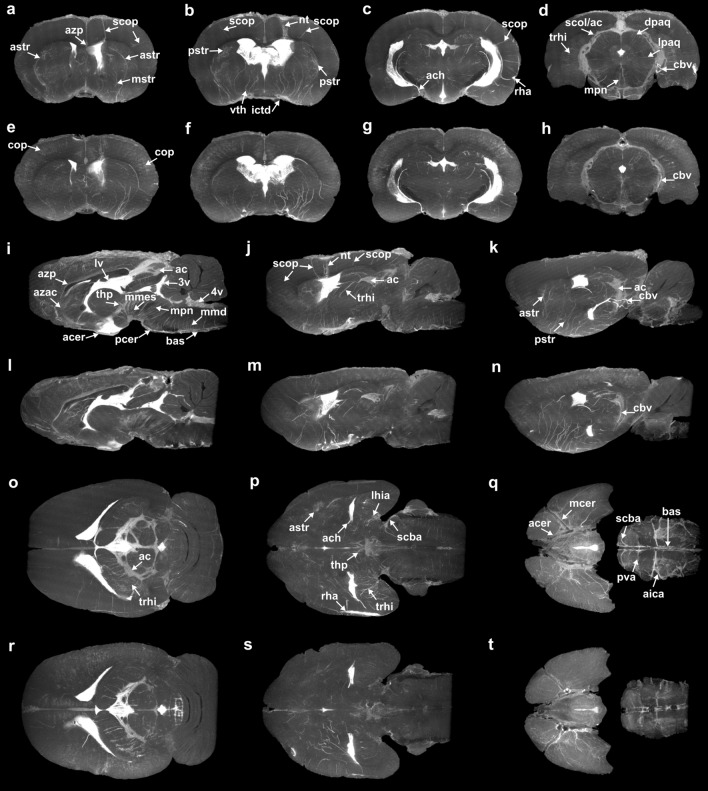
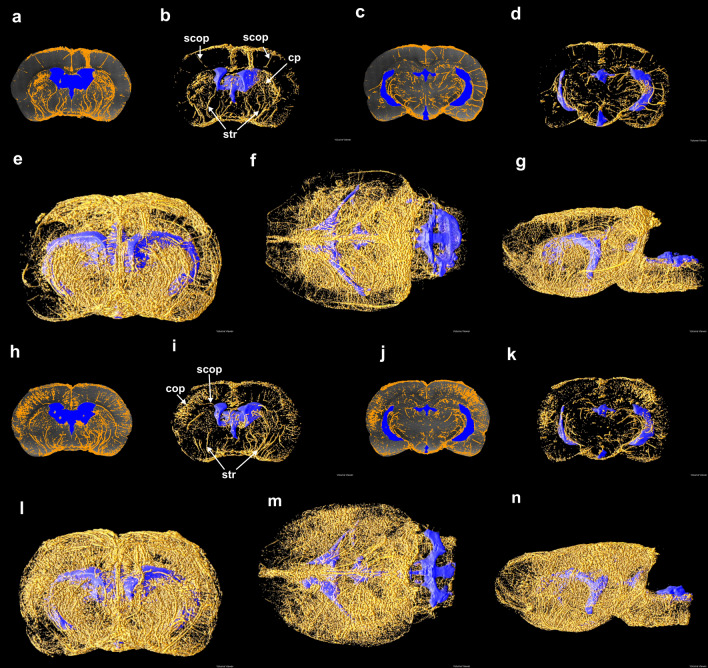
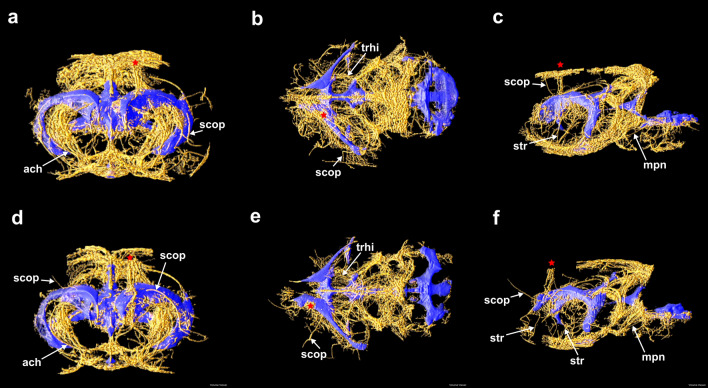
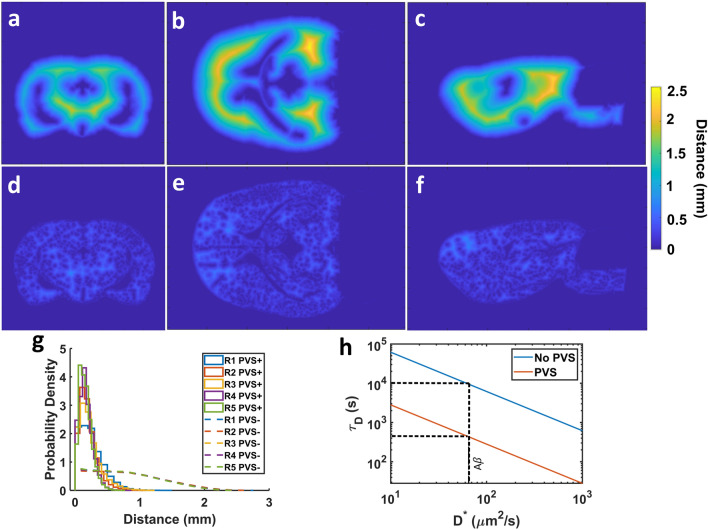
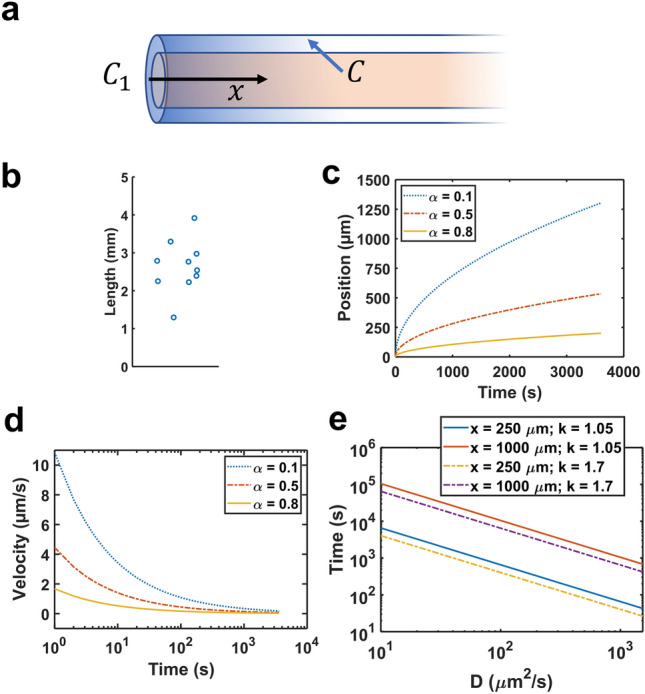
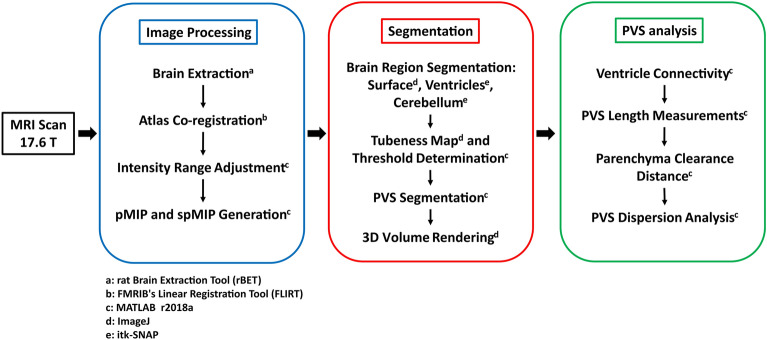
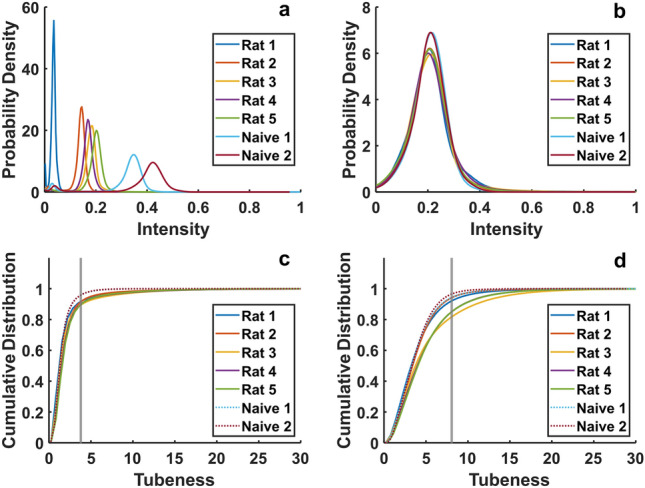
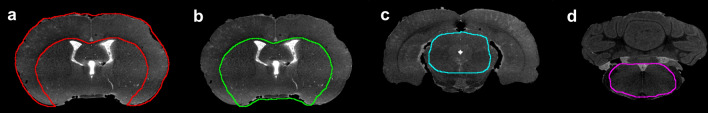
A custom segmentation workflow was applied to ex vivo high-field MR images of rat brains acquired following in vivo intraventricular contrast agent infusion to generate maps of the perivascular spaces (PVS). The resulting perivascular network segmentations enabled analysis of perivascular connections to the ventricles, parenchymal solute clearance, and dispersive solute transport within PVS. Numerous perivascular connections between the brain surface and the ventricles suggest the ventricles integrate into a PVS-mediated clearance system and raise the possibility of cerebrospinal fluid (CSF) return from the subarachnoid space to the ventricles via PVS. Assuming rapid solute exchange between the PVS and CSF spaces primarily by advection, the extensive perivascular network decreased the mean clearance distance from parenchyma to the nearest CSF compartment resulting in an over 21-fold reduction in the estimated diffusive clearance time scale, irrespective of solute diffusivity. This corresponds to an estimated diffusive clearance time scale under 10 min for amyloid-beta which suggests that the widespread distribution of PVS may render diffusion an effective parenchymal clearance mechanism. Additional analysis of oscillatory solute dispersion within PVS indicates that advection rather than dispersion is likely the primary transport mechanism for dissolved compounds greater than 66 kDa in the long (> 2 mm) perivascular segments identified here, although dispersion may be significant for smaller compounds in shorter perivascular segments.
© 2023. The Author(s).
Conflict of interest statement
The authors declare no competing interests.
Figures
Similar articles
-
MRI of Whole Rat Brain Perivascular Network Reveals Role for Ventricles in Brain Waste Clearance.Sci Rep. 2019 Aug 7;9(1):11480. doi: 10.1038/s41598-019-44938-1. Sci Rep. 2019. PMID: 31391474 Free PMC article.
-
Pulsatile flow drivers in brain parenchyma and perivascular spaces: a resistance network model study.Fluids Barriers CNS. 2018 Jul 16;15(1):20. doi: 10.1186/s12987-018-0105-6. Fluids Barriers CNS. 2018. PMID: 30012159 Free PMC article.
-
Sizes and shapes of perivascular spaces surrounding murine pial arteries.Fluids Barriers CNS. 2023 Jul 17;20(1):56. doi: 10.1186/s12987-023-00454-z. Fluids Barriers CNS. 2023. PMID: 37461047 Free PMC article.
-
Imaging perivascular space structure and function using brain MRI.Neuroimage. 2022 Aug 15;257:119329. doi: 10.1016/j.neuroimage.2022.119329. Epub 2022 May 21. Neuroimage. 2022. PMID: 35609770 Free PMC article. Review.
-
A critical guide to the automated quantification of perivascular spaces in magnetic resonance imaging.Front Neurosci. 2022 Dec 14;16:1021311. doi: 10.3389/fnins.2022.1021311. eCollection 2022. Front Neurosci. 2022. PMID: 36590285 Free PMC article. Review.
Cited by
-
Lipid-siRNA conjugate accesses perivascular transport and achieves durable knockdown throughout the central nervous system.bioRxiv [Preprint]. 2024 Sep 7:2024.06.09.598079. doi: 10.1101/2024.06.09.598079. bioRxiv. 2024. PMID: 38915549 Free PMC article. Preprint.
-
Quantitation of regional distribution of antibodies in rat brain following systemic and intra-CNS administration.J Cereb Blood Flow Metab. 2025 May 13:271678X251333536. doi: 10.1177/0271678X251333536. Online ahead of print. J Cereb Blood Flow Metab. 2025. PMID: 40357752 Free PMC article.
-
Regulation of brain fluid volumes and pressures: basic principles, intracranial hypertension, ventriculomegaly and hydrocephalus.Fluids Barriers CNS. 2024 Jul 17;21(1):57. doi: 10.1186/s12987-024-00532-w. Fluids Barriers CNS. 2024. PMID: 39020364 Free PMC article. Review.
-
Heterogeneous Mechanical Stress and Interstitial Fluid Flow Predictions Derived from DCE-MRI for Rat U251N Orthotopic Gliomas.Ann Biomed Eng. 2024 Nov;52(11):3053-3066. doi: 10.1007/s10439-024-03569-y. Epub 2024 Jul 24. Ann Biomed Eng. 2024. PMID: 39048699
-
Elucidating brain transport pathways and cell type-dependent gene silencing of a durable lipid-siRNA conjugate administered into cerebrospinal fluid.Nucleic Acids Res. 2025 Jun 20;53(12):gkaf600. doi: 10.1093/nar/gkaf600. Nucleic Acids Res. 2025. PMID: 40598893 Free PMC article.
References
Publication types
MeSH terms
Substances
LinkOut - more resources
Full Text Sources
Medical
Research Materials
