. 2023 Nov;44(11):2282-2295.
doi: 10.1038/s41401-023-01108-4. Epub 2023 Jun 6.

ATF4 renders human T-cell acute lymphoblastic leukemia cell resistance to FGFR1 inhibitors through amino acid metabolic reprogramming

Affiliations

ATF4 renders human T-cell acute lymphoblastic leukemia cell resistance to FGFR1 inhibitors through amino acid metabolic reprogramming

Zi-Jian Zhang et al. Acta Pharmacol Sin. 2023 Nov.

Abstract

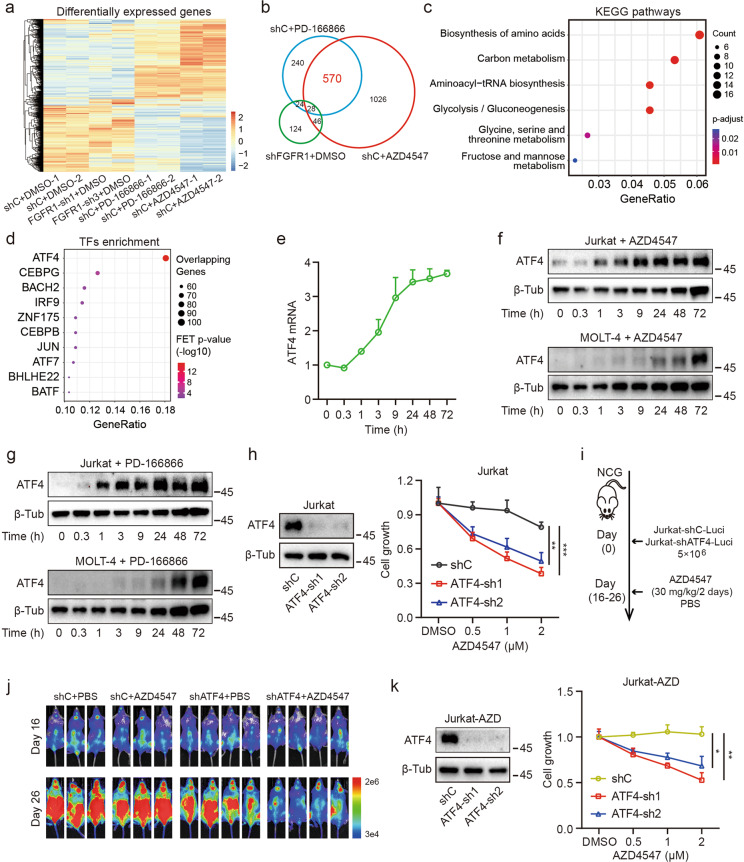
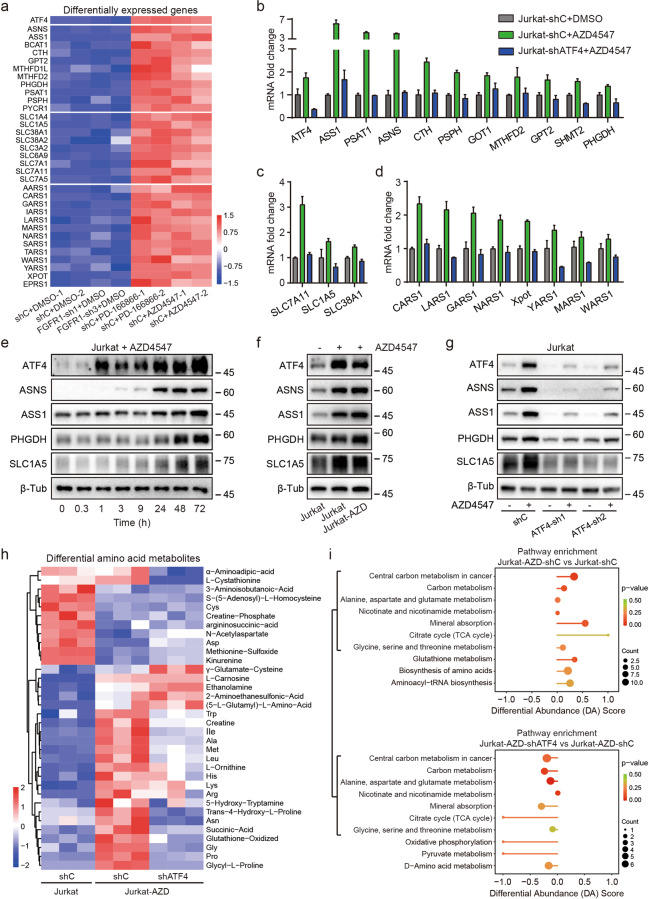
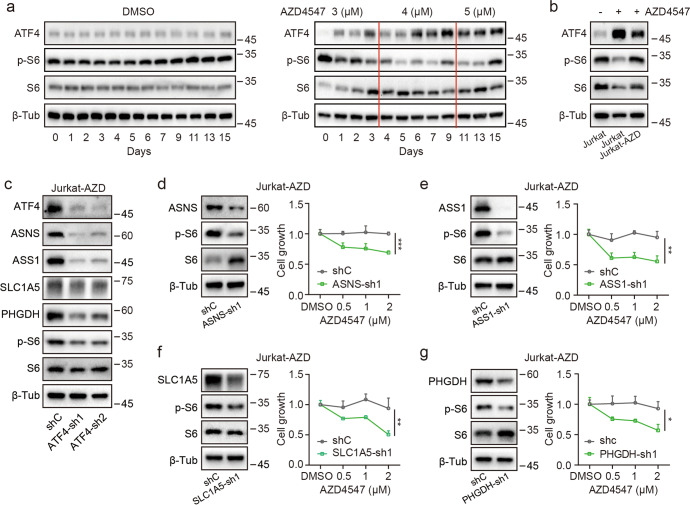
Abnormalities of FGFR1 have been reported in multiple malignancies, suggesting FGFR1 as a potential target for precision treatment, but drug resistance remains a formidable obstacle. In this study, we explored whether FGFR1 acted a therapeutic target in human T-cell acute lymphoblastic leukemia (T-ALL) and the molecular mechanisms underlying T-ALL cell resistance to FGFR1 inhibitors. We showed that FGFR1 was significantly upregulated in human T-ALL and inversely correlated with the prognosis of patients. Knockdown of FGFR1 suppressed T-ALL growth and progression both in vitro and in vivo. However, the T-ALL cells were resistant to FGFR1 inhibitors AZD4547 and PD-166866 even though FGFR1 signaling was specifically inhibited in the early stage. Mechanistically, we found that FGFR1 inhibitors markedly increased the expression of ATF4, which was a major initiator for T-ALL resistance to FGFR1 inhibitors. We further revealed that FGFR1 inhibitors induced expression of ATF4 through enhancing chromatin accessibility combined with translational activation via the GCN2-eIF2α pathway. Subsequently, ATF4 remodeled the amino acid metabolism by stimulating the expression of multiple metabolic genes ASNS, ASS1, PHGDH and SLC1A5, maintaining the activation of mTORC1, which contributed to the drug resistance in T-ALL cells. Targeting FGFR1 and mTOR exhibited synergistically anti-leukemic efficacy. These results reveal that FGFR1 is a potential therapeutic target in human T-ALL, and ATF4-mediated amino acid metabolic reprogramming contributes to the FGFR1 inhibitor resistance. Synergistically inhibiting FGFR1 and mTOR can overcome this obstacle in T-ALL therapy.

Keywords: ATF4; AZD4547; FGFR1 inhibitor; PD-166866; T-ALL; drug resistance.


Conflict of interest statement

The authors declare no competing interests.

Figures

Fig. 1
Fig. 1. FGFR1 is upregulated in T-ALL and negatively correlated with the prognosis of patients.
a Heatmap depicting 226 upregulated expressed genes in a T-ALL cohort (CNCB, HRA000122). Upregulated genes were selected with P < 0.05, log2 FoldChange > 50. b Fragments Per Kilobase Million (FPKM) of FGFR1 in a T-ALL cohort with 12 normal T cell samples (CNCB, HRA000122). c mRNA expression levels of FGFR1 from an RNA-seq data about T-ALL cohort with 7 normal bone marrow samples (GEO, GSE26713). d Relative mRNA expression of FGFR1 in T-ALL cell lines and normal T cell samples through qPCR. e Protein levels of FGFR1 in T-ALL cell lines (left) and primary T-ALL blasts (right) using Western blot, the β-Tubulin (β-Tub) was used as an internal control. f mRNA expression levels of FGFR1 in different hematopoietic malignancies, data from the Cancer Cell Line Encyclopedia (CCLE). g Event-free survival of T-ALL patients with higher or lower expression of FGFR1, data from TARGET, phs000464. h Overall survival of T-ALL patients with higher or lower expression of FGFR1, data from TARGET, phs000464. Data are mean ± SD (Two-tailed unpaired Student’s t test, *** P < 0.001).
Fig. 2
Fig. 2. FGFR1 is a potential therapeutic target in T-ALL but leukemia cells are resistant to FGFR1 inhibitors.
a, c Knockdown efficiency of FGFR1 in (a) Jurkat or (c) MOLT-4 cells. Cells were harvested at 72 h after transfection using lentivirus vectors, non-target lentivirus vector (shC) was used as the negative control. b, d Relative cell growth of (b) Jurkat or (d) MOLT-4 cells after FGFR1 knockdown, cell counting was performed on day 1, 3, and 5 respectively. e, f The relative cell growth of T-ALL cell lines and normal T cell, cell counting was performed at 72 h after treatment with different concentration gradients of FGFR1 inhibitors (e) AZD4547, and (f) PD-166866. g Cell growth of Jurkat cells after FGFR1 knockdown or AZD4547 (3 μM) treatment. h Phosphorylation of Akt and S6 in Jurkat cells after FGFR1 knockdown. Cells were harvested at 72 h after transfection using lentivirus vectors. i Phosphorylation of Akt and S6 in Jurkat cells. Cells were harvested at 72 h after AZD4547 (3 μM) treatment. j-n Jurkat cell-derived xenograft (CDX) experiment in NCG mice, 5 × 106 luciferase labeled FGFR1 knockdown Jurkat cells (Jurkat-shFGFR1) or luciferase labeled control Jurkat cells (Jurkat-shC) that generated with non-specific shRNA were injected through the tail vein. PBS, AZD4547 (30 mg/kg every 2 days), or PD-166866 (30 mg/kg every 2 days) was intraperitoneally administered from day 14 to day 28 in Jurkat-shC mice models. Mice in group of FGFR1-sh1 were generated with Jurkat-FGFR1-sh1 and treated with PBS accordingly. j Schematic outline of cell-derived xenograft (CDX). k Bioluminescent imaging of cell-derived xenograft (CDX). l Kaplan-Meier survival curves of Jurkat cell-derived xenograft mice (CDX). The endpoint was that weight loss exceeded 20% of the body weight of a similar normal animal according to guidelines of the Canadian Council on Animal Care (CCAC). m Analysis of bone marrow invasion by using anti-human CD7 antibody through flow cytometry. n Quantification of bone marrow invasion. Data are mean ± SD (Two-tailed unpaired Student’s t test, *** P < 0.001, ns = no significance).
Fig. 3
Fig. 3. ATF4 is essential for the resistance of T-ALL against FGFR1 inhibitors.
a Heatmap of the differentially expressed genes (DEGs). Jurkat-shC or Jurkat-shFGFR1 cells were treated with AZD4547 (2 μM), PD-166866 (4 μM), or DMSO for 36 h. DEGs were filtrated with P < 0.05 and |log 2 FoldChange | > 0.5. The color indicates the Z-score of different genes expression. b Venn diagram depicting the number of DEGs shared in different groups. c KEGG pathway analysis of 570 common DEGs that were shared in both AZD4547 and PD-166866 treatment groups. d Transcription factors enrichment analysis of 570 common DEGs that shared in both AZD4547 and PD-166866 treatment groups. e Time series analysis of the mRNA levels of ATF4 in Jurkat exposed to AZD4547 (2 μM) through qPCR. f, g Time series analysis of the protein levels of ATF4 in Jurkat (up) or MOLT-4 (down) exposed to (f) AZD4547 (2 μM) and (g) PD-166866 (4 μM). The β-Tubulin (β-Tub) was used as the internal control. h The protein levels of ATF4 (left) and relative cell growth (right) of Jurkat after ATF4 knockdown. Cells were treated with different concentrations of AZD4547 and cell counting was performed at 72 h after treatment. i, j Jurkat cell-derived xenograft experiment in NCG mice, 5 × 106 luciferase labeled ATF4 knockdown Jurkat cells (Jurkat-shATF4-Luci) or luciferase labeled control Jurkat cells (Jurkat-shC-Luci) were injected through the tail vein. PBS or AZD4547 (30 mg/kg every 2 days) was intraperitoneally administered from day 16 to day 26. i Schematic outline of cell-derived xenograft. j Bioluminescent imaging of Jurkat-derived xenograft. k The protein levels of ATF4 (left) and relative cell growth (right) of more resistant Jurkat cells (Jurkat-AZD) after ATF4 knockdown. Cells were treated with AZD4547 and cell counting was performed at 72 h after treatment. Data are mean ± SD (Two-tailed unpaired Student’s t test, * P < 0.05, ** P < 0.01, *** P < 0.001).
Fig. 4
Fig. 4. Expression of ATF4 is stimulated by increased chromatin accessibility combined with GCN2-mediated translational activation.
a Average ATAC-seq signal and b quantification of average ATAC-seq signal around transcription start site (TSS) in Jurkat cells after 96 h with AZD4547 (2 μM) treatment. DMSO was used as the control. n = 2. c Distribution of ATAC-seq signal in promotor, exon, intron, 3’UTR, and distal intergenic. d Top 20 significantly activated transcription factors (TFs) in each group based on RNA-seq data, the color indicates Z-scaled average TFs activity score. e Rank of motifs enriched in the region of promotor based on ATAC-seq. f Venn diagram depicting the number of common genes in different groups. the “Motifs” was the group of motifs enriched in promotor, the “RNA-seq” was the group of 570 common DEGs shared in both AZD4547 and PD-166866 groups based on RNA-seq data, the “TFs activity (Top 20)” was the group of top 20 differentially activated TFs. g Signal of Chip-seq and ATAC-seq around the chromosomal region of ATF4. h Gene Set Enrichment Analysis (GSEA) of 570 common DEGs shared in both groups of AZD4547 and PD-166866. i, k The protein levels of GCN2, p-eIF2α, eIF2α, ATF4 in Jurkat cells with (i) GCN2 knockdown and (k) PERK knockdown. Cells were harvested after 72 h with GCN2-sh1 or PERK-sh1 or non-target lentivirus vector transfection (shC) and 6 h treatment with AZD4547 (2 μM) or DMSO. HSP90 was used as the internal control. Relative cell growth of GCN2 knockdown (j), or PERK knockdown (l) Jurkat cells compared with control Jurkat cells (shC), cell counting was performed at 72 h after AZD4547 treatment. m Relative cell growth of Jurkat cells treated with AZD4547 combined SP600125. Cell counting was performed at 72 h after treatment. Data are mean ± SD (Two-tailed unpaired Student’s t test, * P < 0.05, ** P < 0.01, ns = no significance).
Fig. 5
Fig. 5. ATF4 is a crucial initiator to upregulate the metabolic genes and remodel the amino acid metabolism.
a Heatmap depicting the differentially expressed genes (DEGs) about metabolism based on RNA-seq data. The color indicates the Z-score of different genes expression. Relative mRNA levels of DEGs in the group of (b) typical kinases, (c) transporters, and (d) aminoacyl-tRNA biosynthesis after ATF4 knockdown and AZD4547 treatment. Jurkat cells were harvested for qPCR analysis at 48 h after AZD4547 (2 μM) treatment. e Time series analysis of protein levels of ATF4, ASNS, ASS1, PHGDH and SLC1A5 in Jurkat cells exposed to AZD4547 (2 μM). The β-Tubulin (β-Tub) was used as the internal control. f Protein levels of ATF4, ASNS, ASS1, PHGDH, and SLC1A5 in Jurkat and the more resistant Jurkat cells (Jurkat-AZD) with or without AZD4547 (2 μM) treatment for 48 h. g The protein levels of ATF4, ASNS, ASS1, PHGDH and SLC1A5 in ATF4 knockdown Jurkat cells (ATF4-sh1, ATF4-sh2), non-target lentivirus vector (shC) was used as the control, the cells were harvested at 48 h after AZD4547 (2 μM) treatment. h Differential amino acid metabolites of different groups through targeted metabolomics analysis. The Jurkat cells were harvested after 48 h of transfection. The color indicates the Z-score of the quantity of metabolites. i Pathway analysis of the differential amino acid metabolites. Differential abundance score depicting the average, gross transformations of all metabolites in each pathway. the score of 1 indicates all measured metabolites increase in the pathway, and -1 indicates all measured metabolites decrease in the pathway. Data are mean ± SD.
Fig. 6
Fig. 6. Targeting mTOR could overcome the resistance against FGFR1 inhibitors.
a Schematic of drug screening that AZD4547 combined with 2059 approved drugs. The Jurkat cells were treated with AZD4547 (2 μM) or each drug or a combination of these two drugs for 72 h. Cell viability was detected using CCK-8 kit. The synergistic efficiencies were calculated using the coefficient of drug interaction (CDI), CDI < 1 indicated a synergistic effect. b Target pathways enrichment analysis of 30 synergistic drugs. c List of drugs enriched in PI3K/Akt/mTOR signaling. d Synergistic inhibition effect of AZD4547 and rapamycin in Jurkat cells. The cell counting was performed at 72 h after AZD4547 and Rapamycin treatment. e Relative cell growth of Jurkat and the more resistant Jurkat cells (Jurkat-AZD) exposed to Rapamycin for 72 h. f–k Jurkat cell-derived xenograft (CDX) experiment in NCG mice, 5 × 106 luciferase labeled Jurkat cells were injected through the tail vein, AZD4547 (30 mg/kg every 2 days) or PD-166866 (30 mg/kg every 2 days) or combination of these two inhibitors was intraperitoneally administered from day 17 to day 29, the control group was treated with PBS. f Schematic of cell-derived xenograft (CDX). g Bioluminescent imaging of Jurkat-derived xenograft mice. h Total photon flux of bioluminescent of Jurkat-derived xenograft mice at day 29. i Kaplan-Meier survival curves of Jurkat-derived xenograft mice in different groups. The endpoint was that weight loss exceeded 20% of the body weight of a similar normal animal. j Analysis of bone marrow invasion using anti-human CD7 antibody through flow cytometry. k Quantification of bone marrow invasion in different groups. Data are mean ± SD (Two-tailed unpaired Student’s t test, *P < 0.05, **P  < 0.01, *** P < 0.001).
Fig. 7
Fig. 7. The enhanced amino acid metabolism induced the activation of mTORC1.
a Time series analysis of protein levels of ATF4, the phosphorylation levels of S6 and ribosomal protein S6 (S6) in Jurkat cells after AZD4547 treatment (right). DMSO was used as control (left). b Protein levels of ATF4, the phosphorylation levels of S6 and S6 in Jurkat or the more resistant Jurkat (Jurkat-AZD) cells with or without AZD4547 (2 μM), the β-Tubulin (β-Tub) was used as the internal control. c Protein levels of ATF4, ASS1, ASNS, PHGDH, SLC1A5 and phosphorylation level of S6 in ATF4 knockdown Jurkat cells. The cells were harvested at 72 h after ATF4 knockdown lentivirus vectors transfection, the β-Tubulin (β-Tub) was used as the internal control. Protein levels of the S6 and phosphorylation level of S6 (left) and relative cell growth (right) in the more resistant Jurkat (Jurkat-AZD) cells after (d) ASNS knockdown, (e) ASS1 knockdown, (f) SLC1A5 knockdown, or (g) PHGDH knockdown. Total proteins were harvested at 72 h after lentivirus vectors transfection, and the cell counting was performed at 72 h after different concentrations of AZD4547. Data are mean ± SD (Two-tailed unpaired Student’s t test, *P < 0.05, **P < 0.01, ***P < 0.001).
Fig. 8
Fig. 8. Schematic diagram of the resistance against FGFR1 inhibitors.
The FGFR1 inhibitors specifically block FGFR1 signaling, but also induced the expression of ATF4 through enhancing chromatin accessibility transcriptionally combined with activating translation via the GCN2-eIF2α pathway. Then, ATF4 remodeled the amino acid metabolism by stimulating the expression of multiple metabolic genes, further maintained the activation of mTORC1, which contributed to the resistance to FGFR1 inhibitor in T-ALL.

References

    1. Dores GM, Devesa SS, Curtis RE, Linet MS, Morton LM. Acute leukemia incidence and patient survival among children and adults in the United States, 2001-2007. Blood. 2012;119:34–43. doi: 10.1182/blood-2011-04-347872. - DOI - PMC - PubMed
    1. Pui CH, Mullighan CG, Evans WE, Relling MV. Pediatric acute lymphoblastic leukemia: where are we going and how do we get there? Blood. 2012;120:1165–74. doi: 10.1182/blood-2012-05-378943. - DOI - PMC - PubMed
    1. Patrick K, Wade R, Goulden N, Mitchell C, Moorman AV, Rowntree C, et al. Outcome for children and young people with early T-cell precursor acute lymphoblastic leukaemia treated on a contemporary protocol, UKALL 2003. Br J Haematol. 2014;166:421–4. doi: 10.1111/bjh.12882. - DOI - PubMed
    1. Winter SS, Dunsmore KP, Devidas M, Wood BL, Esiashvili N, Chen Z, et al. Improved survival for children and young adults with T-lineage acute lymphoblastic leukemia: results from the children’s oncology group AALL0434 methotrexate randomization. J Clin Oncol. 2018;36:2926–34. doi: 10.1200/JCO.2018.77.7250. - DOI - PMC - PubMed
    1. Katoh M, Nakagama H. FGF receptors: cancer biology and therapeutics. Med Res Rev. 2014;34:280–300. doi: 10.1002/med.21288. - DOI - PubMed

MeSH terms

Substances

LinkOut - more resources