. 2023 Jun 6;21(1):132.
doi: 10.1186/s12915-023-01613-2.

Single-cell and spatial transcriptomics reveal changes in cell heterogeneity during progression of human tendinopathy

Affiliations

Single-cell and spatial transcriptomics reveal changes in cell heterogeneity during progression of human tendinopathy

Weili Fu et al. BMC Biol. .

Abstract

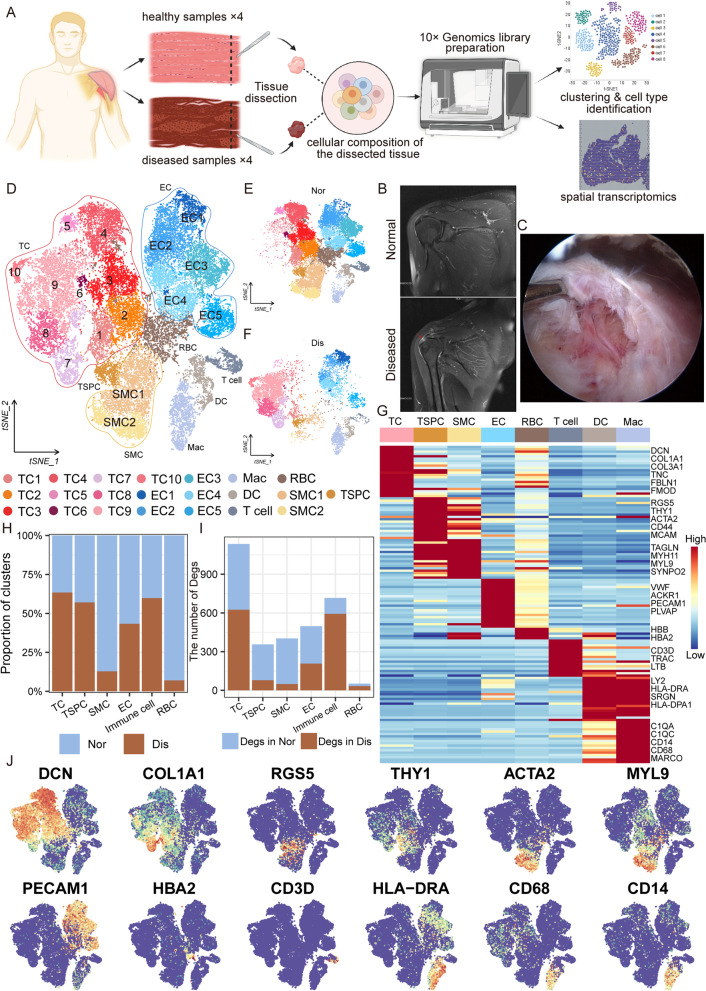
Background: Musculoskeletal tissue degeneration impairs the life quality and motor function of many people, especially seniors and athletes. Tendinopathy is one of the most common diseases associated with musculoskeletal tissue degeneration, representing a major global healthcare burden that affects both athletes and the general population, with the clinical presentation of long-term recurring chronic pain and decreased tolerance to activity. The cellular and molecular mechanisms at the basis of the disease process remain elusive. Here, we use a single-cell and spatial RNA sequencing approach to provide a further understanding of cellular heterogeneity and molecular mechanisms underlying tendinopathy progression.

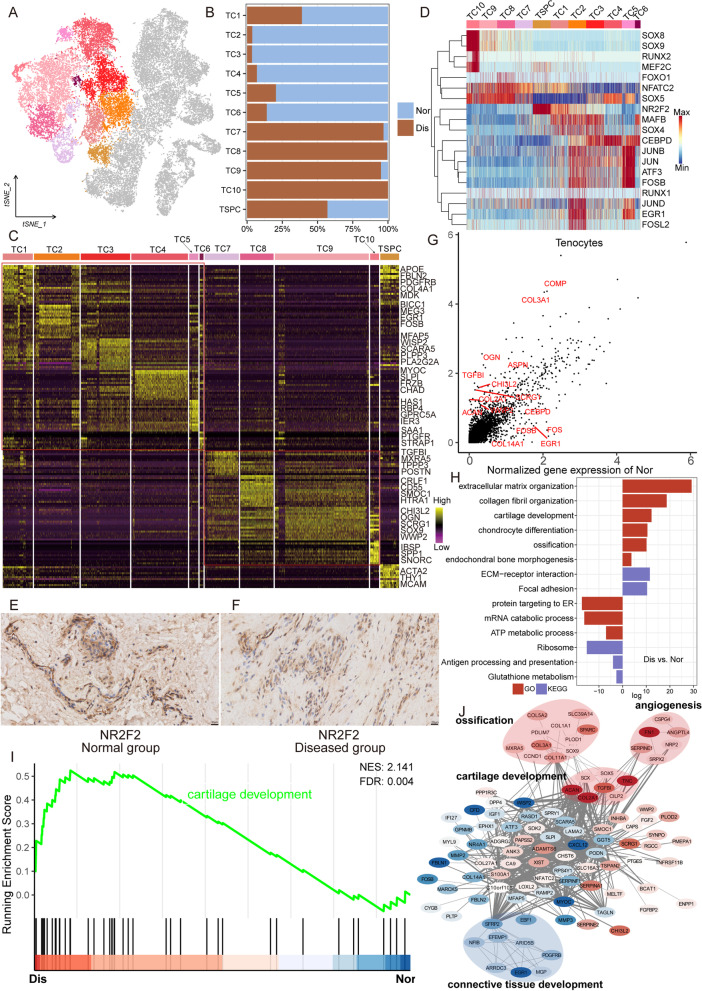
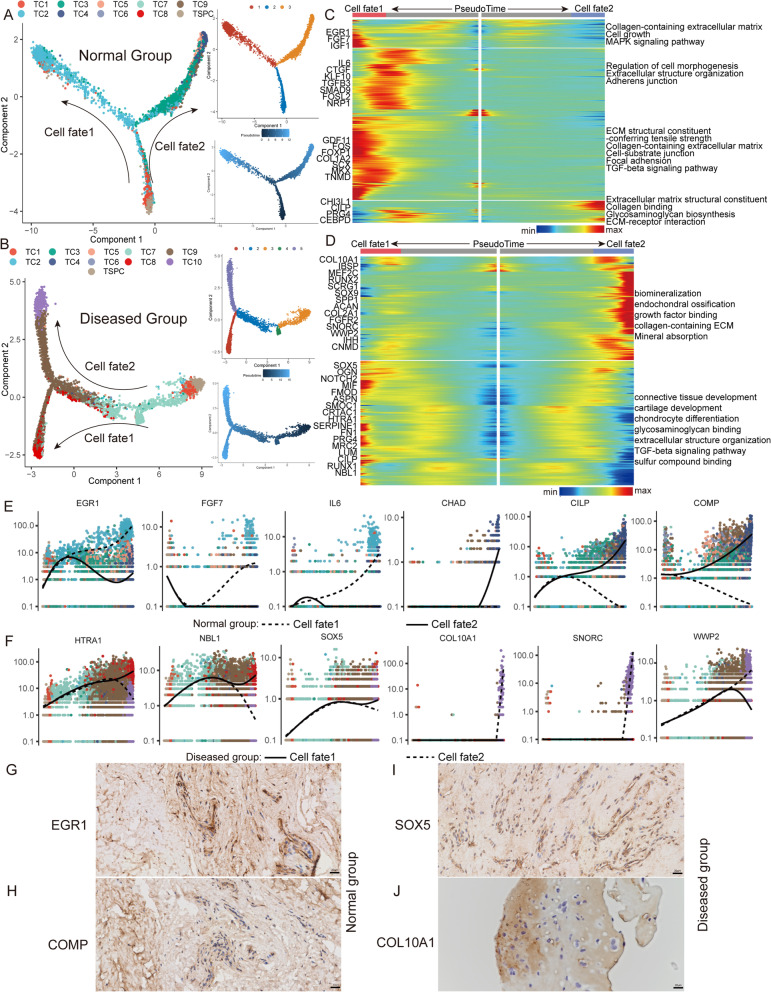
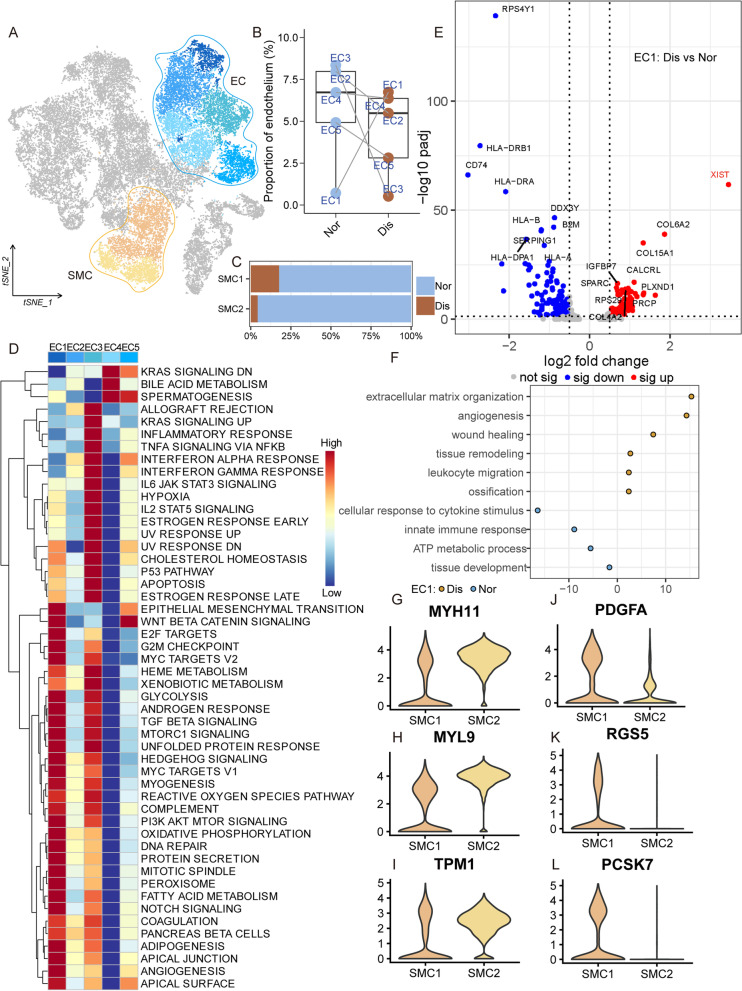
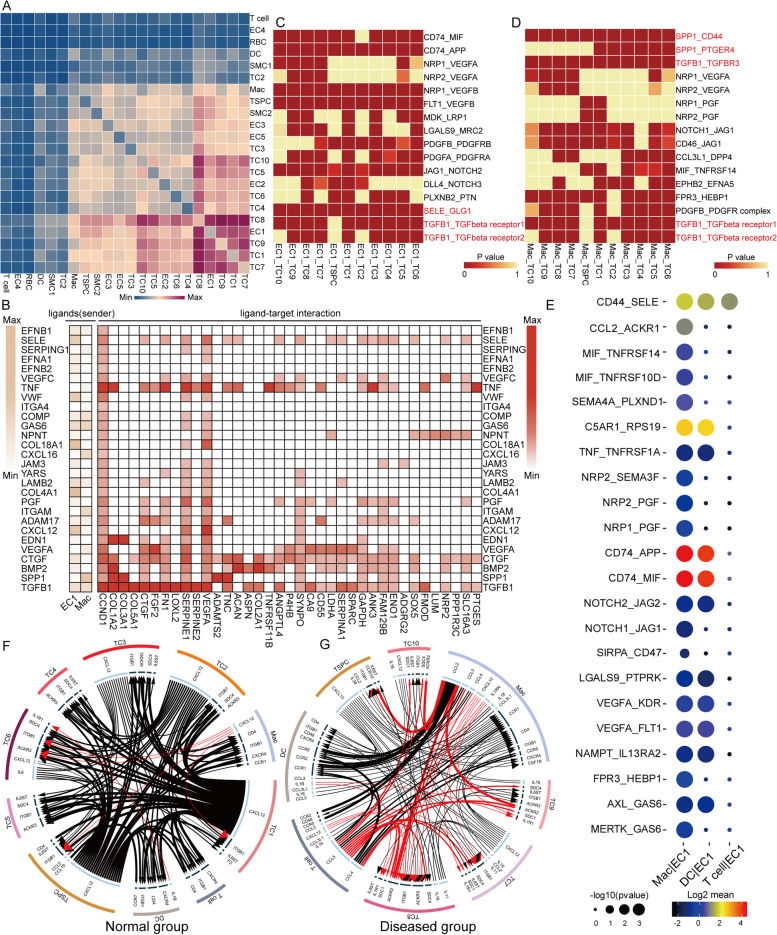
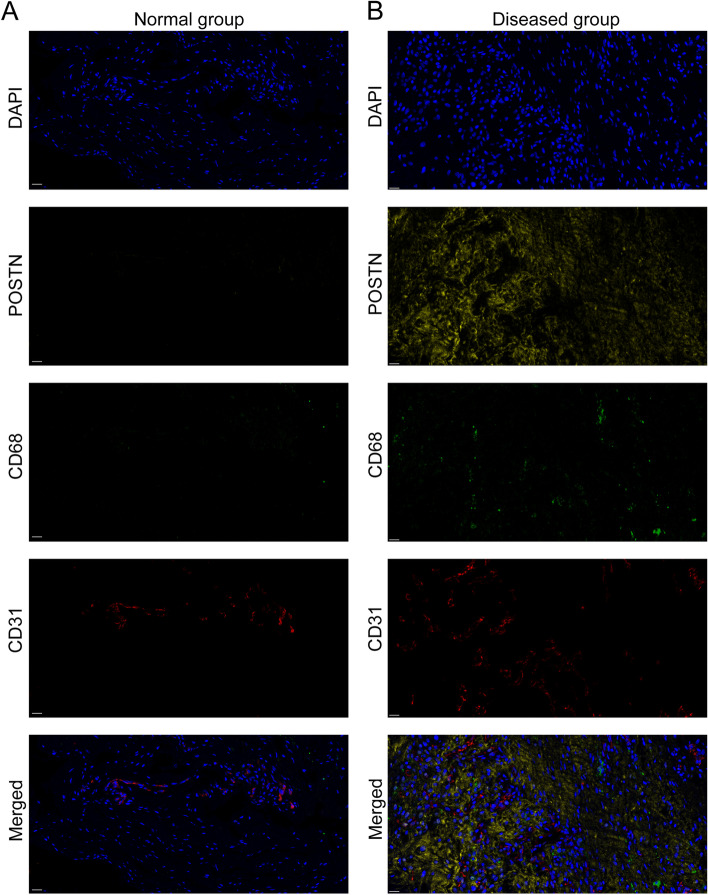
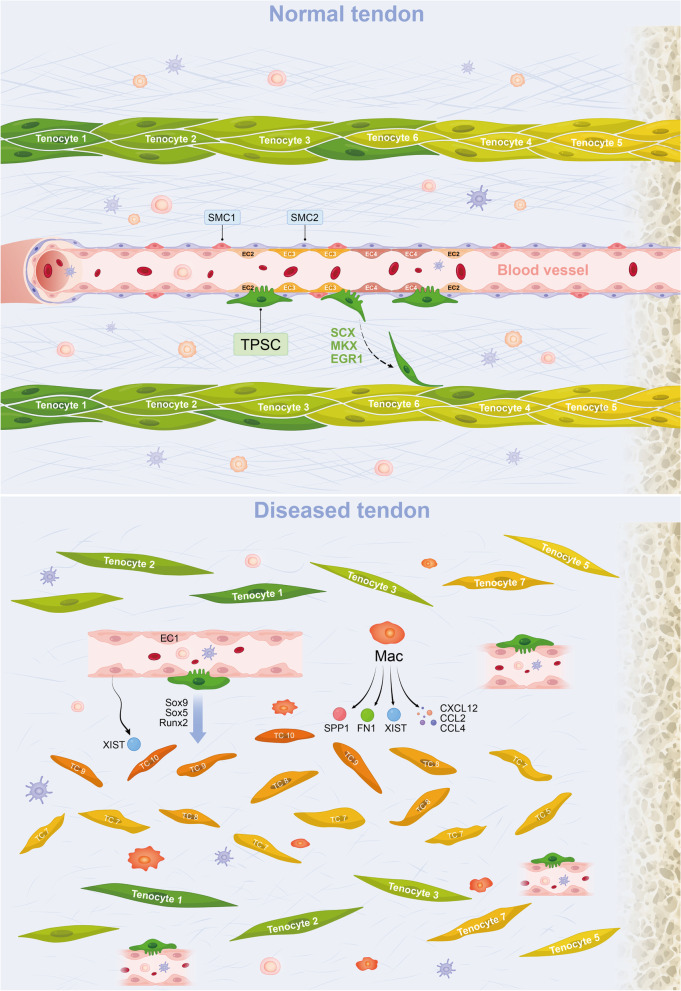
Results: To explore the changes in tendon homeostasis during the tendinopathy process, we built a cell atlas of healthy and diseased human tendons using single-cell RNA sequencing of approximately 35,000 cells and explored the variations of cell subtypes' spatial distributions using spatial RNA sequencing. We identified and localized different tenocyte subpopulations in normal and lesioned tendons, found different differentiation trajectories of tendon stem/progenitor cells in normal/diseased tendons, and revealed the spatial location relationship between stromal cells and diseased tenocytes. We deciphered the progression of tendinopathy at a single-cell level, which is characterized by inflammatory infiltration, followed by chondrogenesis and finally endochondral ossification. We found diseased tissue-specific endothelial cell subsets and macrophages as potential therapeutic targets.

Conclusions: This cell atlas provides the molecular foundation for investigating how tendon cell identities, biochemical functions, and interactions contributed to the tendinopathy process. The discoveries revealed the pathogenesis of tendinopathy at single-cell and spatial levels, which is characterized by inflammatory infiltration, followed by chondrogenesis, and finally endochondral ossification. Our results provide new insights into the control of tendinopathy and potential clues to developing novel diagnostic and therapeutic strategies.

Keywords: Heterotopic ossification; Single-cell RNA-seq; Spatial RNA-seq; Tendinopathy.


Conflict of interest statement

The authors declare that they have no competing interests.

Figures

Fig. 1
Fig. 1
Single-cell RNA-seq reveals major cell classes in the human tendon. A The overall workflow of our research program. B MRI photographs of typical normal (up) and lesioned tendon (down). C A photograph of a typical lesioned tendon under an arthroscope. D t-SNE visualization of all cell clusters in collected tendons. E, F t-SNE visualization of the donor origins in normal/diseased samples. G Heatmap of selected marker genes in each cell cluster. H The percentages of the identified cell classes in normal/diseased tendons. I Number of differentially expressed genes (DEGs) in each cell type of normal/diseased status. J Feature plots of expression distribution for selected cluster-specific genes. Brighter colors indicate higher expression levels
Fig. 2
Fig. 2
Characterization of tenocyte subclusters and TSPC across different statuses in the human tendon. A t-SNE visualization of the subclusters of tenocytes and TSPC. B The proportions of 10 tenocyte subpopulations and TSPC in normal and diseased tendons. C A cell-level heatmap reveals the normalized expression of DEGs for each cluster defined. D Heatmap of gene expression regulation by transcription factors applying SCENIC for each tenocyte subcluster and TSPC. E, F Immunohistochemical staining of NR2F2 in normal and diseased samples. G Volcano plot showing the DEGs between two statues of tenocytes and TSPC. The x-axis represents highly expressed genes in normal cells, and the y-axis represents highly expressed genes in diseased cells. H GO and KEGG enrichment analysis of DEGs in tenocytes and TSPC between normal and lesioned tendons. I GSEA enrichment plots for representative signaling pathways upregulated in tenocytes and TSPC of diseased samples, compared to normal samples. J Gene–gene interaction networks between DEGs in tenocytes and TSPC of the normal group and tenocytes and TSPC of the diseased group
Fig. 3
Fig. 3
Evolution trajectory and transcriptional fluctuation during tendinopathy progression. A Cell trajectory analysis of TSPC differentiation in the normal tendon. B Cell trajectory analysis of TSPC differentiation in the diseased tendon. C Heatmap showing the expression changes of the highly variable genes along the two cell fates of the trajectory in the normal group. Significantly enriched functional annotations are shown on the right side of the heatmap. D Heatmap showing the expression changes of the highly variable genes along the two cell fates of the trajectory in the diseased group. E, F Representative gene expression levels of different marker genes along TSPC differentiation trajectories of normal and diseased statuses. G, H Immunohistochemical staining of EGR1 and COMP in the normal tendon. I, J Immunohistochemical staining of SOX5 and COL10A1 in a lesioned tendon
Fig. 4
Fig. 4
Identification of endothelial cell and smooth muscle cell subclusters in the human tendon. A t-SNE visualization of the subclusters of endothelial cells and smooth muscle cells. B Summarized subpopulations of endothelial cell percentage changes. C The proportion of each subcluster of smooth muscle cells in the lesioned and normal tendons. D Heatmap showing the results of enrichment analysis of 50 hallmarker gene sets in EC1-5. E Volcano plots displaying the DEGs in EC1 between the normal group and the diseased group. Each dot represented one gene. Red dots, differentially upregulated genes; blue dots, differentially downregulated genes; gray dots, non-differentially expressed genes. F GO enrichment analysis of DEGs between normal EC1 and diseased EC1. GL Violin plots showing representative marker genes associated with different types of SMC expressed in SMC1 and SMC2
Fig. 5
Fig. 5
Identification of immune cell subclusters in the human tendon. A t-SNE visualization of different types of immune cells in the human tendon. B Per-sample bar plots visualize the immune cell percentage changes between the normal and diseased groups. C Summarized immune cell percentage changes. D t-SNE visualization of macrophages of the normal/diseased group. E t-SNE visualization of M1 score (left) and M2 score (right) of macrophages. F M1 (left) and M2 (right) score of macrophages in normal/diseased tendon by using gene set variation analysis (GSVA). G Volcano plots displaying the DEGs in Mac between the normal group and the diseased group. Red dots, differentially upregulated genes; blue dots, differentially downregulated genes; gray dots, non-differentially expressed genes. H GO enrichment analysis of DEGs in Mac between a normal tendon and a diseased tendon. I Gene set enrichment analysis (GSEA) of representative signaling pathways related to ossification in Mac of normal and diseased samples. J Violin plots showing representative DEGs between macrophages in normal tendons and macrophages in diseased tendons. Two-sided unpaired t-test, *p < 0.05, ***p < 0.001
Fig. 6
Fig. 6
Cell–cell crosstalk during tendinopathy progression. A Heatmap depicting the significant interactions among the 22 major cell clusters identified in Fig. 1D. B Heatmap showing the potential ligands send from EC1/Mac and their downstream potential target genes expressed in tenocytes and TSPC. C Heatmap displaying the potential ligand-receptor pairs related to endochondral ossification identified between EC1 and tenocytes and TSPC. D Heatmap showing the potential ligand-receptor pairs associated with endochondral ossification identified between Mac and tenocytes and TSPC. E The bubble plot generated by CellPhoneDB showing potential ligand-receptor pairs associated with angiogenesis between immune cells and EC1. F, G The circo plot showing the potential cytokines and chemokines expressed in immune cells of normal/diseased tendon
Fig. 7
Fig. 7
Spatial transcriptome sequencing deciphers the molecular variations during tendinopathy progression. A UMAP visualization of the distribution of cells at different sample statuses (left). UMAP visualization of 10 cell clusters in spatial transcriptome sample (right). B The proportion of each subcluster in the normal and diseased groups. C H&E staining of normal and diseased tendons (left) and distribution of 10 clusters in the tissue space (right). D Dis-TC score of 10 clusters in the diseased group (left). Spatial heatmaps showing the Dis-TC score (middle) and the expression level of POSTN (right) in the diseased group. E Dis-TC score of 10 clusters in the normal group. Spatial heatmaps showing the Dis-TC score (middle) and the expression level of POSTN (right) in the normal group. F Mac score of 10 clusters in the diseased group. Spatial heatmaps depicting the Dis-TC score (middle) and the expression level of CD68 (right) in the diseased group. G Mac score of each cluster of the normal group. Spatial heatmaps depicting the Dis-TC score (middle) and the expression level of CD68 (right) in the normal group. H EC1 score of each cluster in the diseased group (left). Spatial heatmaps depicting the EC1 score (middle) and the expression level of CD31 (right) in the diseased group. I EC1 score of each cluster in the normal group (left). Spatial heatmaps depicting the EC1 score (middle) and the expression level of CD31 (right) in the normal group. J, K Spotlight plots showing the spatial distribution of different cell populations in normal (J) and degenerative (K) tendons
Fig. 8
Fig. 8
Immunofluorescent staining of human tendons demonstrating the distribution of diseased tenocytes, macrophages, and endothelial cells. A, B Immunofluorescent staining of POSTN, CD68, and CD31 in normal (A) and diseased (B) groups (scale bar: 20 µm)
Fig. 9
Fig. 9
A schematic diagram of the microenvironment changes between the normal and the degenerated meniscus. The upper side visualizes the healthy tendon, where TC1, TC2 and TC3 are dominant tenocyte populations. In this situation, TSPC could differentiate into normal subsets of tenocytes and the aberrant proliferation of blood vessels is inhibited. The lower side visualizes the degenerated tendon where the orchestrated microenvironment balance is broken. In this situation, TSPC could differentiate into chondrocytes and osteocytes, which resulted in HO. The EC1 grew and formed new blood vessels in the diseased area. The vascular permeability increased and allowed more immune cells to infiltrate the degenerated tissue. Proliferating EC1 and Mac can also act on the diseased tenocytes by expressing osteogenic and chondrogenic genes (SPP1, FN1, XIST) to promote disease progression

Similar articles

Cited by

References

    1. Maffulli N, Longo UG, Kadakia A, Spiezia F. Achilles tendinopathy. Foot Ankle Surg. 2020;26(3):240–249. doi: 10.1016/j.fas.2019.03.009. - DOI - PubMed
    1. Millar NL, Murrell GA, McInnes IB. Inflammatory mechanisms in tendinopathy - towards translation. Nat Rev Rheumatol. 2017;13(2):110–122. doi: 10.1038/nrrheum.2016.213. - DOI - PubMed
    1. Hopkins C, Fu SC, Chua E, Hu X, Rolf C, Mattila VM, et al. Critical review on the socio-economic impact of tendinopathy. Asia Pac J Sports Med Arthrosc Rehabil Technol. 2016;4:9–20. - PMC - PubMed
    1. Millar NL, Silbernagel KG, Thorborg K, Kirwan PD, Galatz LM, Abrams GD, et al. Tendinopathy. Nat Rev Dis Primers. 2021;7(1):1. doi: 10.1038/s41572-020-00234-1. - DOI - PubMed
    1. von Rickenbach KJ, Borgstrom H, Tenforde A, Borg-Stein J, McInnis KC. Achilles tendinopathy: evaluation, rehabilitation, and prevention. Curr Sports Med Rep. 2021;20(6):327–334. doi: 10.1249/JSR.0000000000000855. - DOI - PubMed

Publication types