. 2023 Jun 7;21(1):126.
doi: 10.1186/s12915-023-01623-0.

Correlated cryo-SEM and CryoNanoSIMS imaging of biological tissue

Affiliations

Correlated cryo-SEM and CryoNanoSIMS imaging of biological tissue

Anders Meibom et al. BMC Biol. .

Abstract

Background: The development of nanoscale secondary ion mass spectrometry (NanoSIMS) has revolutionized the study of biological tissues by enabling, e.g., the visualization and quantification of metabolic processes at subcellular length scales. However, the associated sample preparation methods all result in some degree of tissue morphology distortion and loss of soluble compounds. To overcome these limitations an entirely cryogenic sample preparation and imaging workflow is required.

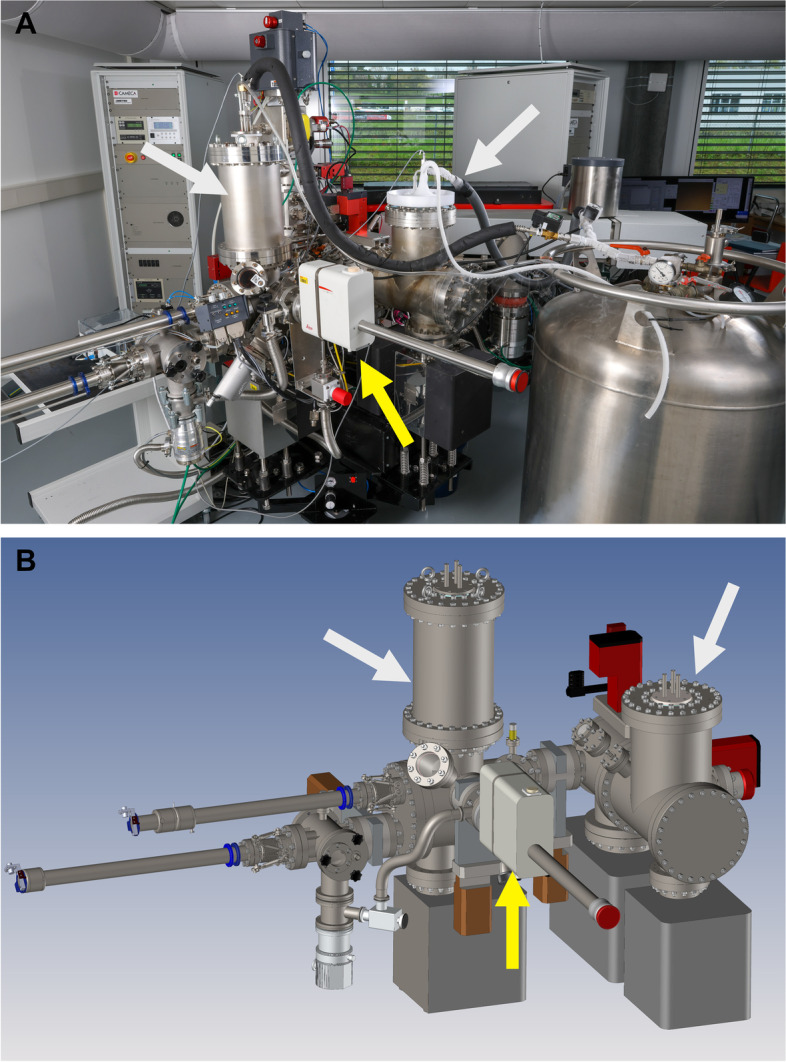
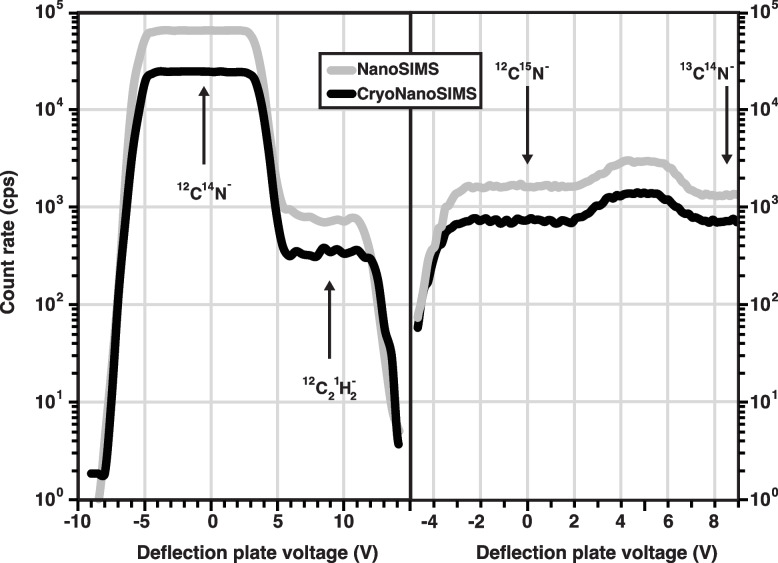
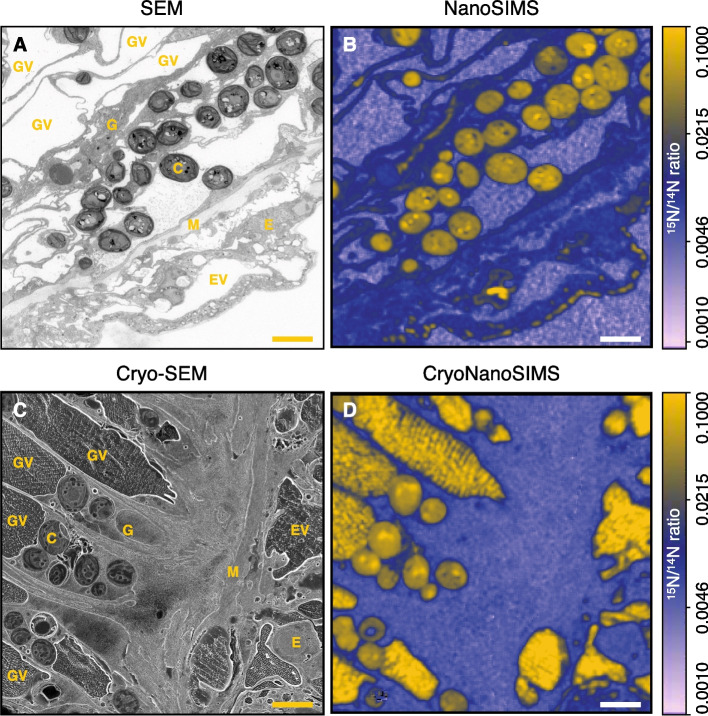
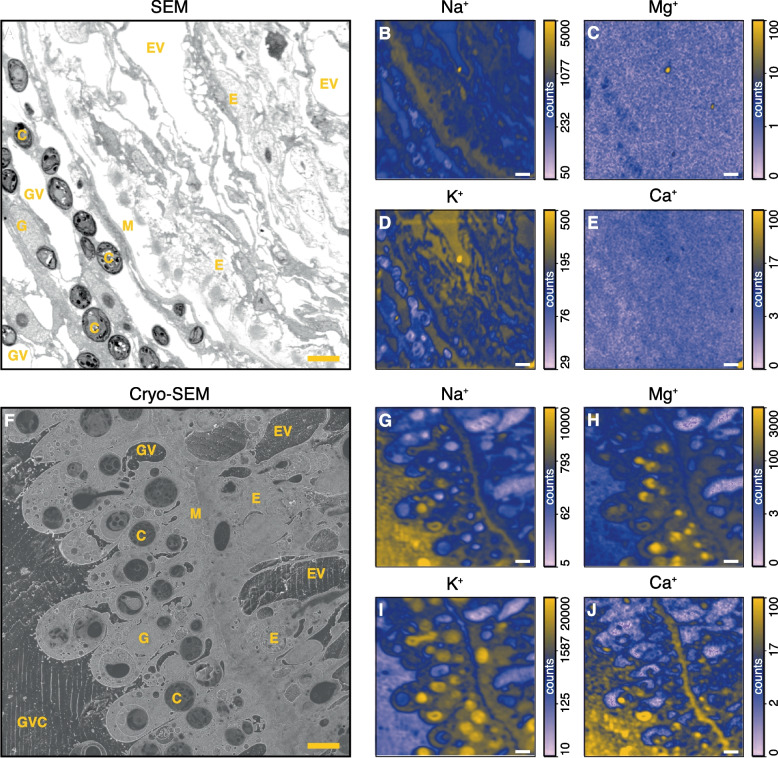
Results: Here, we report the development of a CryoNanoSIMS instrument that can perform isotope imaging of both positive and negative secondary ions from flat block-face surfaces of vitrified biological tissues with a mass- and image resolution comparable to that of a conventional NanoSIMS. This capability is illustrated with nitrogen isotope as well as trace element mapping of freshwater hydrozoan Green Hydra tissue following uptake of 15N-enriched ammonium.

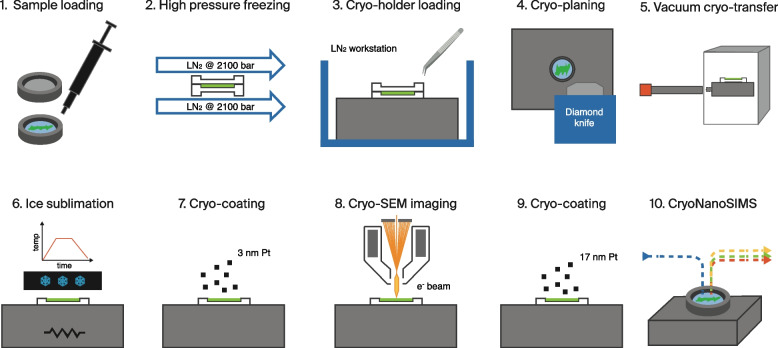
Conclusion: With a cryo-workflow that includes vitrification by high pressure freezing, cryo-planing of the sample surface, and cryo-SEM imaging, the CryoNanoSIMS enables correlative ultrastructure and isotopic or elemental imaging of biological tissues in their most pristine post-mortem state. This opens new horizons in the study of fundamental processes at the tissue- and (sub)cellular level.

Teaser: CryoNanoSIMS: subcellular mapping of chemical and isotopic compositions of biological tissues in their most pristine post-mortem state.

Keywords: High pressure freezing; Hydra viridissima; Isotope labeling; NanoSIMS; Osmoregulation; Photosymbiosis.


Conflict of interest statement

The authors declare that they have no competing interests.

Figures

Fig. 1
Fig. 1
The CryoNanoSIMS. A Compared to the conventional NanoSIMS instrument, the analysis chamber and the sample transfer system have been redesigned to allow for the introduction of high pressure frozen, cryo-planed block-face samples with (optional) prior imaging by cryo-SEM. Notice the two liquid N2 reservoirs on the redesigned analysis chamber and transfer system (indicated by white arrows), both connected to the large external tank containing liquid N2. Also shown is the sample vacuum and cryo transfer (VCT) shuttle docked onto the transfer system (yellow arrow). B 3D rendering of the modified CryoNanoSIMS transfer system and analysis chamber. The CryoNanoSIMS transfer system and analysis chamber are compared with those of the conventional NanoSIMS instrument in Additional file 1: Figure S1
Fig. 2
Fig. 2
Mass-resolution for NanoSIMS vs. CryoNanoSIMS. Shown are mass spectra around atomic nominal mass units 26 and 27 at which the 12C14N and 12C15N ions are routinely separated from potential mass interferences and counted in electron multiplier detectors to permit quantitative measurements of the sample 15N/14N isotope ratio. In this example, the 12C14N and 12C15N ions were derived from 15N-labeled biological tissue (Green Hydra, cf. main text), conventionally prepared (i.e., with resin embedding) in the case of NanoSIMS analysis and with the cryogenic workflow (cf. main text) in the case of CryoNanoSIMS analysis. With identical instrument settings, the mass resolution is — for all practical purposes — indistinguishable between NanoSIMS and CryoNanoSIMS analysis. The count rates shown for each analytical mode are representative of biological tissue under typical analysis conditions, i.e., with a primary Cs+ beam current of ca. 2 pA focused to a spot of about 150 nm and scanning a field of view 40 × 40 µm2 in steps of 256 by 256 pixels; c.f. Methods. All else being equal, the count rate of 12C14N is generally lower from a vitrified sample than from a resin-embedded sample, but this can vary among different tissue types. Additional file 1: Figures S4 and S5 show the stability of key molecular ion species, isotope ratios, and the corresponding ion images obtained on isotopically normal biological tissue; see also Fig. 4
Fig. 3
Fig. 3
Schematic representation of the entirely cryogenic sample preparation and imaging workflow for correlated cryo-SEM and CryoNanoSIMS imaging
Fig. 4
Fig. 4
Correlated SEM and NanoSIMS isotope ratio images for room-temperature and cryogenic workflows. The tissue imaged was from the symbiotic freshwater organism Green Hydra, isotopically labeled through the assimilation of 15NH4+. A SEM image of a section of conventionally prepared tissue and B a quantified NanoSIMS map (room-temperature) of the corresponding 15N/14N ratio. C Cryo-SEM image after the entirely cryogenic sample preparation and D a quantified CryoNanoSIMS map of the corresponding 15N/14N ratio. The images were obtained from similar regions in the gastric region of Green Hydra animals that were exposed to identical incubation conditions (cf. Methods), permitting a direct comparison between the two analytical approaches. Note the dramatic difference in appearance between conventionally prepared and cryogenically prepared tissue (A vs. C), i.e., shrinkage and strong deformation (e.g., of vacuoles) vs. no shrinkage/deformation, and the strong 15N enrichments in the vacuoles in the CryoNanoSIMS image, which are absent in the (emptied) vacuoles after normal sample preparation (B vs. D). The isotopic enrichments shown in B and D are presented by a logarithmic color scale. The isotope ratio images are drift-corrected accumulations of 5 sequential images each consisting of 256 by 256 pixels with a pixel dwelling time of 5 ms; typical analysis time for one image as displayed is about 30 min. Scale bars are 5 μm. C, Chlorella sp. algae; EV, epidermal vacuole; E, epidermis; GV, gastrodermal vacuole; G, gastrodermis; M, mesoglea
Fig. 5
Fig. 5
Correlated SEM and NanoSIMS inorganic ion images for room-temperature and cryogenic workflows. A SEM image of a section of conventionally prepared tissue of Green Hydra and corresponding NanoSIMS maps of the distributions of Na (B), Mg (C), K (D), and Ca (E). F Cryo-SEM image after a fully cryogenic sample preparation of tissue of Green Hydra and corresponding CryoNanoSIMS maps of the distributions of Na (G), Mg (H), K (I), and Ca (J). The images are from similar regions in the gastric region of Green Hydra animals that were exposed to identical incubation conditions (cf. Methods), permitting a direct comparison between the two analytical approaches. Note the dramatic loss of inorganic ions (especially Mg, K, and Ca) in conventional sample preparation due to dehydration and resin infiltration of the samples. Elemental maps are shown in a logarithmic color scale. These elemental maps are drift-corrected accumulations of 15 sequential images each consisting of 256 by 256 pixels with a pixel dwelling time of 5 ms; typical analysis time for one image as displayed is about 90 min. Scale bars are 5 µm. C, Chlorella sp. algae; EV, epidermal vacuole; E, epidermis; GVC, gastrovascular cavity; GV, gastrodermal vacuole; G, gastrodermis; M, mesoglea

References

    1. Slodzian G, Daigne B, Girard F, Hillion F. Secondary Ion Mass Spectrometry: SIMS IX. 1993. Ion optics for a high resolution scanning ion microscope and spectrometer: transmission evaluations; pp. 294–7.
    1. Lechene C, Hillion F, McMahon G, Benson D, Kleinfeld AM, Kampf JP, et al. High-resolution quantitative imaging of mammalian and bacterial cells using stable isotope mass spectrometry. J Biol. 2006;5:20. doi: 10.1186/jbiol42. - DOI - PMC - PubMed
    1. Hoppe P, Cohen S, Meibom A. NanoSIMS: Technical aspects and applications in cosmochemistry and biological geochemistry. Geostand Geoanal Res. 2013;37:111–154. doi: 10.1111/j.1751-908X.2013.00239.x. - DOI
    1. Woebken D, Burow LC, Prufert-Bebout L, Bebout BM, Hoehler TM, Pett-Ridge J, et al. Identification of a novel cyanobacterial group as active diazotrophs in a coastal microbial mat using NanoSIMS analysis. ISME J. 2012;6:1427–1439. doi: 10.1038/ismej.2011.200. - DOI - PMC - PubMed
    1. Zimmermann M, Escrig S, Hübschmann T, Kirf MK, Brand A, Inglis RF, et al. Phenotypic heterogeneity in metabolic traits among single cells of a rare bacterial species in its natural environment quantified with a combination of flow cell sorting and NanoSIMS. Front Microbiol. 2015;6:243. doi: 10.3389/fmicb.2015.00243. - DOI - PMC - PubMed

Publication types

MeSH terms

LinkOut - more resources