. 2023 Jun 7;14(1):82.
doi: 10.1186/s40104-023-00884-7.

CLOCK inhibits the proliferation of porcine ovarian granulosa cells by targeting ASB9

Affiliations

CLOCK inhibits the proliferation of porcine ovarian granulosa cells by targeting ASB9

Liang Huang et al. J Anim Sci Biotechnol. .

Abstract

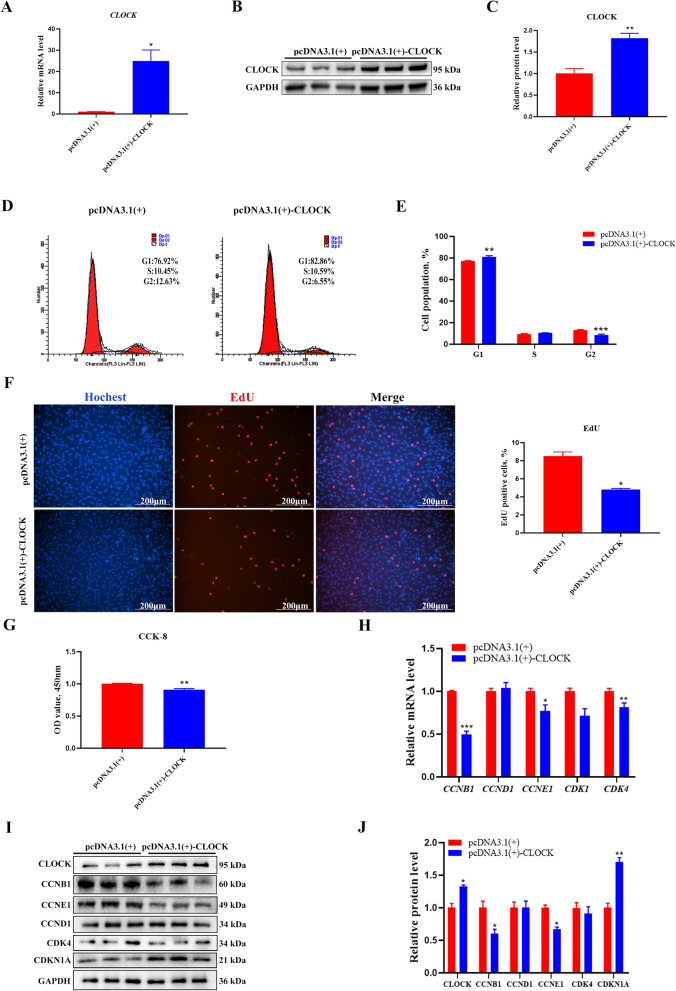
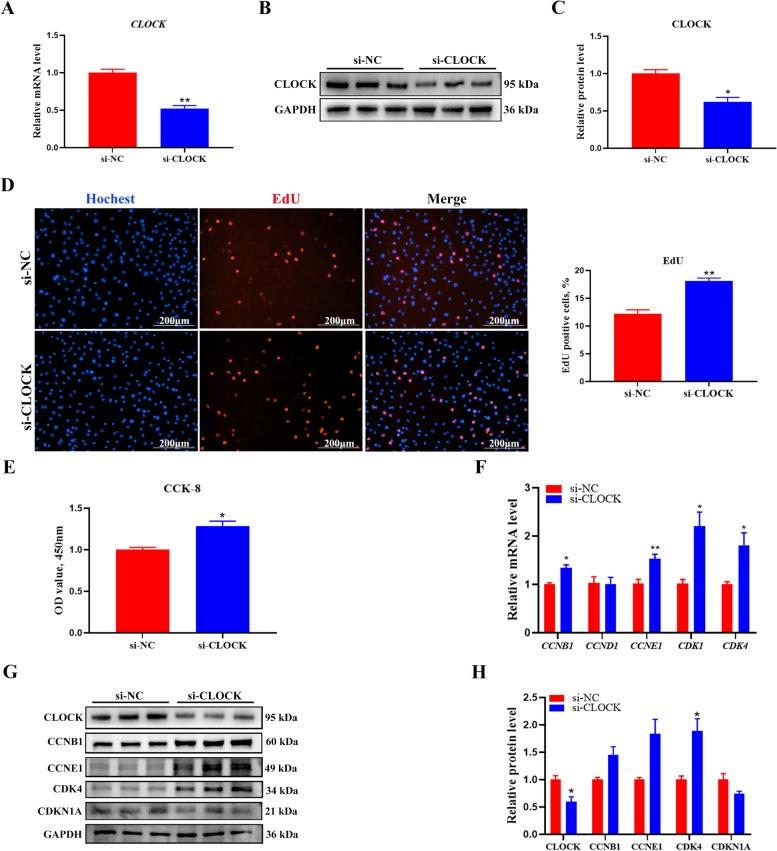
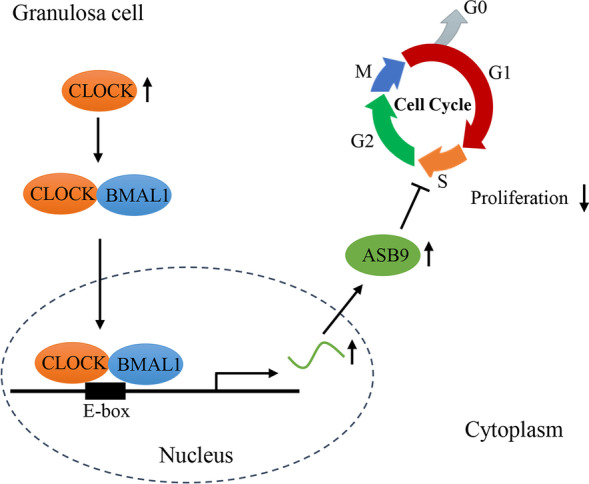
Background: Clock circadian regulator (CLOCK) is a core factor of the mammalian biological clock system in regulating female fertility and ovarian physiology. However, CLOCK's specific function and molecular mechanism in porcine granulosa cells (GCs) remain unclear. In this study, we focused on CLOCK's effects on GC proliferation.

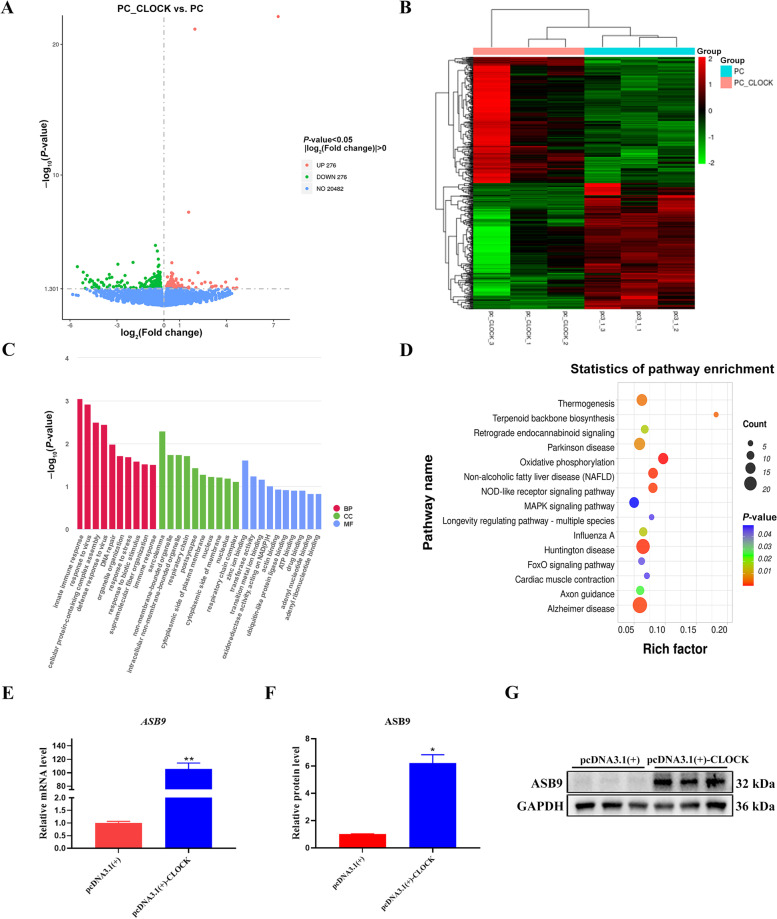
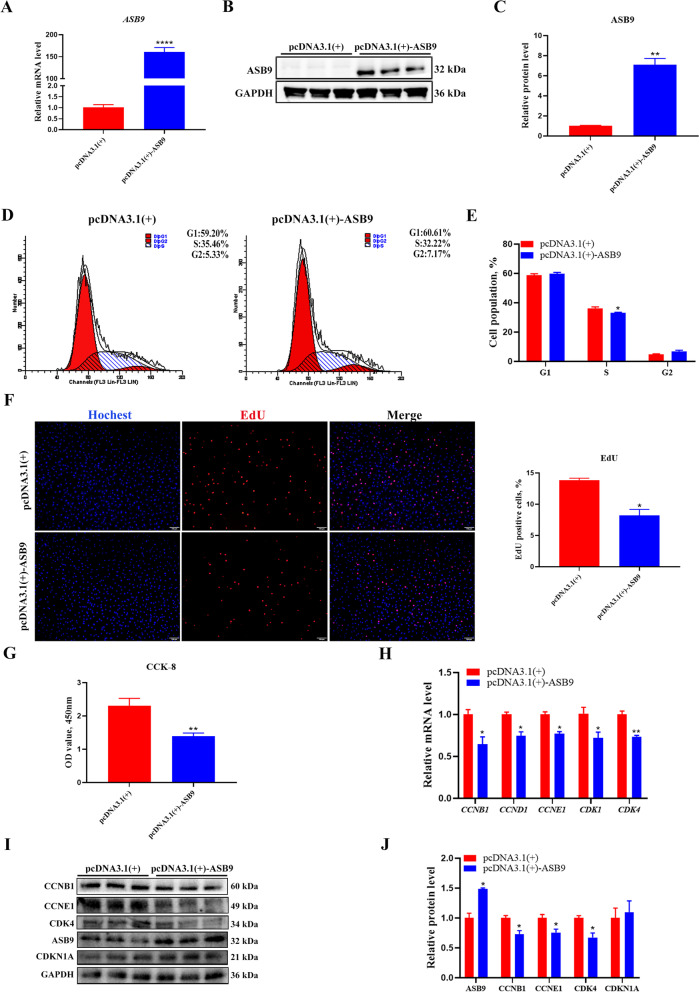
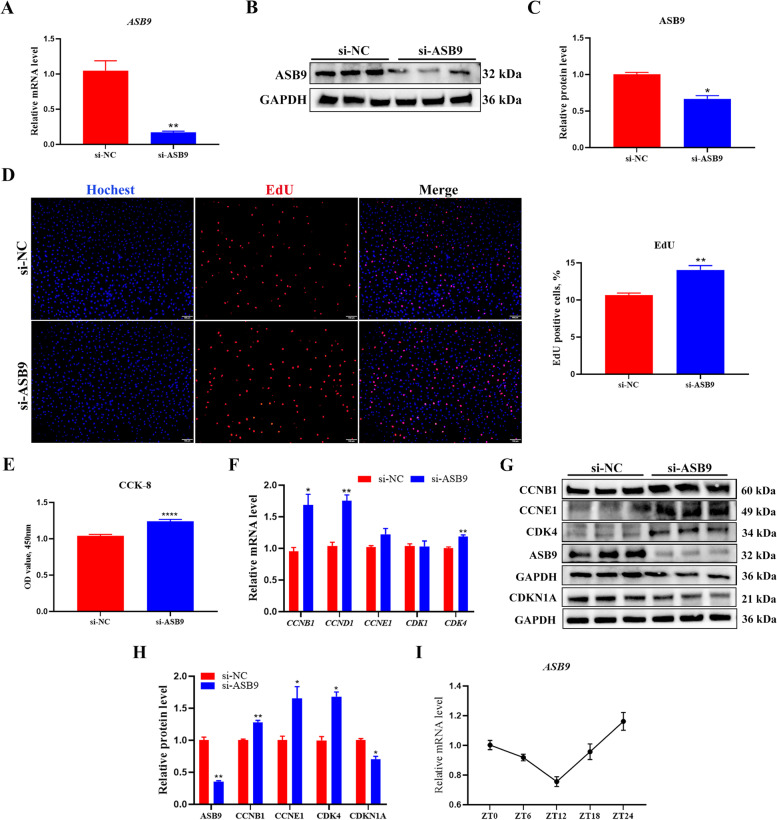
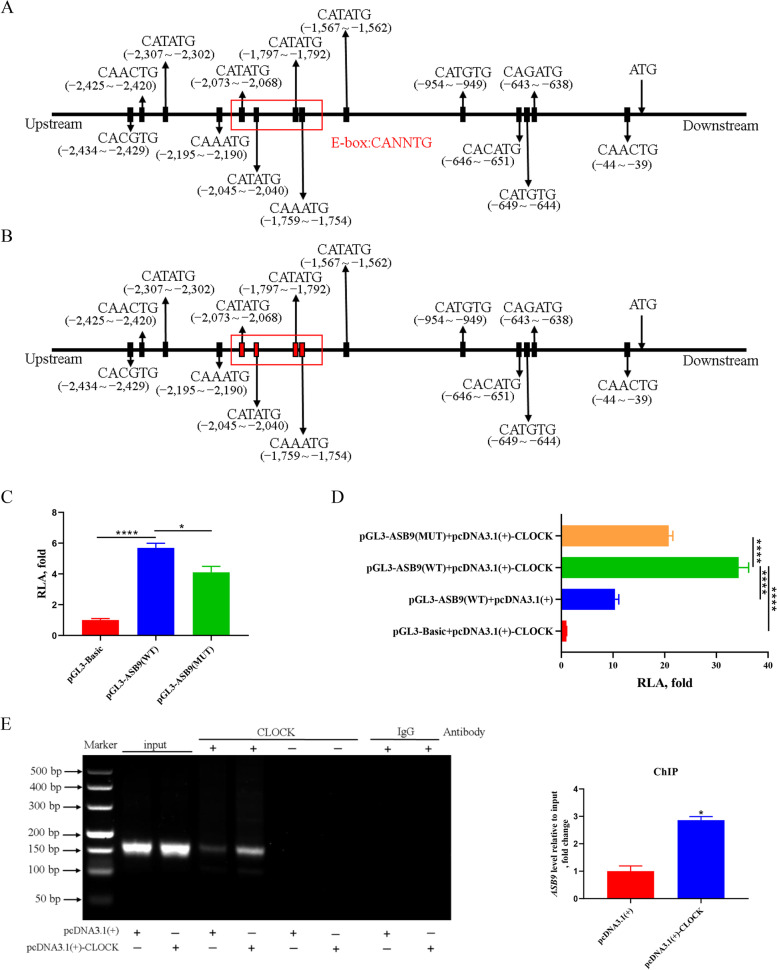
Results: CLOCK significantly inhibited cell proliferation in porcine GCs. CLOCK decreased the expression of cell cycle-related genes, including CCNB1, CCNE1, and CDK4 at the mRNA and protein levels. CDKN1A levels were upregulated by CLOCK. ASB9 is a newly-identified target of CLOCK that inhibits GC proliferation; CLOCK binds to the E-box element in the ASB9 promoter.

Conclusions: These findings suggest that CLOCK inhibits the proliferation of porcine ovarian GCs by increasing ASB9 level.

Keywords: ASB9; CLOCK; Granulosa cells; Pig; Proliferation.


Conflict of interest statement

The authors declare that they have no competing interests.

Figures

Fig. 1
Fig. 1
Localization and expression of circadian clock gene CLOCK in GCs. A Purity identification of cultured GCs in vitro. WHITE, white light; FSHR, red fluorescence; DAPI, blue fluorescence; bar = 200 µm. DAPI was used to visualize nuclei. B Immunofluorescence results reveal the expression of CLOCK in cultured GCs in vitro. WHITE, white light; CLOCK, red fluorescence; DAPI, blue fluorescence; bar = 20 µm. DAPI was used to visualize nuclei. C RNA expression of CLOCK in GCs. ZT: zone time
Fig. 2
Fig. 2
CLOCK overexpression inhibits GCs proliferation. A The overexpression efficiency of CLOCK was measured using RT-qPCR. Data are expressed as mean ± SEM (n = 4), *P < 0.05. B Western blotting reveals the expression levels of CLOCK. C Quantitative statistics of CLOCK. Data are expressed as mean ± SEM (n = 3), **P < 0.01. D Flow cytometry determines cell percentages in different cell-cycle phases. E Cell-cycle analysis statistical results. Data are expressed as mean ± SEM (n = 3), **P < 0.01, ***P < 0.001. F EdU staining was used to quantify the number of proliferating cells. RED, EdU-positive cells; BLUE, Hoechst staining for total nuclei. Data are expressed as mean ± SEM (n = 3), *P < 0.05. G CCK-8 assay detecting cell viability at 24 h after transfection. Data are expressed as mean ± SEM (n = 4), **P < 0.01. H RT-qPCR analysis of proliferation-related genes, including CCNB1, CCND1, CCNE1, CDK1, and CDK4. Data are expressed as mean ± SEM (n = 3), *P < 0.05, **P < 0.01, ***P < 0.001. I Western blot analysis of proliferation-related gene protein level (CLOCK, CCNB1, CCND1, CCNE1, CDK4, and CDKN1A). GAPDH as a housekeeping protein. J Quantifying the Western blot analysis of CLOCK, CCNB1, CCND1, CCNE1, CDK4, and CDKN1A. Data are expressed as mean ± SEM (n = 3), *P < 0.05, **P < 0.01
Fig. 3
Fig. 3
CLOCK interference promotes GCs proliferation. A The interference efficiency of CLOCK was measured using RT-qPCR. Data are expressed as mean ± SEM (n = 5), **P < 0.01. B Western blotting reveals the expression levels of CLOCK. C Quantification of the western blot analysis. Data are expressed as mean ± SEM (n = 3), *P < 0.05. D EdU staining was used to detect the number of proliferating cells. RED, EdU-positive cells; BLUE, Hoechst staining for total nuclei. Data are expressed as mean ± SEM (n = 5), **P < 0.01. E CCK-8 assay detecting cell viability at 24 h after transfection. Data are expressed as mean ± SEM (n = 5), *P < 0.05. F RT-qPCR analysis of proliferation-related genes, including CCNB1, CCND1, CCNE1, CDK1, and CDK4. Data are expressed as mean ± SEM (n = 5), *P < 0.05, **P < 0.01. G Western blot analysis of proliferation-related gene protein level (CLOCK, CCNB1, CCNE1, CDK4, and CDKN1A). GAPDH as a housekeeping protein. H Quantifying the Western blot analysis of CLOCK, CCNB1, CCNE1, CDK4, and CDKN1A. Data are expressed as mean ± SEM (n = 3), *P < 0.05
Fig. 4
Fig. 4
Transcriptomic profiling of GCs with CLOCK overexpression treatment. A A volcano plot of the expressed genes. B Heatmap of the differentially expressed genes in GCs overexpressing CLOCK according to RNA-seq. C Gene ontology analysis. BP: biological process; CC: cellular component; MF: molecular function. D Kyoto Encyclopedia of Genes and Genomes pathway analysis. E RT-qPCR detected the expression levels of ASB9. Data are expressed as mean ± SEM (n = 3), **P < 0.01. F Quantitative statistics of ASB9. Data are expressed as mean ± SEM (n = 3), *P < 0.05. G Western blotting revealed the expression levels of ASB9
Fig. 5
Fig. 5
ASB9 overexpression inhibits GCs proliferation. A The overexpression efficiency of ASB9 was detected using RT-qPCR. Data are expressed as mean ± SEM (n = 6), ****P < 0.0001. B Western blotting reveals the expression levels of ASB9. C Quantitative statistics of ASB9. Data are expressed as mean ± SEM (n = 3), **P < 0.01. D Flow cytometry determines cell percentages in different cell cycle phases. E Cell cycle analysis statistical results. Data are expressed as mean ± SEM (n = 4), *P < 0.05. F EdU staining was used to detect the number of proliferating cells. RED, EdU-positive cells; BLUE, Hoechst staining for total nuclei. Data are expressed as mean ± SEM (n = 3), *P < 0.05. G CCK-8 assay detecting cell viability at 24 h after transfection. Data are expressed as mean ± SEM (n = 16), **P < 0.01. H RT-qPCR analysis of proliferation-related genes, including CCNB1, CCND1, CCNE1, CDK1, and CDK4. Data are expressed as mean ± SEM (n = 6), *P < 0.05, **P < 0.01. I Western blot analysis of proliferation-related gene protein level (ASB9, CCNB1, CCNE1, CDK4, and CDKN1A). J Quantifying the western blot analysis of ASB9, CCNB1, CCNE1, CDK4, and CDKN1A. Data are expressed as mean ± SEM (n = 3), *P < 0.05
Fig. 6
Fig. 6
ASB9 interference promotes GCs proliferation. A RT-qPCR detected the interference efficiency of ASB9. Data are expressed as mean ± SEM (n = 6), **P < 0.01. B Western blotting reveals the expression levels of ASB9. C Quantification of the western blot analysis. Data are expressed as mean ± SEM (n = 3), *P < 0.05. D EdU staining was used to detect the number of proliferating cells. RED, EdU-positive cells; BLUE, Hoechst staining for total nuclei. Data are expressed as mean ± SEM (n = 4), **P < 0.01. E CCK-8 assay detecting cell viability at 24 h after transfection. Data are expressed as mean ± SEM (n = 16), ****P < 0.0001. F RT-qPCR analysis of proliferation-related genes, including CCNB1, CCND1, CCNE1, CDK1, and CDK4. Data are expressed as mean ± SEM (n = 5), *P < 0.05, **P < 0.01. G Western blot analysis of proliferation-related gene protein level (ASB9, CCNB1, CCNE1, CDK4, and CDKN1A). H Quantifying the western blot analysis of CLOCK, CCNB1, CCNE1, CDK4, and CDKN1A. Data are expressed as mean ± SEM (n = 3), *P < 0.05, **P < 0.01. I RNA expression of ASB9 in GCs. ZT: zone time
Fig. 7
Fig. 7
CLOCK promotes the expression of ASB9 in GCs. A Sequence analysis of E-box on ASB9 promoter. B Mutated E-box sequences of the luciferase reporter. C and D Luciferase reporter assays of ASB9‐Luc reporter constructs. The wild-type and the mutant pGL3-ASB9 reporters were co-transfected into HEK293T cells with pcDNA3.1(+)/pcDNA3.1(+)-CLOCK plasim, and the fluorescence activity was detected 24 h later. Data are expressed as mean ± SEM (n = 5), *P < 0.05, ****P < 0.0001. E ChIP assay showing recruitment of CLOCK protein to ASB9 E‐box in GCs. The PCR products were analysed on a 2% agarose gel and quantified with densitometry using ImageJ software. IgG and no antibody were used as the negative ChIP control. Data are expressed as mean ± SEM (n = 3), *P < 0.05
Fig. 8
Fig. 8
Schematic diagram of CLOCK regulation on porcine GC proliferation. CLOCK inhibits cell proliferation by promoting ASB9 expression in porcine ovarian GCs. Specifically, CLOCK and BMAL1 complex binds to the E-box element of ASB9 promoter to increase the level of ASB9. Then, ASB9 inhibits GC proliferation by regulating cell cycle

References

    1. Li C, Liu Z, Wu G, Zang Z, Zhang JQ, Li X, et al. FOXO1 mediates hypoxia-induced G0/G1 arrest in ovarian somatic granulosa cells by activating the TP53INP1-p53-CDKN1A pathway. Development. 2021;148(14):dev199453. doi: 10.1242/dev.199453. - DOI - PubMed
    1. Li H, Wang X, Mu H, Mei Q, Liu Y, Min Z, et al. Mir-484 contributes to diminished ovarian reserve by regulating granulosa cell function via YAP1-mediated mitochondrial function and apoptosis. Int J Biol Sci. 2022;18(3):1008–1021. doi: 10.7150/ijbs.68028. - DOI - PMC - PubMed
    1. Shi S, Hu Y, Song X, Huang L, Zhang L, Zhou X, et al. Totipotency of miR-184 in porcine granulosa cells. Mol Cell Endocrinol. 2022;558:111765. doi: 10.1016/j.mce.2022.111765. - DOI - PubMed
    1. Chen M, Dong F, Chen M, Shen Z, Wu H, Cen C, et al. PRMT5 regulates ovarian follicle development by facilitating Wt1 translation. Elife. 2021;10:e68930. - PMC - PubMed
    1. Guo J, Zhang T, Guo Y, Sun T, Li H, Zhang X, et al. Oocyte stage-specific effects of MTOR determine granulosa cell fate and oocyte quality in mice. Proc Natl Acad Sci U S A. 2018;115(23):E5326–E5333. doi: 10.1073/pnas.1800352115. - DOI - PMC - PubMed

LinkOut - more resources