. 2023 Jun 6;14(1):154.
doi: 10.1186/s13287-023-03382-9.

Suspension culture improves iPSC expansion and pluripotency phenotype

Affiliations

Suspension culture improves iPSC expansion and pluripotency phenotype

Nerea Cuesta-Gomez et al. Stem Cell Res Ther. .

Abstract

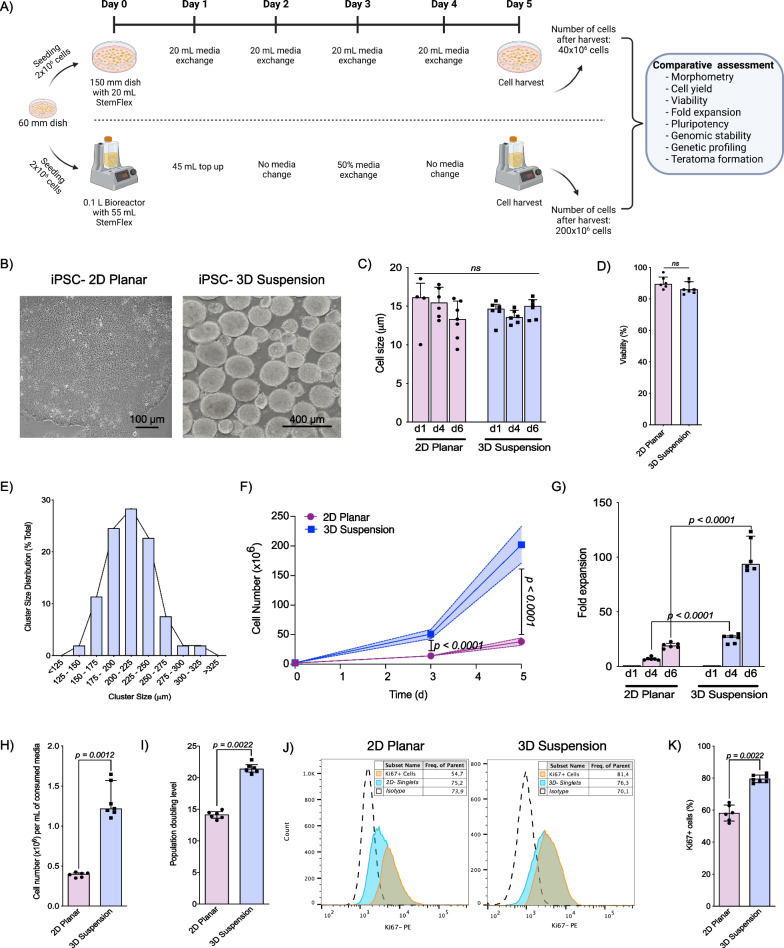
Background: Induced pluripotent stem cells (iPSCs) offer potential to revolutionize regenerative medicine as a renewable source for islets, dopaminergic neurons, retinal cells, and cardiomyocytes. However, translation of these regenerative cell therapies requires cost-efficient mass manufacturing of high-quality human iPSCs. This study presents an improved three-dimensional Vertical-Wheel® bioreactor (3D suspension) cell expansion protocol with comparison to a two-dimensional (2D planar) protocol.

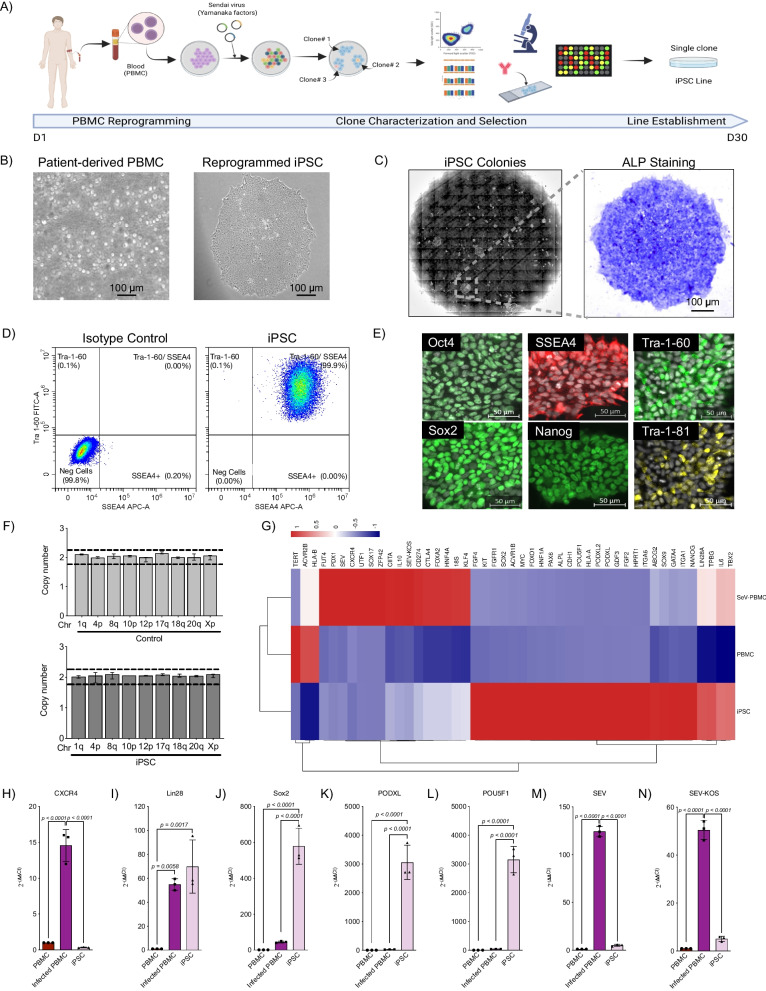
Methods: Sendai virus transfection of human peripheral blood mononuclear cells was used to establish mycoplasma and virus free iPSC lines without common genetic duplications or deletions. iPSCs were then expanded under 2D planar and 3D suspension culture conditions. We comparatively evaluated cell expansion capacity, genetic integrity, pluripotency phenotype, and in vitro and in vivo pluripotency potential of iPSCs.

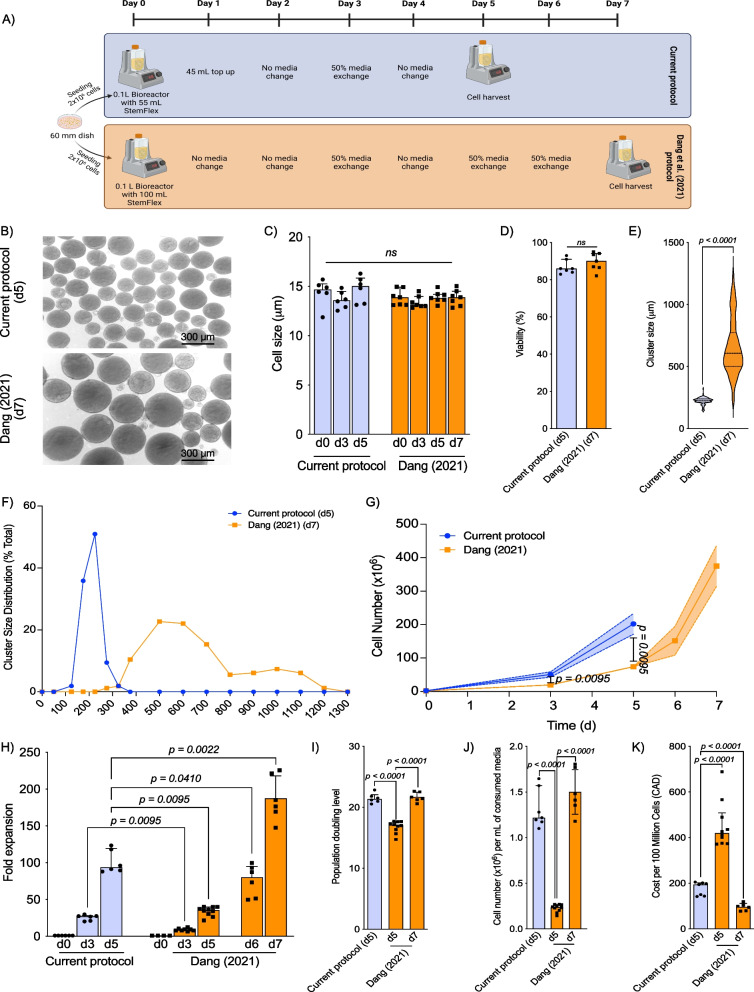
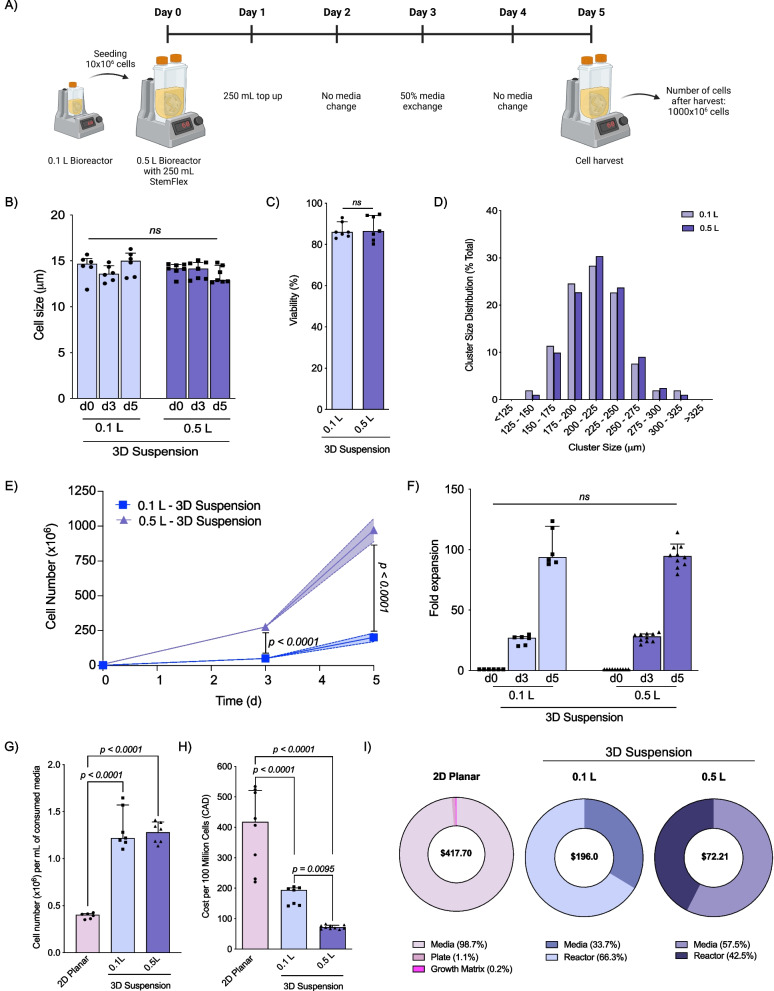
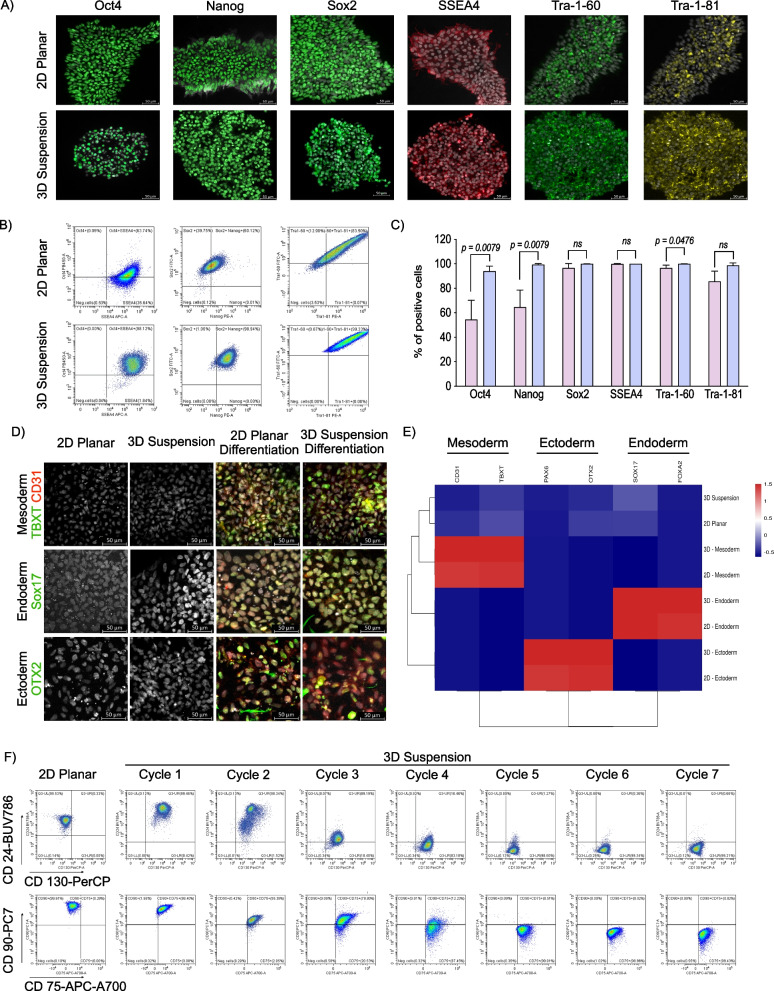
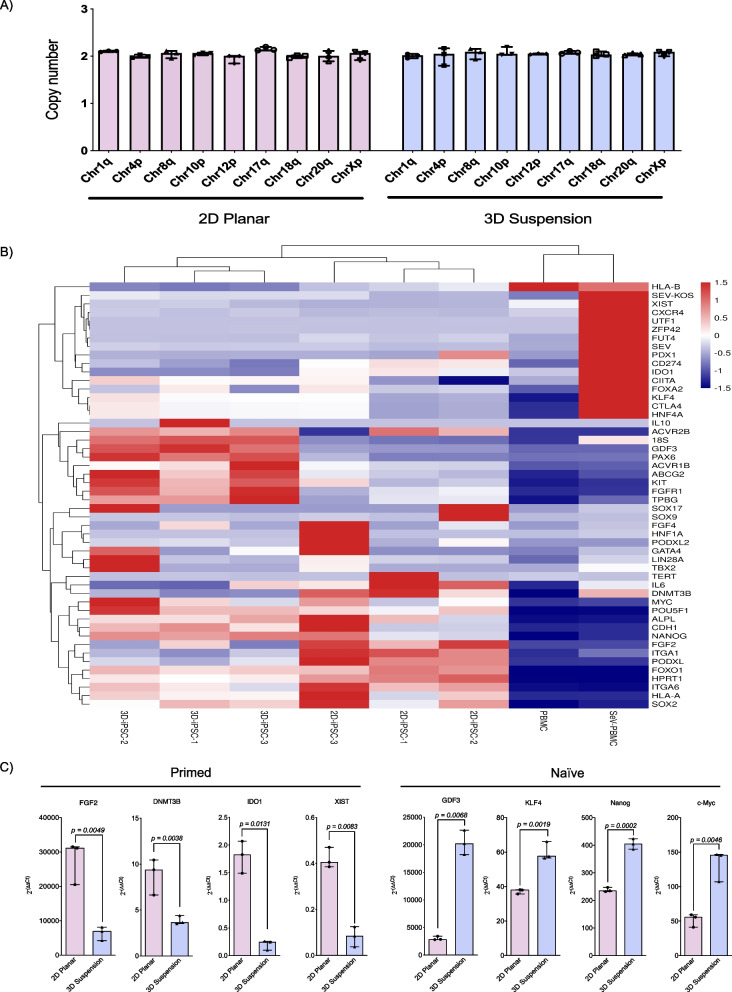
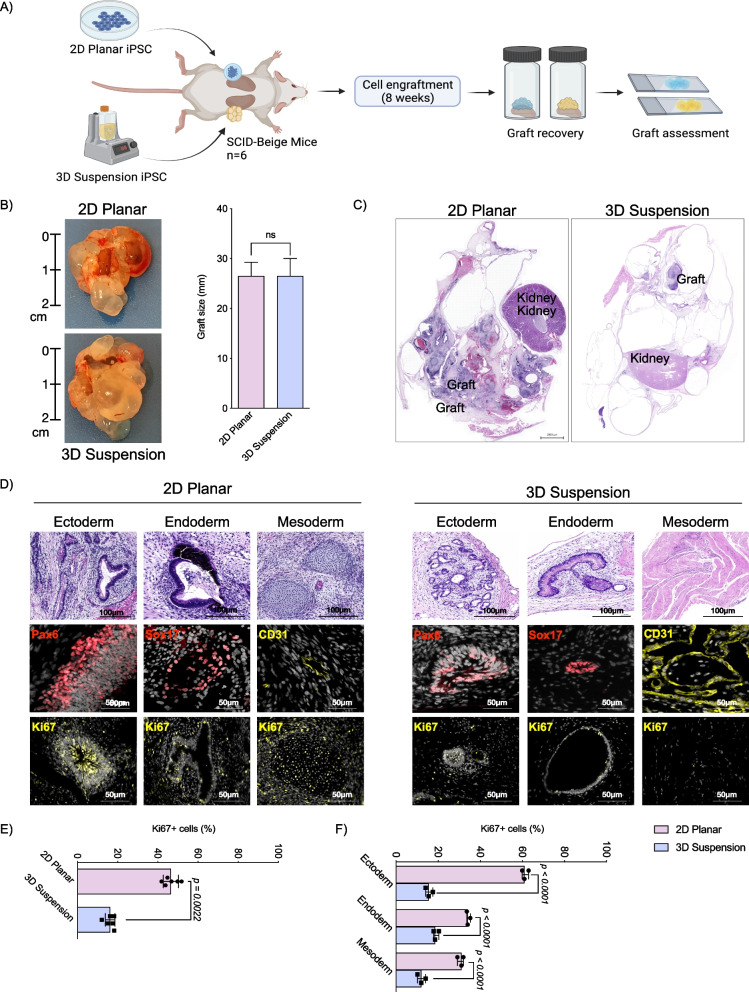
Results: Expansion of iPSCs using Vertical-Wheel® bioreactors achieved 93.8-fold (IQR 30.2) growth compared to 19.1 (IQR 4.0) in 2D (p < 0.0022), the largest expansion potential reported to date over 5 days. 0.5 L Vertical-Wheel® bioreactors achieved similar expansion and further reduced iPSC production cost. 3D suspension expanded cells had increased proliferation, measured as Ki67+ expression using flow cytometry (3D: 69.4% [IQR 5.5%] vs. 2D: 57.4% [IQR 10.9%], p = 0.0022), and had a higher frequency of pluripotency marker (Oct4+Nanog+Sox2+) expression (3D: 94.3 [IQR 1.4] vs. 2D: 52.5% [IQR 5.6], p = 0.0079). q-PCR genetic analysis demonstrated a lack of duplications or deletions at the 8 most commonly mutated regions within iPSC lines after long-term passaging (> 25). 2D-cultured cells displayed a primed pluripotency phenotype, which transitioned to naïve after 3D-culture. Both 2D and 3D cells were capable of trilineage differentiation and following teratoma, 2D-expanded cells generated predominantly solid teratomas, while 3D-expanded cells produced more mature and predominantly cystic teratomas with lower Ki67+ expression within teratomas (3D: 16.7% [IQR 3.2%] vs.. 2D: 45.3% [IQR 3.0%], p = 0.002) in keeping with a naïve phenotype.

Conclusion: This study demonstrates nearly 100-fold iPSC expansion over 5-days using our 3D suspension culture protocol in Vertical-Wheel® bioreactors, the largest cell growth reported to date. 3D expanded cells showed enhanced in vitro and in vivo pluripotency phenotype that may support more efficient scale-up strategies and safer clinical implementation.

Keywords: Bioreactor; Cell therapy; Expansion; Human-induced pluripotent stem cells; Pluripotency; Stem cells; iPSC.


Conflict of interest statement

AMJS serves as a consultant to ViaCyte Inc., Vertex Inc., Betalin Ltd., Hemostemix Inc. and Aspect Biosystems Ltd. No conflict of interest exists for all other co-authors.

Figures

Fig. 1
Fig. 1
Establishment of iPSC line from human peripheral blood mononuclear cells. A Overview of processes for generating an induced pluripotent stem cell line including patient blood collection (day 1), peripheral blood mononuclear cell isolation, infection with Yamanaka factors, optimal clone selection, and iPSC line establishment (day 30). B Microscopy of peripheral blood mononuclear cells and established iPSCs. C Characterization of pluripotency of the established iPSC line using alkaline phosphatase (ALP) staining. D Flow cytometric analysis of the selected iPSC line with isotype control and characterization of Tra-1-60 and SSEA4 expression. E Immunohistochemistry of the established iPSC line with expression of Oct4, Sox2, SSEA4, and Tra-1–60. F Quantitative PCR evaluation of the established iPSC line frequently for genetic abnormalities within iPSCs comparing to commercially available control DNA (n = 9, 3 per iPSC line) G Genetic microarray results comparing established iPSCs to fibroblasts and peripheral blood mononuclear cells (n = 3, 1 per iPSC line) H Differential expression of CXCR4,  I Lin28, J Sox2, K PODXL, L POU5F1, M SEV and N SEV-KOS in PBMC, infected PBMC and iPSC (n = 3)
Fig. 2
Fig. 2
Evaluation of iPSCs expanded in two-dimensional planar (2D) and three-dimensional suspension (3D) cell culture. A Schematic representation of the expansion protocols for 2D and 3D suspension conditions with summary of techniques used to compare cells. B Morphology of cells expanded in 2D planar cell culture and 3D suspension expansion within Vertical-Wheel® bioreactors C Cell size following 3D cluster dissociation and 2D cell passaging on days 0, 3, and 5 of expansion (n = 6). D Cell viability following 5 days of cell expansion comparing 2D and 3D conditions (n = 6). E Cluster size for cells grown in 3D conditions with frequency of clusters characterized (n = 3). F Absolute cell number expansion using 2D and 3D cell culture (n = 6). G Fold expansion following 3 and 5 days of cell expansion in 2D and 3D cell culture (n = 6). H Cell expansion per milliliter of consumed media following 5 days of cell expansion in 2D and 3D cell culture (n = 6 per group). I Population doubling level for cells expanded in 2D and 3D conditions (n = 6 per group). J Representation of the gating strategy followed for the quantification of Ki67+ cells in 2D and 3D conditions. K Ki67 expression of cells expanded in 2D and 3D conditions (n = 6 per group)
Fig. 3
Fig. 3
iPSC expansion comparison within Vertical-Wheel® bioreactors using the current protocol and replication of Dang et al. [28] protocols. A Schematic representation of the current protocol and the replicated Dang et al. [28] expansion protocol. B Cluster morphology at termination of iPSC expansion protocol using our current protocol or replicated Dang et al. [28] protocols. C Cell size following 3D cluster dissociation after expansion using the current protocol and replicated Dang et al. [28] protocol on days 0, 3, and 5 of expansion (n = 6). D Cell viability following 5 days of cell expansion comparing the current protocol and replicated Dang et al. [28] protocol (n = 6). E Cluster size for cells grown using the current protocol and replicated Dang et al. [28] protocol with frequency of clusters characterized (n = 6). F Cluster size distribution at termination of iPSC expansion protocol using the current protocol and replicated Dang et al. [28] protocol. G Absolute cell number expansion using the current protocol and replicated Dang et al. [28] protocol (n = 6). H Fold expansion following 3 and 5 days of cell expansion using the current protocol and 3, 5, 6 and 7 days of cell expansion using the replicated Dang et al. [28] protocol (n = 6). I Population doubling level for cells expanded using the current protocol and replicated Dang et al. [28] protocol (n = 6 per group). J Cell expansion per milliliter of consumed media following 5 days of cell expansion using the current protocol and 5 and 7 days of cell expansion using the replicated Dang et al. [28] protocol (n = 6 per group). K Cost of producing 100 × 106 cells in 2023 Canadian Dollars following 5 days or 5 and 7 days of cell expansion using the current protocol and replicated Dang et al. [28] protocol (n = 6 per group)
Fig. 4
Fig. 4
Comparison of expansion potential between 0.1 L and 0.5 L Vertical-Wheel® bioreactors. A Schematic representation of the expansion protocol used with 0.5 L Vertical-Wheel® bioreactor. B Cell size following 3D cluster dissociation from 0.1 L and 0.5 L Vertical-Wheel® bioreactor on days 0, 3, and 5 of expansion (n = 6). C Cell viability following 5 days of cell expansion comparing 2D and 3D conditions (n = 6). D Cluster size distribution for clusters grown in 0.1 L and 0.5 L Vertical-Wheel® bioreactors with frequency of clusters characterized (n = 3). E Absolute cell number expansion using 0.1 L and 0.5 L Vertical-Wheel® bioreactors (n = 6). F Fold expansion following 3 and 5 days of cell expansion in 0.1 L and 0.5 L Vertical-Wheel® bioreactors (n = 6). G Cell expansion per milliliter of consumed media following 5 days of cell expansion in 0.1 L and 0.5 L Vertical-Wheel® bioreactors and 2D planar conditions (n = 6). H Cost associated to the generation of 100 × 106 cells following 2D planar or 3D suspension conditions using 0.1 L or 0.5 L Vertical-Wheel® bioreactors. I Representation of cost associated to media, plate and growth matrix or reactor
Fig. 5
Fig. 5
Comparative quantification of pluripotency marker expression. A Immunohistochemistry evaluation of pluripotency marker expression for cells expanded using 2D and 3D cell culture. B Flow cytometric analysis to quantify pluripotency marker expression of iPSCs expanded in 2D and 3D conditions (n = 6 per group). Single stained results for the right panel can be found in Additional file 1: Fig. S1B. C Quantification of pluripotency marker expression of iPSCs expanded in 2D and 3D conditions (n = 6 per group). D Flow cytometric analysis to show the expression of CD24, CD130, CD90 and CD75 upon the transition of iPSCs from 2 to 3D conditions (n = 3 per group). E Comparison of the expression of key mesoderm, ectoderm and endoderm lineage associated genes among iPSCs cultured in 2D and 3D conditions as well as differentiated cells cultured under 2D and 3D conditions. F Flow cytometric analysis of the transition of primed to naïve cells. Single cells were selected and examined for the expression of CD24, CD130, CD90 and CD75
Fig. 6
Fig. 6
Comparative assessment of chromosomal stability and gene expression. A Quantitative PCR evaluation of the established iPSC line frequently for genetic abnormalities within cells expanded in 2D and 3D conditions (n = 3 per group). B Heat map showcasing differential gene expression between cells expanded in 2D and 3D conditions. C Differential expression in 2D and 3D of primed markers FGF2, DNMT3B, IDO1 and XIST, and naïve markers GDF3, KLF4, Nanog and c-Myc (all n = 3 per group)
Fig. 7
Fig. 7
Teratoma formation assessment and comparison between iPSC expansion protocols. A Overview of process used for teratoma assay to characterize in vivo maturation of iPSCs (n = 6 per group). B Teratomas excised from transplanted mice with size comparison of grafts achieved from cells expanded in 2D planar and 3D suspension conditions. C Hematoxylin and eosin (H&E) staining of iPSC grafts transplanted into the renal subcapsular space following 2D and 3D cell expansion. D Histological characterization of iPSC-derived tumors demonstrating structures compatible with the three germ layers compatible with teratomas using H&E staining. Immunohistochemistry staining of iPSC grafts transplanted into the renal subcapsular space following 2D and 3D cell expansion with staining for PAX6 (ectoderm), SOX17 (endoderm), and CD31 (mesoderm) markers. Immunohistochemistry evaluation of Ki67 expression within 2D and 3D derived iPSCs with quantification of expression E and F All analyses represent n = 3 per group

References

    1. Rezania A, Bruin JE, Arora P, Rubin A, Batushansky I, Asadi A, et al. Reversal of diabetes with insulin-producing cells derived in vitro from human pluripotent stem cells. Nat Biotechnol. 2014;32(11):1121–1133. doi: 10.1038/nbt.3033. - DOI - PubMed
    1. Hogrebe NJ, Maxwell KG, Augsornworawat P, Millman JR. Generation of insulin-producing pancreatic β cells from multiple human stem cell lines. Nat Protoc. 2021;16(9):4109–4143. doi: 10.1038/s41596-021-00560-y. - DOI - PMC - PubMed
    1. Velazco-Cruz L, Goedegebuure MM, Maxwell KG, Augsornworawat P, Hogrebe NJ, Millman JR. SIX2 regulates human β Cell differentiation from stem cells and functional maturation in vitro. Cell Rep. 2020;31(8):107687. doi: 10.1016/j.celrep.2020.107687. - DOI - PMC - PubMed
    1. Yabe SG, Fukuda S, Takeda F, Nashiro K, Shimoda M, Okochi H. Efficient generation of functional pancreatic β-cells from human induced pluripotent stem cells. J Diabetes. 2017;9(2):168–179. doi: 10.1111/1753-0407.12400. - DOI - PubMed
    1. Funakoshi S, Miki K, Takaki T, Okubo C, Hatani T, Chonabayashi K, et al. Enhanced engraftment, proliferation and therapeutic potential in heart using optimized human iPSC-derived cardiomyocytes. Sci Rep. 2016;6(1):19111. doi: 10.1038/srep19111. - DOI - PMC - PubMed

Publication types

Grants and funding