. 2023 Aug;10(23):e2301489.
doi: 10.1002/advs.202301489. Epub 2023 Jun 7.

Programmable Acoustic Holography using Medium-Sound-Speed Modulation

Affiliations

Programmable Acoustic Holography using Medium-Sound-Speed Modulation

Mingxin Xu et al. Adv Sci (Weinh). 2023 Aug.

Abstract

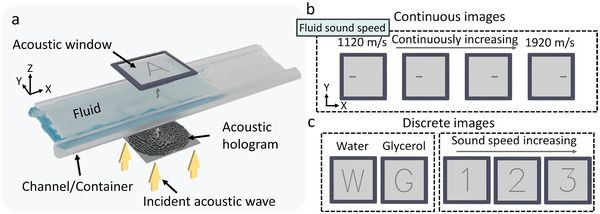
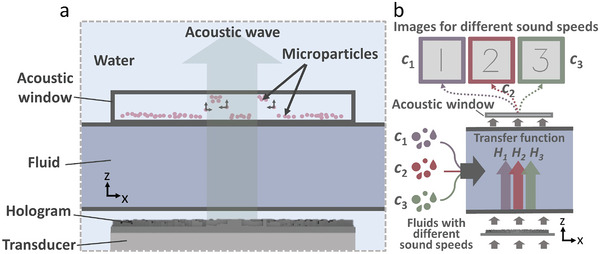
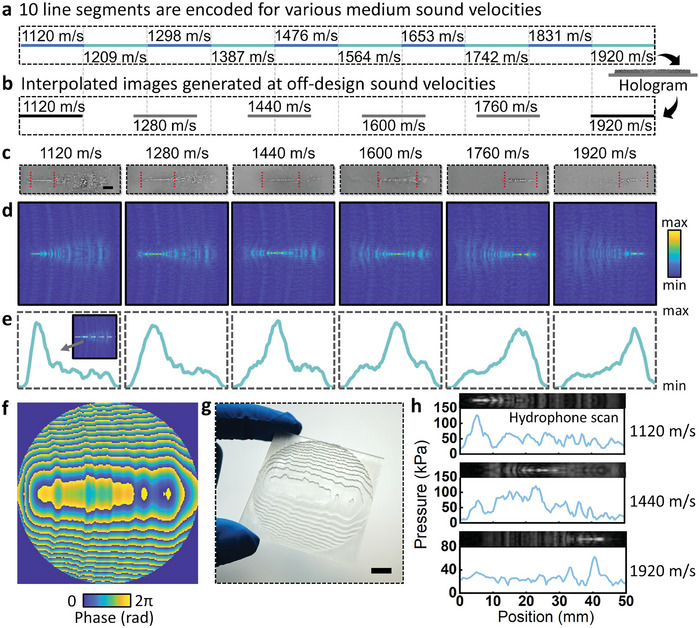
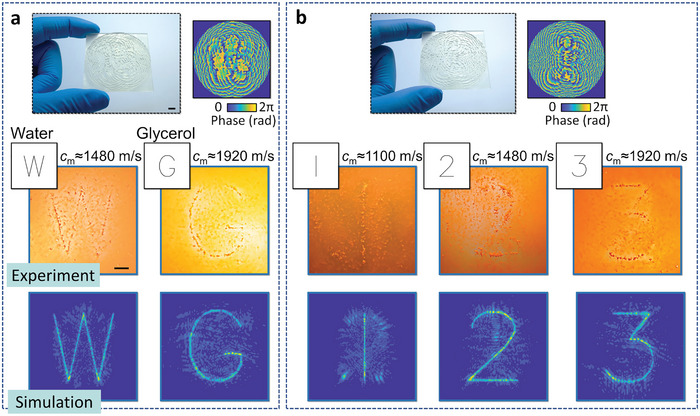
Acoustic holography offers the ability to generate designed acoustic fields to manipulate microscale objects. However, the static nature or large aperture sizes of 3D printed acoustic holographic phase plates limits the ability to rapidly alter generated fields. In this work, a programmable acoustic holography approach is demonstrated by which multiple discrete or continuously variable acoustic targets can be created. Here, the holographic phase plate encodes multiple images, where the desired field is produced by modifying the sound speed of an intervening fluid media. Its flexibility is demonstrated in generating various acoustic patterns, including continuous line segments, discrete letters and numbers, using this method as a sound speed indicator and fluid identification tool. This programmable acoustic holography approach has the advantages of generating reconfigurable and designed acoustic fields, with broad potential in microfluidics, cell/tissue engineering, real-time sensing, and medical ultrasound.

Keywords: acoustic hologram; fluid identification; micromanipulation; programmable acoustic field.


Conflict of interest statement

The authors declare no conflict of interest.

Figures

Figure 1
Figure 1
Schematic diagram of sound‐speed programmable holography. a) Incident acoustic waves are modulated by an acoustic hologram, generating different target acoustic fields in the acoustic window according to the sound velocity of the fluid. Particles in the acoustic window are patterned by the acoustic field. Programmable holograms can generate b) continuously variable and c) discrete images.
Figure 2
Figure 2
Principles of sound‐speed programmable holography. a) The acoustic waves generated by the transducer are modulated by the hologram and travel through a changeable fluid into the acoustic window, which patterns microparticles by concentrating them at the maximum acoustic intensity locations. b) Images corresponding to different medium sound speeds (and transfer functions) are encoded in a hologram. For the same incident wave, different images can be generated on the plane at z according to the medium sound speed. Supporting Information Figure S1 (Supporting Information) shows the dimensions and photos of the device.
Figure 3
Figure 3
Generating interpolated images at off‐design sound velocities. a) Encoded holographic target line segment images (ten), with increasing sound velocity from left to right (from 1120 to 1920 m s−1). b) Encoded holograms can generate interpolated images at arbitrary sound velocities in the range. c) Experimental results using PDMS microparticles at the sound velocities from b). d) Corresponding simulation results and e) midline acoustic pressure distributions. f) Acoustic hologram phase distribution. g) Printed hologram. Hydrophone scanning results and corresponding simulation results for medium sound velocities of h) 1120, 1440, and 1920 m s−1. Scale bars are 5 mm.
Figure 4
Figure 4
Multiple images encoded in static acoustic holograms. a) Here a hologram coded according to the initials of the media (water, left, and glycerol, right) provides an intuitive visual representation of the media. b) Number‐encoded hologram. Different numbers are generated with the use of different media (methanol, water and glycerol, from left to right). Scale bars are 5 mm.
Figure 5
Figure 5
Effect of design parameters on image quality, indicated by the peak signal‐to‐noise ratio (PSNR). a) Increased sound velocity range (Δc m) and reduced minimum sound velocity (c min) improve the reconstructed image quality. b) Image quality degrades as the number of images programmed in a hologram increases. PSNR is calculated based on the normalized target image magnitude and binary input image windowed to 108 × 68 pixels. Figure S4 (Supporting Information) shows the resulting images for Figure 5b.

References

    1. Maynard J. D., Williams E. G., Lee Y., J Acoust Soc Am 1985, 78, 1319.
    1. Mueller R. K., Proc IEEE Inst Electr Electron Eng 1971, 59, 1319.
    1. Wu S. F., J Acoust Soc Am 2004, 115, 207. - PubMed
    1. Brown M. D., Appl. Phys. Lett. 2019, 115, 053701.
    1. Hald J., J Acoust Soc Am 2016, 139, 1508. - PubMed