. 2022 Aug 20;9(8):859-867.
doi: 10.1364/optica.456894. Epub 2022 Jul 22.

Flexible method for generating needle-shaped beams and its application in optical coherence tomography

Affiliations

Flexible method for generating needle-shaped beams and its application in optical coherence tomography

Jingjing Zhao et al. Optica. .

Abstract

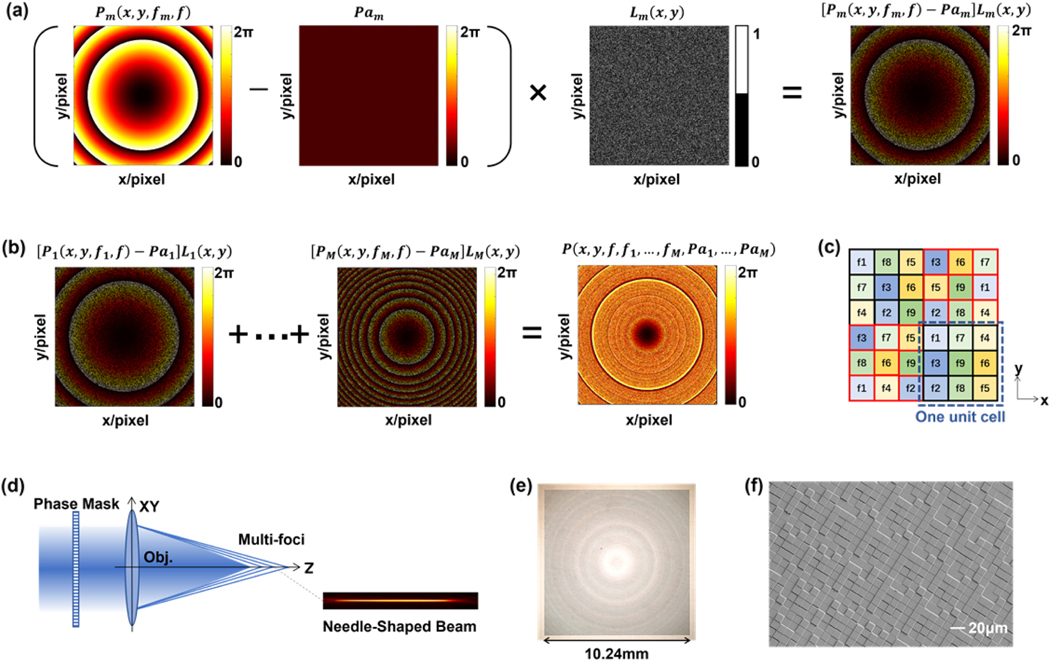
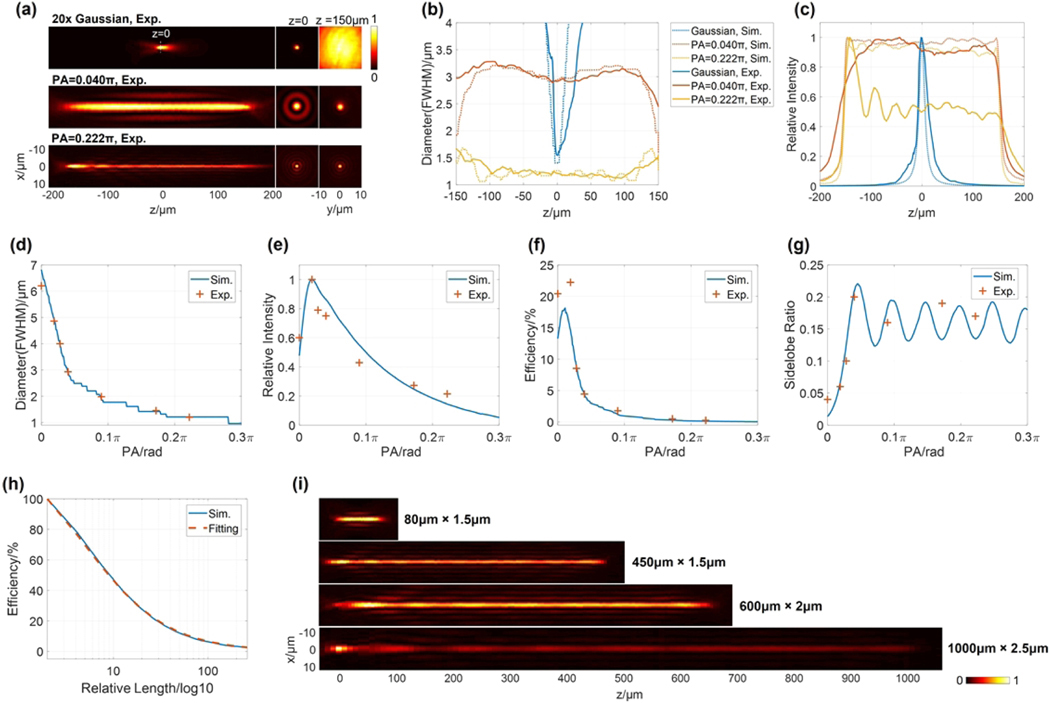
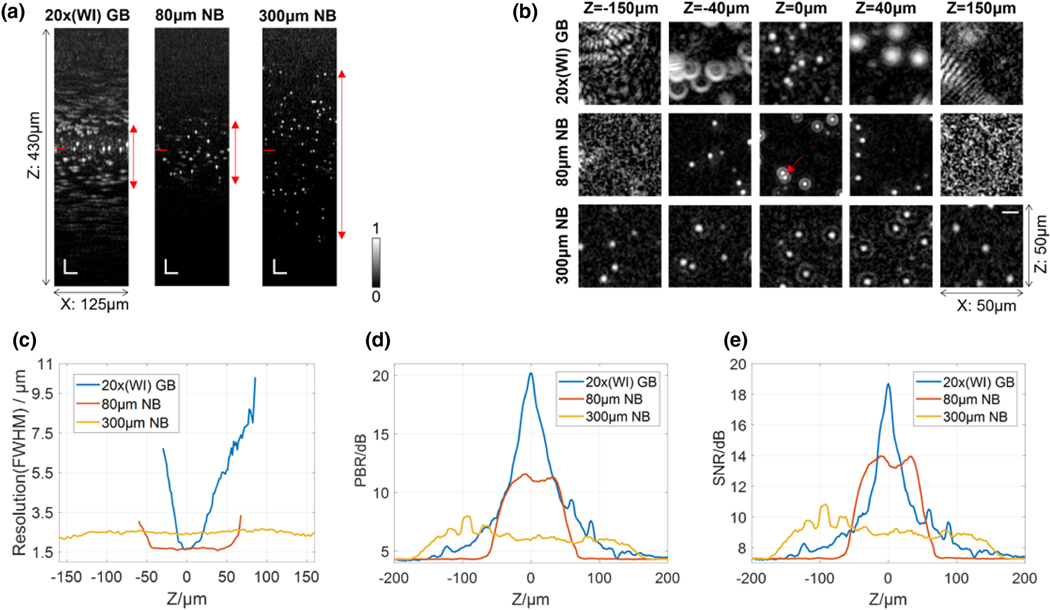
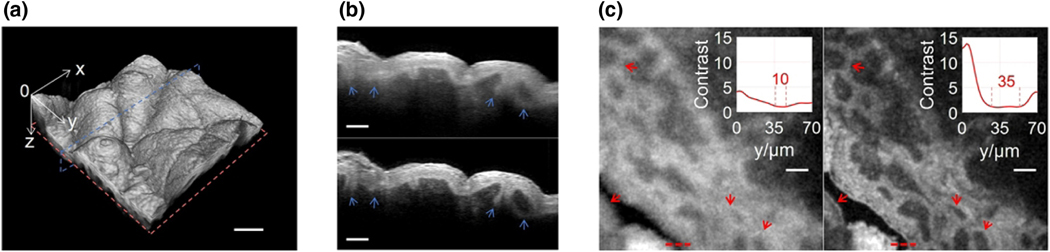
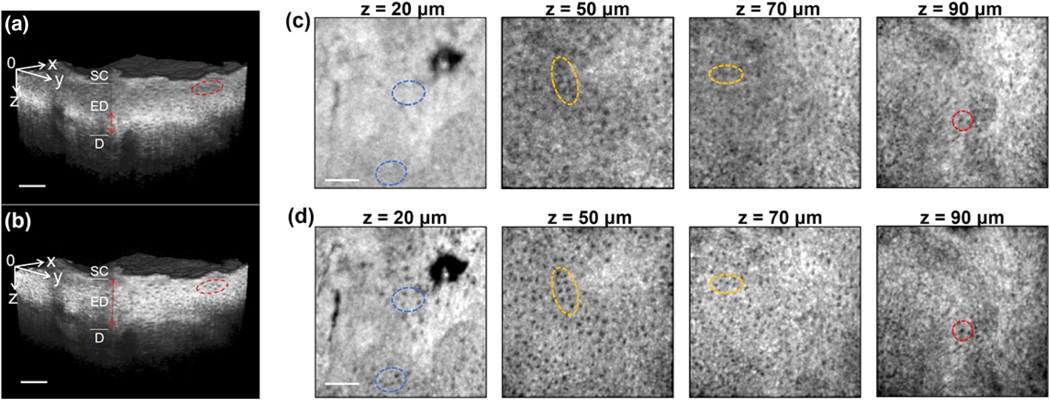
Needle-shaped beams (NBs) featuring a long depth-of-focus (DOF) can drastically improve the resolution of microscopy systems. However, thus far, the implementation of a specific NB has been onerous due to the lack of a common, flexible generation method. Here we develop a spatially multiplexed phase pattern that creates many axially closely spaced foci as a universal platform for customizing various NBs, allowing flexible manipulations of beam length and diameter, uniform axial intensity, and sub-diffraction-limit beams. NBs designed via this method successfully extended the DOF of our optical coherence tomography (OCT) system. It revealed clear individual epidermal cells of the entire human epidermis, fine structures of human dermal-epidermal junction in a large depth range, and a high-resolution dynamic heartbeat of alive Drosophila larvae.


Conflict of interest statement

Disclosures. The authors declare no conflicts of interest.

Figures

Fig. 1.
Fig. 1.
Principle. (a) Phase pattern Pm shifts the focus from f to fm, PaM is a phase adjuster whose functionality is discussed in Section 2.B and Figs. 2(d)–2(g), binary pattern Lm selects the pixels for Pm, and the combination (PmPam)Lm produces a focus at fm. (b) The pixels are divided to M groups to convey the phase patterns (P1Pa1)L1,,(PMPaM)LM; thus, the phase mask P has M foci positioned at f1,,fM. (c) Simple example of nine foci to explain how to allocate the pixels to different foci. Unit cells comprise 3 × 3 pixel grids, with each of the nine pixels being randomly assigned one of the nine foci. (d) The spatial multiplexed phase mask with an objective creates densely spaced foci to form a needle-shaped beam. (e) Optical photograph of the phase mask (diffractive optical element) and (f) its scanning electron micrograph.
Fig. 2.
Fig. 2.
Beam profiles. (a) Profiles of the Gaussian beam (20× lens) and two 300 μm NBs with the phase adjusters of Pam=0.040πm and 0.222πm.Pam=PAm and the focus index m{1,2,,81}. (b) Experimental and simulated diameter profiles of the three beams are congruent; (c) shows their axial intensity distributions. The effects of P A on seven 300 μm NBs’ (d) beam diameter, (e) beam intensity, (f) beam efficiency, and (g) sidelobe ratio at the middle ofa NB. (h) Simulation where P A = 0, proving beam efficiency is inversely proportional to the beam length (BL). Its fitting curve is (0.145rL + 1)−1, and rL=(BL2RL)/RL is the relative length. (i) Other NBs generated by the same 20× objective and incident Gaussian beam. NB, needle-shaped beam; Sim., simulated; Exp., experimental; RL, Raleigh length; FWHM, full width at half-maximum.
Fig. 3.
Fig. 3.
OCT images of 0.8 μm microbeads. The focused Gaussian beam (20× objective), 80 μm × 1.5 μm N B, and 300 μm × 3 μm NB are compared. (a) B-scan images where position z = 0 is marked by short red lines. White scale bars at bottom left corners, 25 μm. (b) XY planes at five depths. A red arrow identifies two closely adjacent beads, whose boundary is distinguishable even under the effect of the sidelobes. White scale bar in the last sub-image, 10 μm. (c) Lateral resolutions measured from bead sizes. The Gaussian beam’s plot begins at —30 μm and ends at 85 μm—outside this range, beads are barely recognizable. (d) Peak-to-background ratios (PBRs) along depth and (e) the signal-to-noise ratios (SNRs) in the bead images. GB, Gaussian beam; NB, needle-shaped beam; WI, water immersion.
Fig. 4.
Fig. 4.
Human skin imaging. (a) 3D image captured by 300 μm × 3 μm NB. Despite the wavy surface, all surface features are distinguishable due to the long DOF. Scale bar, 200 μm; XY= 1 mm × 1 mm. (b) B-scans at y = 360 μm, blue plane in (a). Indicated by blue arrows, the dermal-epidermal junction in deep regions are fuzzy in Gaussian imaging (upper) but clear in 300 μm NB imaging (lower). Scale bar, 100 μm. (c) XY images at z = 250 μm, red plane in (a). The left figure is taken by Gaussian beam, and the right is by 300 μm NB. Some comparisons are marked by red arrows. Two insets describe the contrast profiles along the red dashed lines. The contrast is the ratio of the intensity along the red dashed lines to the average intensity of the air gap (background). Scale bar, 100 μm.
Fig. 5.
Fig. 5.
Human skin epidermis. Gaussian beam was focused at 90 μm depth. 80 μm x 1.5 μm NB started at z = 20 μm and ended at z = 100 μm. (a) Volumetric data of Gaussian beam imaging. The bright and narrow layer marked by the red double-arrow line is within DOF. The cells in the red circle are fuzzy. (b) 3D data captured by 80 μm N B. (c), (d) XY images at five depths demonstrate the resolution disparity between Gaussian beam and 80 μm NB. Cells highlighted in red ellipses have good visibility with both beams while the cells in yellow ellipses are clear in 80 μm NB imaging but noisy in Gaussian beam imaging. Cells in blue ellipses are visible with 80 μm NB but completely disappear with Gaussian beam imaging. Scale bar, 100 μm; XY = 0.5 mm × 0.5 mm; SC, stratum corneum; ED, epidermis; D, dermis.

Similar articles

Cited by

References

    1. Grunwald R. and Bock M, “Needle beams: a review,” Adv. Phys. X 5, 1736950 (2020).
    1. Khonina SN, Kazanskiy NL, Karpeev SV, and Butt MA, “Bessel beam: significance and applications—a progressive review,” Micromachines 11, 997 (2020). - PMC - PubMed
    1. Li Y-C, Xin H-B, Lei H-X, Liu L-L, Li Y-Z, Zhang Y, and Li B-J, “Manipulation and detection of single nanoparticles and biomolecules by a photonic nanojet,” Light Sci. Appl 5, el 6176 (2016). - PMC - PubMed
    1. Gong Z, Pan Y-L, Videen G, and Wang C, “Optical trapping and manipulation of single particles in air: principles, technical details, and applications,” J. Quant. Spectrosc. Radiat. Transfer 214, 94–119 (2018).
    1. Duocastella M. and Arnold CB, “Bessel and annular beams for materials processing,” Laser Photon. Rev 6, 607–621 (2012).

LinkOut - more resources