. 2023 May 22:14:1190018.
doi: 10.3389/fimmu.2023.1190018. eCollection 2023.

Synovial monocytes contribute to chronic inflammation in childhood-onset arthritis via IL-6/STAT signalling and cell-cell interactions

Affiliations

Synovial monocytes contribute to chronic inflammation in childhood-onset arthritis via IL-6/STAT signalling and cell-cell interactions

Tobias Schmidt et al. Front Immunol. .

Abstract

Introduction: Monocytes are key effector cells in inflammatory processes. We and others have previously shown that synovial monocytes in childhood-onset arthritis are activated. However, very little is known about how they contribute to disease and attain their pathological features. Therefore, we set out to investigate the functional alterations of synovial monocytes in childhood-onset arthritis, how they acquire this phenotype, and whether these mechanisms could be used to tailorize treatment.

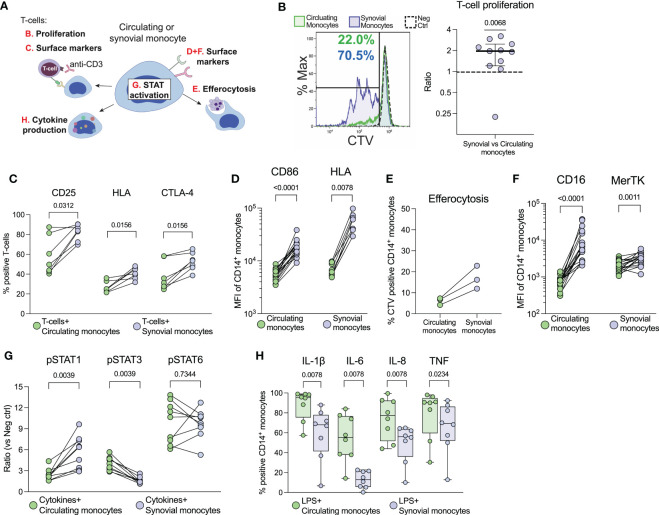
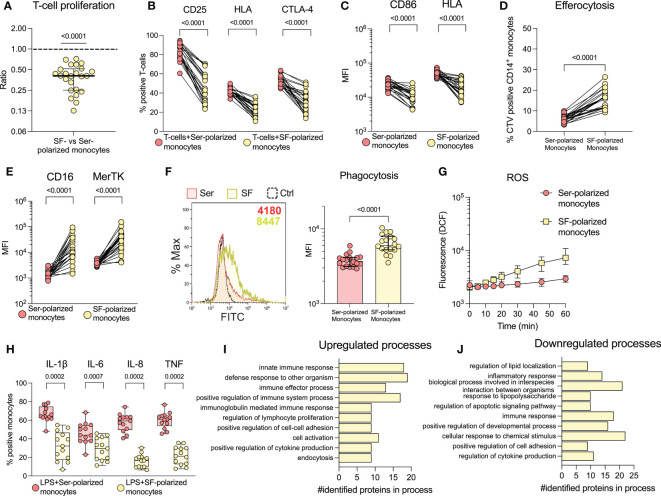
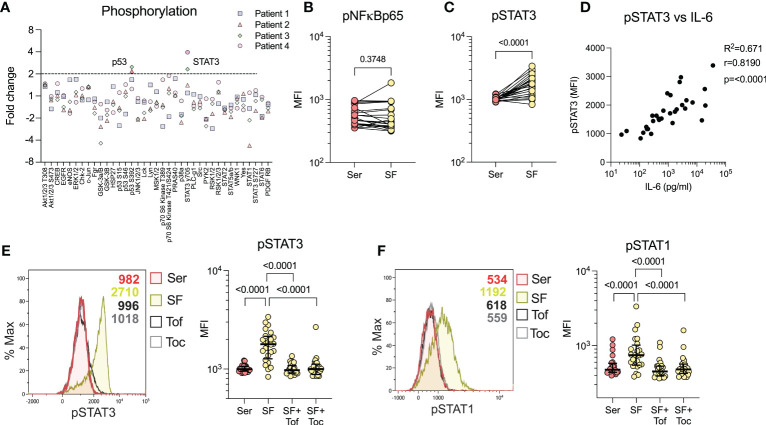
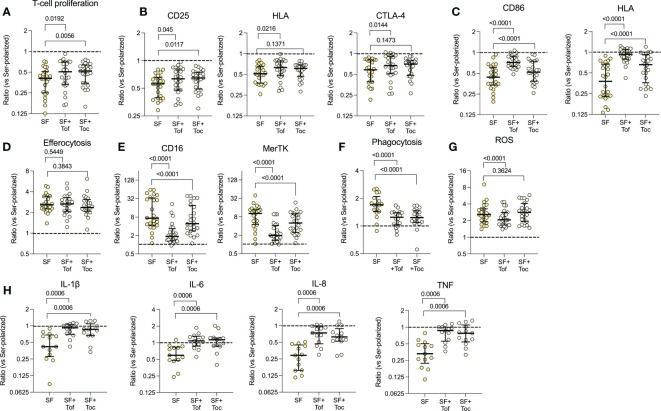
Methods: The function of synovial monocytes was analysed by assays believed to reflect key pathological events, such as T-cell activation-, efferocytosis- and cytokine production assays using flow cytometry in untreated oligoarticular juvenile idiopathic arthritis (oJIA) patients (n=33). The effect of synovial fluid on healthy monocytes was investigated through mass spectrometry and functional assays. To characterize pathways induced by synovial fluid, we utilized broad-spectrum phosphorylation assays and flow cytometry, as well as inhibitors to block specific pathways. Additional effects on monocytes were studied through co-cultures with fibroblast-like synoviocytes or migration in transwell systems.

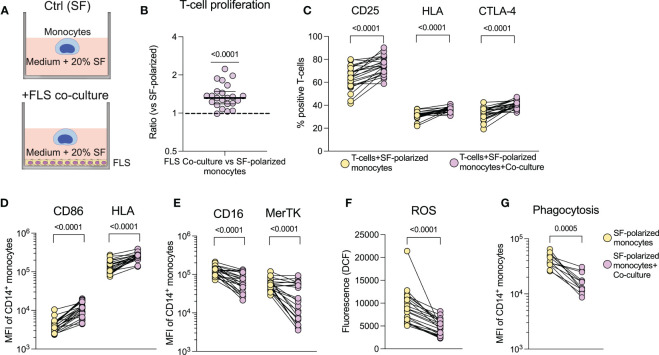
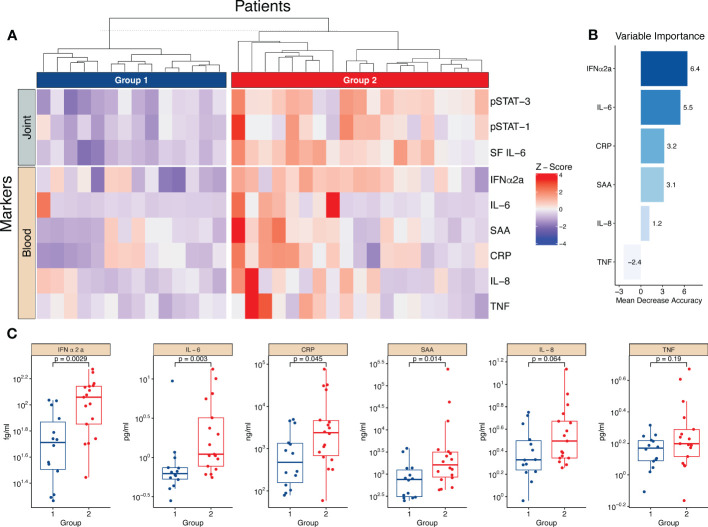
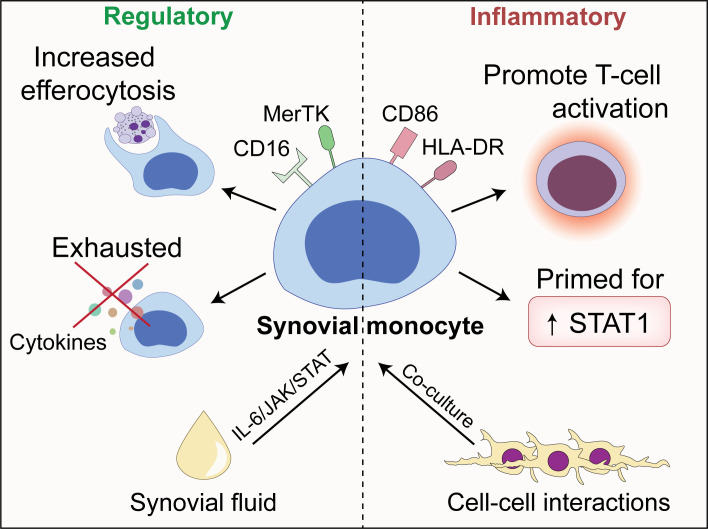
Results: Synovial monocytes display functional alterations with inflammatory and regulatory features, e.g., increased ability to induce T-cell activation, resistance to cytokine production following activation with LPS and increased efferocytosis. In vitro, synovial fluid from patients induced the regulatory features in healthy monocytes, such as resistance to cytokine production and increased efferocytosis. IL-6/JAK/STAT signalling was identified as the main pathway induced by synovial fluid, which also was responsible for a majority of the induced features. The magnitude of synovial IL-6 driven activation in monocytes was reflected in circulating cytokine levels, reflecting two groups of low vs. high local and systemic inflammation. Remaining features, such as an increased ability to induce T-cell activation and markers of antigen presentation, could be induced by cell-cell interactions, specifically via co-culture with fibroblast-like synoviocytes.

Conclusions: Synovial monocytes in childhood-onset arthritis are functionally affected and contribute to chronic inflammation, e.g., via promoting adaptive immune responses. These data support a role of monocytes in the pathogenesis of oJIA and highlight a group of patients more likely to benefit from targeting the IL-6/JAK/STAT axis to restore synovial homeostasis.

Keywords: IL-6; inflammation; juvenile idiopathic arthritis – JIA; monocyte; rheumatology; synovial fluid (SF).


Conflict of interest statement

The authors declare that the research was conducted in the absence of any commercial or financial relationships that could be construed as a potential conflict of interest.

Figures

Figure 1
Figure 1
Synovial monocytes from patients with oJIA induce T-cell proliferation, display increased efferocytosis and a resistance to further activation. (A) Schematic overview of the various analyses of synovial- vs. circulating monocytes. (B) T-cells were isolated from healthy controls and stained with CellTrace Violet (CTV). They were subsequently activated with anti-CD3 and co-cultured with isolated monocytes for 72hrs, before being analysed for proliferation (presented as the ratio of percent proliferation induced by synovial- vs. circulating monocytes, line at median with IQR, n=11) and (C) expression of activation markers on T-cells by flow cytometry (n=7). (D) Shows expression of markers related to antigen presentation on monocytes [CD86 (n=17) and HLA (n=8)]. (E) As a measurement of clearance, isolated monocytes were incubated with CTV-stained apoptotic neutrophils (n=3), and the percent of CTV-positive CD14+CD66b- monocytes is presented (reflecting uptake of neutrophils). (F) Shows expression of markers related to clearance on monocytes (CD16 and MerTK, n=17). (G) Monocytes in synovial fluid or blood were activated with IFNγ, IL-4 and IL-6 and investigated for their phosphorylation response of STATs (n=9). Values represent the ratio between stimulated vs. unstimulated samples. (H) Cytokine production of monocytes was studied intracellularly by incubation with golgiplug, followed by LPS activation (n=8). Statistics were performed using one sample Wilcoxon signed-rank test (with the hypothetical median of 1) or Wilcoxon matched pairs signed rank test. oJIA, Oligoarticular juvenile idiopathic arthritis; MFI, Median fluorescence intensity; IFN, Interferon; IL, Interleukin; STAT, Signal transducer and activator of transcription; CTV, Cell Trace Violet; LPS, Lipopolysaccharide; TNF, Tumour necrosis factor.
Figure 2
Figure 2
Synovial fluid induces a regulatory phenotype in healthy monocytes and downregulates co-stimulatory capabilities. Monocytes were isolated from healthy controls and polarized with 20% serum (Ser) or 20% synovial fluid (SF) overnight. Polarized monocytes were co-cultured with CellTrace violet (CTV) stained healthy CD3-activated T-cells and analysed by flow cytometry for (A) proliferation (n=24, data is presented as the ratio of proliferation induced by SF-polarized monocytes vs. serum-polarized monocytes) and (B) activation markers on T-cells (n=24). (C) Shows expression of CD86 and HLA in monocytes (n=24). (D) Monocytes were incubated with CTV-stained apoptotic neutrophils and analysed for uptake of these cells. The percentage of CTV positive CD14+CD66b- monocytes is shown (n=21). (E) Displays the expression of CD16 and MerTK in monocytes. (F) Phagocytosis of polarized monocytes was assessed following incubation with opsonized FITC labelled beads (n=18). (G) ROS production of polarized monocytes stained with H2DCFDA at different time points (n=24, median with interquartile range). (H) Cytokine production of polarized monocytes was studied intracellularly following LPS activation (n=13). Changes in monocyte proteomics were analysed (n=3) through biological process enrichment, and the top 10 (I) upregulated and (J) downregulated processes following polarization are presented. Statistical analyses were performed using one sample Wilcoxon signed-rank test (with the hypothetical median of 1) or Wilcoxon matched pairs signed rank test. Lines at median with IQR. MFI, Median fluorescence intensity; IL, Interleukin; CTV, Cell Trace Violet; LPS, Lipopolysaccharide; ROS, Reactive oxygen species; TNF, Tumour necrosis factor.
Figure 3
Figure 3
Synovial fluid predominately induces STAT3 phosphorylation through IL-6. (A) Broad spectrum phosphorylation array of 37 kinases following 20% synovial fluid (SF) stimulation of healthy monocytes compared to serum (n=4). (B) Analysis of NFkBp65 phosphorylation with SF vs. serum (Ser) stimulation by flow cytometry (n=24). (C) Analysis of STAT3 phosphorylation with SF (n=24) by flow cytometry. (D) Shows correlation between levels of STAT3 phosphorylation in monocytes versus IL-6 in the SF (n=33, Spearman correlation). (E) SF stimulation and STAT3 phosphorylation analysis, with pre-treatment of monocytes with tofacitinib (1µM) or tocilizumab (100ng/ml) and (F) STAT1 phosphorylation (n=24). Data is presented as median with IQR. MFI, Median fluorescence intensity; IL, Interleukin; STAT, Signal transducer and activator of transcription; Tof, Tofacitinib; Toc, Tocilizumab.
Figure 4
Figure 4
The IL-6/JAK/STAT axis is responsible for several of the phenotypical effects induced by synovial fluid. Healthy monocytes were pre-treated with or without tofacitinib (Tof, 1µM) or tocilizumab (Toc, 100ng/ml) and then polarized with 20% serum (Ser) or 20% synovial fluid (SF). Polarized monocytes were incubated with healthy CellTrace Violet (CTV) stained anti-CD3 activated T-cells for 72hrs and assessed for (A) proliferation of T-cells (n=24) and (B) activation markers on the T-cells. (C) Shows expression of CD86 and HLA in polarized monocytes (n=24). (D) Efferocytosis of CTV-stained apoptotic neutrophils by CD14+CD66b- monocytes (n=21). (E) CD16 and MerTK expression in polarized monocytes. (F) Phagocytosis of opsonized FITC labelled beads (n=18). (G) Shows ROS production after 1hr of incubation following H2DCFDA staining (n=24). (H) Intracellular cytokine production following pre-incubation with golgiplug and LPS activation for 4 hrs (n=13). Data represents the ratio vs. serum-polarized monocytes, and the dotted lines represents a ratio of 1:1. Full lines at median with IQR, Wilcoxon matched pairs signed rank test. ROS, reactive oxygen species; CTV, Cell Trace Violet; LPS, Lipopolysaccharide; MFI, Median fluorescence intensity; IL, Interleukin; STAT, Signal transducer and activator of transcription; Tof, Tofacitinib; Toc, Tocilizumab; LPS, Lipopolysaccharide; TNF, Tumor necrosis factor.
Figure 5
Figure 5
Increased co-stimulatory capabilities of synovial monocytes are induced in vitro in healthy monocytes through co-culture with fibroblast-like synoviocytes. (A) Experimental setup of the co-culture assay. (B) Monoculture of monocytes (SF) and monocytes co-cultured with FLS (Co-culture) were detached following overnight culture and seeded with CellTrace Violet (CTV) stained anti-CD3 activated T-cells, which were cultured (1:10 monocytes to T-cells) for 72hrs, followed by analysis of proliferation (displayed as ratio of percent proliferation between FLS co-culture vs. monoculture of monocytes) and (C) expression of activation markers in T-cells (n=23). (D) Shows changes in surface expression of CD86 and HLA and (E), of CD16 and MerTK. (F) Displays ROS production after 1hr incubation following H2DCFDA staining (n=23) and (G) phagocytosis of opsonized FITC labelled beads (n=12). Statistics were performed using one sample Wilcoxon signed-rank test (with the hypothetical median of 1) or Wilcoxon matched pairs signed rank test. Lines at median with IQR. FLS, Fibroblast,like synoviocytes; ROS, Reactive oxygen species; MFI, Median fluorescence intensity; SF, Synovial fluid.
Figure 6
Figure 6
The magnitude of the synovial IL-6/JAK/STAT axis is reflected in several circulating markers of inflammation. (A) Heatmap showing hierarchical clustering into two groups based on three parameters, synovial (joint) IL-6 levels and monocyte pSTAT1- and pSTAT3 activation. It further shows the distribution of circulating (blood) markers of inflammation measured in plasma. (B) Shows the importance score of the circulating markers in predicting the two groups based on a random forest predictive model. (C) Displays the statistical difference between group one and two regarding the levels of circulating markers. Statistical analyses between groups were performed using Mann-Whitney U test. SF, Synovial fluid; IFN, Interferon; CRP, C,reactive protein; SAA, Serum amyloid A; TNF, Tumor necrosis factor.
Figure 7
Figure 7
An illustrative overview of the main findings presented in this paper.

Similar articles

Cited by

References

    1. Kumar RA, Li Y, Dang QJ, Yang F. Monocytes in rheumatoid arthritis: circulating precursors of macrophages and osteoclasts and, their heterogeneity and plasticity role in RA pathogenesis. Int Immunopharmacol (2018) 65:348–59. doi: 10.1016/j.intimp.2018.10.016 - DOI - PubMed
    1. Myles A, Aggarwal A. Expression of toll-like receptors 2 and 4 is increased in peripheral blood and synovial fluid monocytes of patients with enthesitis-related arthritis subtype of juvenile idiopathic arthritis. Rheumatology (2011) 50(3):481–8. doi: 10.1093/rheumatology/keq362 - DOI - PubMed
    1. Tardito S, Martinelli G, Soldano S, Paolino S, Pacini G, Patane M, et al. . Macrophage M1/M2 polarization and rheumatoid arthritis: a systematic review. Autoimmun Rev (2019) 18(11):102397. doi: 10.1016/j.autrev.2019.102397 - DOI - PubMed
    1. Murray PJ. Macrophage polarization. Annu Rev Physiol (2017) 79:541–66. doi: 10.1146/annurev-physiol-022516-034339 - DOI - PubMed
    1. Ambarus CA, Noordenbos T, de Hair MJ, Tak PP, Baeten DL. Intimal lining layer macrophages but not synovial sublining macrophages display an IL-10 polarized-like phenotype in chronic synovitis. Arthritis Res Ther (2012) 14(2):R74. doi: 10.1186/ar3796 - DOI - PMC - PubMed

Publication types

Supplementary concepts