Review
. 2022 Jul 26;6(9):bvac109.
doi: 10.1210/jendso/bvac109. eCollection 2022 Sep 1.

A Novel Mouse Model to Analyze Non-Genomic ERα Physiological Actions

Affiliations
Review

A Novel Mouse Model to Analyze Non-Genomic ERα Physiological Actions

Yukitomo Arao et al. J Endocr Soc. .

Abstract

Nongenomic effects of estrogen receptor α (ERα) signaling have been described for decades. Several distinct animal models have been generated previously to analyze the nongenomic ERα signaling (eg, membrane-only ER, and ERαC451A). However, the mechanisms and physiological processes resulting solely from nongenomic signaling are still poorly understood. Herein, we describe a novel mouse model for analyzing nongenomic ERα actions named H2NES knock-in (KI). H2NES ERα possesses a nuclear export signal (NES) in the hinge region of ERα protein resulting in exclusive cytoplasmic localization that involves only the nongenomic action but not nuclear genomic actions. We generated H2NESKI mice by homologous recombination method and have characterized the phenotypes. H2NESKI homozygote mice possess almost identical phenotypes with ERα null mice except for the vascular activity on reendothelialization. We conclude that ERα-mediated nongenomic estrogenic signaling alone is insufficient to control most estrogen-mediated endocrine physiological responses; however, there could be some physiological responses that are nongenomic action dominant. H2NESKI mice have been deposited in the repository at Jax (stock no. 032176). These mice should be useful for analyzing nongenomic estrogenic responses and could expand analysis along with other ERα mutant mice lacking membrane-bound ERα. We expect the H2NESKI mouse model to aid our understanding of ERα-mediated nongenomic physiological responses and serve as an in vivo model for evaluating the nongenomic action of various estrogenic agents.

Keywords: estrogen; estrogen receptor alpha; extranuclear signaling; knock-in mutant mouse; nongenomic action.


Figures

Figure 1.
Figure 1.
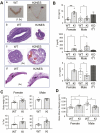
Generation of H2NESKI. (A) Schematic illustration of the targeting strategy used to introduce mutation. Diagrams show the wild-type (WT) estrogen receptor α (ERα) locus (endogenous locus), targeting construct (H2NESKI vector), targeted mutant allele in the embryonic stem cells/chimeric mice (targeted locus), and F1 mutant allele after crossed with the Frt deleter mouse (mutant locus). The targeting construct contained ERα exon 6 including the mutations (gray box, the sequence shows in the bottom of A), Frt (gray triangle) flanked neomycin resistance cassette, and diphtheria toxin A cassette. Checked bars suggest the position of the probe for Southern blot analysis. Representative results of Southern blot analysis show. (B) Representative results of Western blot probed for the ERα and glyceraldehyde 3-phosphate dehydrogenase (GAPDH) in the ovariectomized female liver with or without estradiol (E2) treatment show. GAPDH was used as a loading control. Ut indicates the reference control prepared from E2-treated ovariectomized WT uterus. (C) Top and middle panels show the representative results of uterine ERα immunohistochemistry. The tissue was collected from the ovariectomized uterus with or without E2 treatment. Bar indicates 50 µm. Bottom panels show a higher power view of E2-treated WT and H2NESKI uterus. Bar indicates 25 µm. Abbreviations: E, E2 treatment; V, vehicle; M, molecular marker.
Figure 2.
Figure 2.
General phenotype of H2NESKI. (A) Morphology and histology of H2NESKI female reproductive organs. Representative results from wild-type (WT; left) and H2NESKI (right) are shown. (a) The morphology of uterus and ovary. WT picture is enlarged 1.5×. (b) Histology of uterine tissue. The result of hematoxylin and eosin (H&E) staining section is shown. (c) Histology of ovarian tissues. The result of H&E staining section is shown. WT picture is enlarged 2×. (d) The result of whole-mount Carmine Alum staining mammary tissue. WT picture is enlarged 2×. (B) Serum hormone levels of WT and H2NESKI (KI) females and males. The serum was collected from intact animals. Top, estradiol. Middle, testosterone. Bottom, luteinizing hormone. Hormone levels of estrogen receptor α null (KO) females have analyzed 2 pooled serum samples showing as a reference. The graphs show mean ± SE of the mean (SEM). Two-way analysis of variance (ANOVA) with multiple comparison test was performed to indicate a significant difference between genotypes. (C) Body weight and body fat percentage of WT and KI females and males. The graphs show mean ± SEM. Unpaired t-test was performed to indicate a significant difference. Two-tailed P-value was analyzed. (D) Bone mineral density of WT and KI females and males. The graphs show mean ± SEM. Two-way ANOVA with multiple comparison test was performed to indicate significant difference. *P < 0.05, **P < 0.01, ***P < 0.001, ****P < 0.0001. Abbreviation: ns, nonsignificant difference.
Figure 3.
Figure 3.
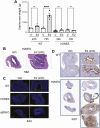
Uterotropic responses of H2NESKI female. (A) Uterine wet weight after vehicle (Veh) or E2 10 μg/kg treatments for 24 hours [wild-type (WT) Veh n = 4, estradiol (E2) n = 4; H2NES Veh n = 3, E2 n = 4] and 3 consecutive days (72 hours; WT Veh n = 4, E2 n = 4; H2NES Veh n = 3, E2 n = 4). The graph shows mean ± SE of the mean. Two-way analysis of variance with multiple comparison test was performed to indicate a significant difference between vehicle and E2 treatment. ****P < 0.0001. (B) The representative hematoxylin and eosin stained uteri from 24-hour Veh or E2-treated H2NESKI mice. (C) Uterine 5-ethynyl-2’-deoxyuridine (EdU) incorporation in the 24-hour Veh or E2-treated mice. 4’,6-diamidino-2-phenylindole dihydrochloride was used as a counterstain to visualize tissue. The representative result is shown. (D) Immunostaining with the anti-Ki67 antibody for 24-hour Veh or E2-treated mouse uteri. Abbreviation: ns, nonsignificant difference.
Figure 4.
Figure 4.
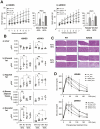
Fat metabolism under the high-fat diet (HFD) treatment. (A) (a), Body weight in wild-type (WT) and H2NESKI (KI) fed 45% HFD (WT n = 8, KI n = 8) or 60% HFD (WT n = 8, KI n = 8). (b) Body weight in WT and αERKO (KO) fed 45% HFD (WT n = 8, KO n = 8) or 60% HFD (WT n = 4, KO n = 4). The HFD dependent body weight gain is shown until 7 weeks of HFD feeding because we analyzed the glucose tolerance test at the eighth week that affected body weight gain. The area under the curve was analyzed to compare the difference between genotypes on the diet and the difference between diets in each genotype. The graphs show mean ± SE of the mean. One-way analysis of variance (ANOVA) with Tukey’s multiple comparisons test was performed. (B) Proportional tissue weight of HFD fed H2NESKI (left) and αERKO (right) females. (a) Liver. (b) Visceral fat. (c) Inguinal fat. (d) Brown adipose tissue. (e) Gonadal fat. The graphs show mean ± SD. One-way ANOVA with Tukey’s multiple comparisons test was performed. We compared the effect of genotype on each diet and the effect of diet on each genotype. The graphs (A and B) show the significant difference *P < 0.05, **P < 0.01, ***P < 0.001, ****P < 0.0001. (C) Histology of hepatosteatosis in the HFD-fed H2NESKI females is shown. Results show the lowest (L) and highest (H) degrees of steatosis in the group. Left panels in each genotype show a 4× view. Right panels in each genotype show a 40× view. (D) Glucose tolerance test of HFD-fed H2NESKI and αERKO females.
Figure 5.
Figure 5.
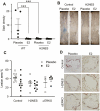
Cardiovascular responses of H2NESKI. (A) Estradiol (E2) or placebo-treated ovariectomized (OVX) females [wild-type (WT) placebo n = 5, E2 n = 7; H2NES placebo n = 8, E2 n = 8] were treated with perivascular electric injury on the distal portion of the common carotid artery. The en face denuded area 4 days after injury was measured. The graph shows the values of individual animals and mean ± SE of the mean (SEM). 1-way analysis of variance (ANOVA) with multiple comparison test was performed. ***P < 0.001. (B) Representative results were shown. (C) OVX females of each genotype were fed 60% HFD for 10 weeks with or without E2 (control placebo n = 9, E2 n = 9; H2NES-ApoEKO placebo n = 6, E2 n = 7; αERKO-ApoEKO placebo n = 3, E2 n = 4). The sections of the aortic root were stained with Oil Red O for lesion quantification. The percentage of lesion area in the aortic root is shown. Control shows the mice obtained ApoEKO allele only from H2NES-ApoEKO and αERKO-ApoEKO groups. The graph shows the values of individual animals and mean ± SEM. 2-way ANOVA with multiple comparison test was performed. There were no statistically significant differences. (D) Representative results are shown.

References

    1. Hewitt SC, Korach KS. Estrogen receptors: new directions in the new millennium. Endocr Rev. 2018;39(5):664-675. Doi: 10.1210/er.2018-00087 - DOI - PMC - PubMed
    1. Arnal JF, Lenfant F, Métivier R, et al. Membrane and nuclear estrogen receptor alpha actions: from tissue specificity to medical implications. Physiol Rev. 2017;97(3):1045-1087. Doi: 10.1152/physrev.00024.2016 - DOI - PubMed
    1. Valverde MA, Parker MG. Classical and novel steroid actions: a unified but complex view. Trends Biochem Sci. 2002;27(4):172-173. Doi: 10.1016/s0968-0004(02)02075-3 - DOI - PubMed
    1. Levin ER, Hammes SR. Nuclear receptors outside the nucleus: extranuclear signalling by steroid receptors. Cell Res. 2016;17(12):1-15. Doi: 10.1038/nrm.2016.122 - DOI - PMC - PubMed
    1. Levin ER. Plasma membrane estrogen receptors. Trends Endocrinol Metab. 2009;20(10):477-482. Doi: 10.1016/j.tem.2009.06.009 - DOI - PMC - PubMed

LinkOut - more resources